Abstract
A method based on time delay spectrometry (TDS) was developed for measuring both magnitude and phase response of a hydrophone. The method was tested on several types of hydrophones used in medical ultrasound exposimetry over the range from 5 MHz to 18 MHz. These included PVDF spot-poled membrane, needle, and capsule designs. One needle hydrophone was designed for high-intensity focused ultrasound (HIFU) applications. The average reproducibility (after repositioning the hydrophone) of the phase measurement was 2.4 degrees. The minimum phase model, which implies that the phase response is equal to the inverse Hilbert transform of the natural logarithm of the magnitude response, was tested with TDS hydrophone data. Direct TDS-based measurements of hydrophone phase responses agreed well with calculations based on the minimum phase model, with root-mean-square differences of 1.76 degrees (PVDF spot-poled membrane hydrophone), 3.10 degrees (PVDF capsule hydrophone), 3.43 degrees (PVDF needle hydrophone) and 3.36 degrees (ceramic needle hydrophone) over the range from 5 MHz to 18 MHz. Therefore, phase responses for several types of hydrophones may be inferred from measurements of their magnitude responses. Calculation of phase response based on magnitude response using the minimum phase model is a relatively simple and practical alternative to direct measurement of phase.
Keywords: hydrophone, time delay spectrometry, phase
INTRODUCTION
Hydrophones are used extensively in medical ultrasound exposimetry experiments to measure acoustic pressure waveforms [1]. If a hydrophone frequency response (i.e., transfer function) is not sufficiently flat, then its impulse response should be deconvolved with the measured hydrophone waveform to obtain the acoustic pressure waveform. The need for deconvolution is increasing in medical ultrasound as source transducers move toward higher frequencies and broader bandwidths [2]. An International Electrotechnical Commission (IEC) standard recognizes the increased need for deconvolution and recommends that it be performed if “the uncertainty in the measurement becomes unacceptably large due to limited bandwidth of the hydrophone” [3, 4]. In order to perform a complete complex deconvolution of the hydrophone impulse response from measurements of acoustic fields, both the phase and magnitude of the hydrophone transfer function must be known. Unfortunately, however, hydrophones are often characterized only by the magnitude of their transfer function.
Direct measurement of phase can add considerable complexity to the hydrophone characterization experimental procedure. Direct phase measurements can be difficult because they can be very sensitive to small variations in the path length between the source and the hydrophone. Even subtle variations in the temperature of the water, which produce variations in the speed of sound, can produce noticeable distortions in phase measurements [18].
Several methods for measuring hydrophone transfer function phase response have been described. One is based on an optical multilayer reference hydrophone and has been validated using membrane and needle hydrophones at frequencies up to 70 MHz [5]. This approach requires optics equipment (laser, lenses, photodetector, etc.) and proficiency with optical measurement methodology that may not be available in many acoustic metrology laboratories. An optical-fiber based probe also has been suggested for use as a reference hydrophone for determining the phase response [6]. Another approach is based on nonlinear acoustic wave propagation in water [7,8]. This method is reported to be more appropriate for hydrophones that have relatively uniform (“in the range of ± 10%” [8]) frequency responses (e.g. membrane hydrophones) than hydrophones with less uniform responses due to resonances (e.g. needle hydrophones). One limitation of this approach is that it provides phase values only at integer multiples of the fundamental frequency of the source transducer [8].
Another approach employs time delay spectrometry (TDS), a swept-frequency technique originally proposed for audio applications [9, 10] and later extended to biomedical applications [11, 12]. In hydrophone characterization TDS has been used primarily for measurement of magnitude of hydrophone transfer function [13–17]. In one investigation, however, two variations of TDS (heterodyne TDS and time-gated TDS) were extended to measure transfer function phases of two membrane hydrophones from 1 to 20 MHz [18]. In another investigation, heterodyne TDS was applied for measurement of transfer function phase of a needle-type hydrophone [5].
The purpose of the current paper is two-fold. First, an alternative TDS implementation for measuring both the magnitude and phase is described. Second, the possibility that hydrophone measurement systems can be accurately modeled as minimum phase systems is investigated using the TDS-measured magnitude and phase responses. If the minimum phase condition is met, then hydrophone phase responses can be inferred from measurements of their magnitude responses, and difficult direct phase measurements therefore become unnecessary. A system may be considered minimum-phase if it and its inverse are causal and stable [19, 20]. For a minimum phase system, the phase of the transfer function is equal to the inverse Hilbert transform of the natural logarithm of the magnitude of the transfer function [19, 20]. Acoustic attenuation in soft tissues has been modeled as a minimum-phase system [21].
In this paper, the mathematical formulas to obtain magnitude and phase response functions directly from TDS measurements are derived using two methods, one based on analytic signal theory and another based on in-phase and quadrature signal analysis (I/Q demodulation). The direct phase measurement method is validated with 1) experimental measurements on phase-shifting electric circuits and 2) hydrophone axial displacement experiments. Then phase-measurements are reported for several common hydrophone designs, including a comparison of the analytic signal and I/Q demodulation methods. Finally, direct phase measurements are compared with an indirect procedure based on the minimum-phase assumption.
THEORY
A. TDS-BASED MEASUREMENT OF MAGNITUDE AND PHASE RESPONSE
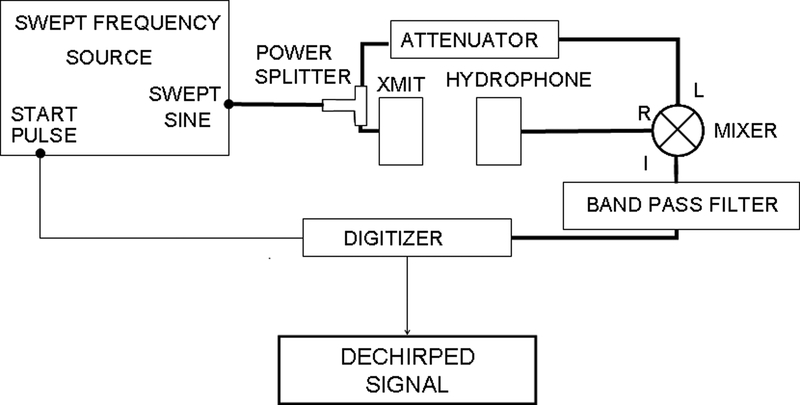
Figure 1 shows a block diagram of the TDS data acquisition system, which is the same as that described in [17] for measuring frequency-dependent magnitude response. In this section, a method is derived for processing the digitized TDS signal that allows measurement of frequency-dependent phase response also, without the need for a vector network analyzer as employed in other TDS implementations. The source signal is assumed to be a linear, swept-frequency cosine wave denoted by cos(ωt), where ω = 2πf = 2πSt, f = frequency, S = sweep rate, and t = time. This is the source signal for a measurement system that includes a source transducer, ultrasound propagation, a receiving transducer (e.g., hydrophone), receiving electronics, and any other electronics that are present (e.g., attenuators, filters, hydrophone pre-amplifier, …). The output of the measurement system is given by
| (1) |
where A(ω) is the system response with magnitude |A(ω)| and phase Arg [A(ω)] = φA(ω), Δω = 2πΔf = 2πStD is the TDS offset frequency, tD = z/c is the system delay time, c is the speed of sound, and z is the distance between the transmitting and receiving transducers. The offset frequency Δω is negative in Equation (1) to signify that the received frequency lags the source signal frequency by this offset.
1.
Block diagram of experimental setup.
In TDS, the system output (the “R” input to the mixer in Figure 1) is mixed with (i.e., multiplied by) the source signal, cos(ωt) (the “L” input to the mixer in Figure 1). The output of the mixer contains components at the sum and difference frequencies,
| (2) |
where the identity cos α cos β = (1/2) [cos (α + β) + cos (α - β)] has been used. In addition, the attenuator gain (which is frequency-independent) does not appear in Equation 2 because it is assumed that data are compensated for this value. The mixed signal is then low pass filtered to remove the sum-frequency component and retain the difference-frequency component, producing the so-called “dechirped” signal,
| (3) |
Magnitude, |A(ω)|, and phase, φA(ω), may be obtained from Equation (3) in either of two ways: using the analytic signal representation or I/Q demodulation.
1. Analytic signal
Here, |A(ω)| is assumed to vary much more slowly than cos[Δωt – φA(ω)]. The magnitude, |A(ω)|, and phase, φA(ω), of the system response may be obtained by using Equation 3 and the analytic signal representation of D(ω), which may be denoted by DR(ω) + iDI(ω), where DR(ω) = D(ω), DI(ω) = { D(ω) }, { } denotes a Hilbert transform (Papoulis, 1962), and the integration variable is t (recall that ω = 2πSt). The Hilbert transform of Equation 3 is given by
This result, which may seem intuitive for bandlimited signals, can be supported rigorously by applying Bedrosian’s theorem to the product of an amplitude-modulation function with a carrier [22, 23]. Bedrosian’s theorem is valid if the Fourier transform of |A(2πSt)|exp[-i φA(2πSt)] vanishes for frequencies with magnitudes greater than Δω, which would be expected for the bandlimited signals encountered in the present application.
The magnitude and phase of the analytic signal representation of D(ω) are given by [DR2(ω) + DI2(ω)]1/2 and arctan [DI(ω) / DR(ω)] respectively. Therefore, from Equation 3, the magnitude and phase of the system response are given by
| (4) |
| (5) |
2. I/Q demodulation
The magnitude and the phase of the system response also may be obtained from in-phase and quadrature components, I(ω) and Q(ω). These may be obtained by quadrature demodulation, which consists of multiplication of the “dechirped” signal of Eq. 3 by cos(ωct + ϕ0) to obtain I(ω) and by sin(ωct + ϕ0) to obtain Q(ω). This multiplication can performed either in hardware using mixers and filters on the analog signal or in software (as was done here, see Methods section) using multiplication and filtering on the digital signal. Either way, the mathematical representation of the signal processing is as follows.
where the identity cos α cos β = (1/2) [cos (α + β) + cos (α - β)] has been used again. Similarly,
where sin α cos β = (1/2) [sin(α + β) + sin(α - β)] has been used.
Now let the carrier frequency, ωc, be equal to the TDS offset frequency, Δω.
Next low pass filter I(ω) and Q(ω) with a cutoff frequency of Δω to retain only the baseband components.
Note that ILPF(ω) 2 + QLPF(ω) 2 = (1/16) |A(ω)| 2. Solving for magnitude and phase,
| (6) |
| (7) |
B. SUBSTITUTION CALIBRATION EXPERIMENT
The problem considered here is how to obtain the transfer function for a test hydrophone based on TDS measurements with that hydrophone and a reference hydrophone having known frequency response (magnitude and phase). Let the transfer function for all the components of the measurement system except for the hydrophone (i.e., swept frequency source and other electronics, transmitting transducer, and ultrasound propagation) be denoted by B(ω). Let the transfer functions for the test and reference hydrophones (including any integral pre-amplifiers) be denoted by HT(ω) and HR(ω). Then the total system responses measured in the test and reference experiments will be
Solving for HT(ω),
Taking the magnitude and phase,
| (8) |
If a hydrophone may be accurately characterized as a minimum phase system (which is tested in subsequent sections of this paper), then the phase of the hydrophone transfer function in Equation 8 may be obtained from magnitude measurements. For a minimum phase system, the phase of the transfer function is equal to the inverse Hilbert transform of the natural logarithm of the magnitude of the transfer function [20]. Therefore, as an alternative to Equation (8), the phase may be obtained indirectly from
| (9) |
since .
Since AR(ω) and AT(ω) are band-limited signals (due to the finite bandwidth of the source transducer), numerical calculation of the Hilbert transformations is straightforward.
METHODS
A. Data Acquisition
Five hydrophones, chosen to be representative of piezoelectric device types in common use, were tested: 1) a bilaminar PVDF membrane hydrophone with a 0.4 mm active element (model 805, Sonora Medical Systems, Longmont, CO, USA), 2) a single-layer PVDF membrane hydrophone with a 0.5 mm active element (model MHB500B, NTR Systems, Inc., Seattle, WA, USA), 3) a capsule hydrophone with a 0.2 mm active element (model HGL-0200, Onda Corp., Sunnyvale, CA, USA), 4) a PVDF needle hydrophone with a 0.6 mm active element (Danish Institute of Biomedical Engineering (now FORCE Technology, Brøndby, Denmark)), and 5) a piezoelectric ceramic needle hydrophone with a 0.4 mm active element, designed for high-intensity-focused ultrasound applications (model HNA-0400, Onda Corp., Sunnyvale, CA, USA). The magnitude and phase of the NTR membrane hydrophone were evaluated by the Physikalisch-Technische Bundesanstalt (PTB, Braunschweig, Germany) so that it could be used as a reference. All hydrophones except the 0.6 mm needle incorporated an integral preamplifier.
TDS spectrometry data were acquired using methods similar to those previously reported [17]. A frequency sweep from 0 to 20 MHz in 0.2 s (sweep rate S = 100 MHz / s) was generated (model 3325A, Hewlett Packard (now Agilent Technologies, Santa Clara, CA, USA)), which drove a circular, 0.25” diameter, 10-MHz-center-frequency source transducer (model V312, Olympus NDT, Waltham, MA, USA) in a water tank. The usable band of frequencies was approximately from 5 to 18 MHz. The receiving transducer (usually, but not always, a hydrophone, see next paragraph) was co-axially positioned a distance z (30 cm) from the source, resulting in a time delay, tD = z / c, where c is the speed of sound in water. The far field of the source began at approximately D2/4λ = 6.7 cm and 13.4 cm at 10 MHz (the center frequency of the analysis band) and 20 MHz (the maximum frequency in the sweep) respectively where D = transducer diameter. The hydrophone signal was amplified by a 40 dB, 50 kHz-20 MHz amplifier (Model 5676, Olympus-NDT, Waltham, MA). A frequency mixer (model ZAD-3, Mini-Circuits, Brooklyn, NY, USA) was used to mix the received signal with the swept frequency input signal. The frequency offset between the two signals (i.e., the TDS carrier frequency) was Δf = StD = Sz/c = 20 kHz. The mixed signal was bandpass filtered via an 8-pole Butterworth filter having a roll-off of 48 dB/octave and corner frequencies of 19.5 kHz to 20.5 kHz (model 3384, Krohn-Hite, Brocton, MA, USA) to remove the undesired chirp signal and retain the desired “dechirped” TDS signal [17]. The dechirped TDS signal (Eq. 3) was digitized and stored using a digital oscilloscope (model DSA 602, Tektronix, Beaverton, OR, USA).
Two experiments were performed in order to validate the phase measurement method. In the first experiment, measurements were performed with and without electric circuit filters that had known magnitude and phase characteristics. The filters were inserted between the receiving transducer and the mixer. The receiving transducer had a center frequency of 10 MHz and a diameter of 0.375” (model P1001HR, Valpey Fisher, Hopkinton, MA, USA). The electric circuit filters consisted of molded, silvered mica capacitors (Electro Motive Corp., Melville, NY) placed between two 6 dB attenuators. For the high-pass filter, a 345.7 pF capacitor was placed in series between the attenuators. For the low-pass filter, a 1339 pF capacitor was connected from the junction of the attenuators to ground. In order to have independent data to compare with the TDS measurements, gain and phase shift of the filters were measured at 100 kHz intervals from 100 kHz to 13 MHz using an impedance analyzer (model 4192A with 16095A probe fixture, Hewlett Packard (now Agilent Technologies, Santa Clara, CA, USA)). The impedance analyzer was used to measure the capacitances of the capacitors.
In the second experiment to validate the phase measurement method, the receiver was the Sonora model 805 hydrophone, which includes a wideband pre-amplifier. TDS data were acquired with the receiver at five different axial positions: z - 4Δz, z – Δz, z, z + Δz, and z + 4Δz where z = 30 cm and Δz = 25 microns. Assuming that the water temperature remains constant (and therefore the speed of sound remains constant) throughout the measurements, the phase difference between measurements taken at two positions z1 and z2 is Δφ = (2πf/c) (z2 – z1). The slope (with respect to frequency) predicted from this formula, (2π/c) (z2 – z1), was compared to the slope measured by performing a least-squares linear fit to measurements of TDS phase difference versus frequency for z2 – z1 = −4Δz, -Δz, Δz, and 4Δz.
B. Data Analysis
Two methods for analyzing substitution calibration experiment data to obtain hydrophone phase response were tested: 1) direct computations using phase measurements from analytic signal analysis ((Equation 5) or I/Q demodulation (Equation 7), as input to Equation 8, and 2) indirect computations using magnitude measurements from analytic signal analysis (Equation 4) or I/Q demodulation (Equation 6), as input to Equation 9.
Data analysis was performed using Matlab (Natick, MA, USA). Magnitudes and phases of dechirped signals were computed using Equations 4 – 7. Frequency-dependent phase vectors were unwrapped (in order to remove discontinuities of multiples of 2π radians) and smoothed with a rectangular filter of width 50 kHz. An integer number of 2π radians was subtracted from the frequency-dependent phase vector difference (between test and reference) so that the mean phase difference over the analysis bandwidth of 5 MHz – 18 MHz fell between 0 and 2π radians.
The substitution calibration experiment assumes that the test and reference hydrophones are placed at exactly the same depth from the source transducer. A discrepancy in these two depths will introduce an additive phase difference that is a linear function of frequency. Even a slight difference, on the order of microns, can produce a substantial effect, as will be seen in the next section. Such a positional discrepancy will affect the phase determined directly via Equation (8) but not indirectly via Equation (9). Therefore, in order to compensate for this discrepancy, 1) the difference between the direct phase difference vs. frequency measurement (Equation 8) and the indirect phase difference vs. frequency estimate (Equation 9) was least-squares fit to a linear function of frequency, and 2) this linear function of frequency was subtracted from the direct phase difference vs. frequency measurement. Note that the addition or subtraction of a linear phase function in frequency domain corresponds only to a shift in the time domain but not a change in shape of the time domain signal. Koch performed a similar linear adjustment to TDS data by analyzing a low-frequency portion of the spectrum over which the hydrophone phase response was assumed on theoretical grounds to be constant [18].
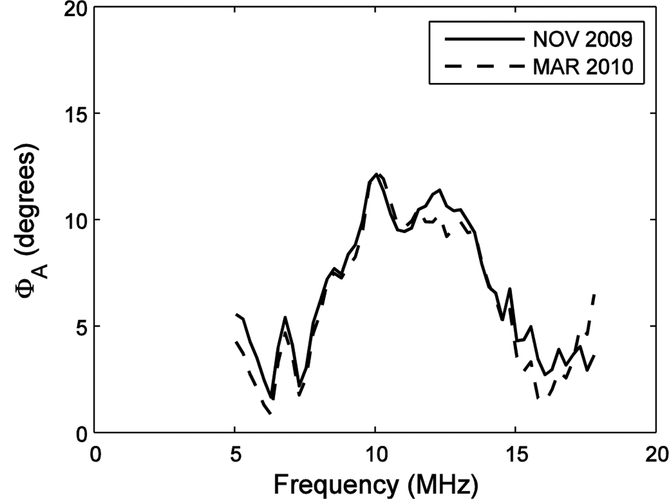
The reproducibility of the method was assessed by comparing two sets of TDS phase measurements obtained after removing the hydrophone from the tank and repositioning it. The second set of measurements (March, 2010) was performed four months after the first set of measurements (November, 2009).
The phase of B(ω), the transfer function for all the components of the measurement system except for the hydrophone, was computed for all five hydrophones using
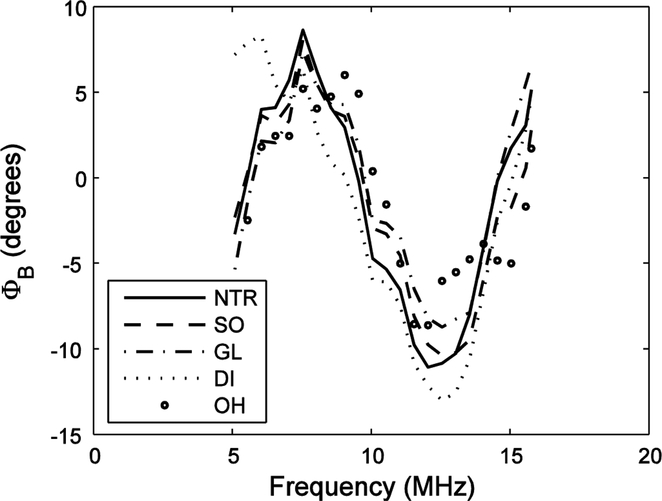
which follows from taking the phase of AT(ω) = B(ω) HT(ω). For the NTR MHB500B single-layer membrane hydrophone, Arg { HT(ω) } was provided by the independent laboratory (PTB). For the other hydrophones used in this study, Arg { HT(ω) } was measured. The five estimates of Arg { B(ω) }, which should have been constant for all hydrophones, were compared in order to check for consistency. As explained above, a linear-with-frequency phase shift was removed by subtracting a least-squares linear fit of Arg { B(ω) } vs. ω for each hydrophone.
RESULTS
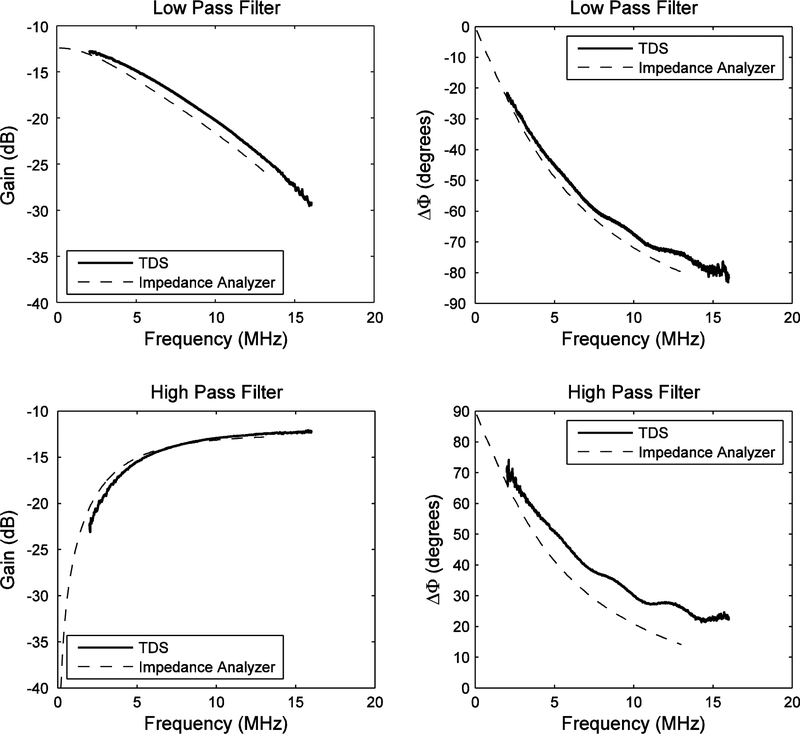
Figure 2 shows the results of the first experiment to validate the phase measurement method. Frequency-dependent gain and phase shift are shown for the low-pass and high-pass filters. The TDS measurements are in good agreement with the independent impedance analyzer measurements. The phase agreement was always within 10 degrees.
2.
First experiment to validate the phase measurement method: frequency-dependent gain and phase shift for low-pass and high-pass filters measured by TDS and by impedance analyzer.
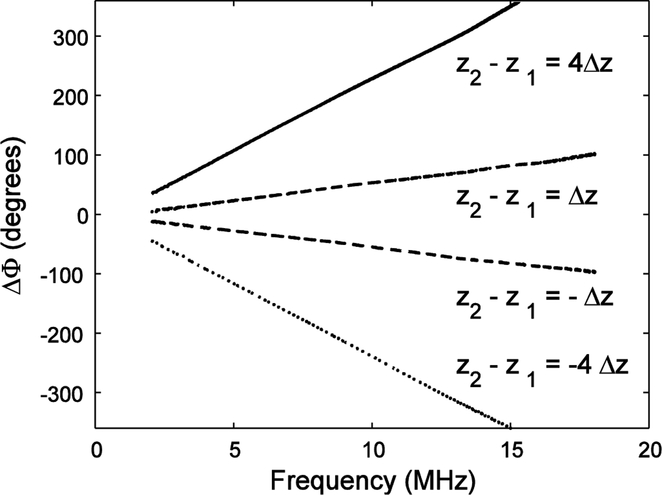
Figure 3 shows the results of the second experiment to validate the phase measurement method. For the four receiving hydrophone relative displacements considered, z2 – z1 = 4Δz, Δz, -Δz, and −4Δz, the slopes of least-squares regression fits of phase shift (Δφ) versus frequency were 0.42, 0.10, −0.09, and −0.43 radians / MHz, which corresponded to measured displacements of 100, 24, −22, and −100 μm. These values were consistent with the expected values based on Δz = 25 μm (100, 25, −25, and −100 μm). One potential source of error in measurements such as these is fluctuation in sound speed induced by fluctuation in water temperature.
3.
Second experiment to validate the phase measurement method: linear-with-frequency phase shifts resulting from hydrophone displacements by z2 – z1 = 4Δz, Δz, -Δz, and −4Δz where Δz = 25 μm. The slopes of least-squares regression fits of phase shift (Δφ) versus frequency were 0.42, 0.10, −0.09, and −0.43 radians / MHz, which corresponded to measured displacements of 100, 24, −22, and −100 μm. These expected values based on Δz = 25 μm were 100, 25, −25, and −100 μm.
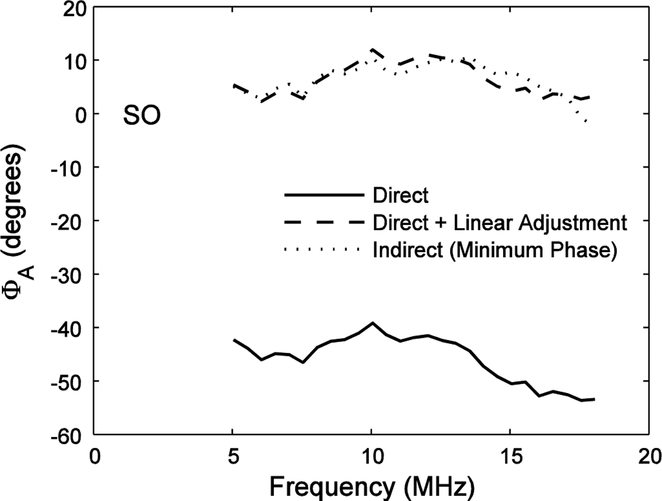
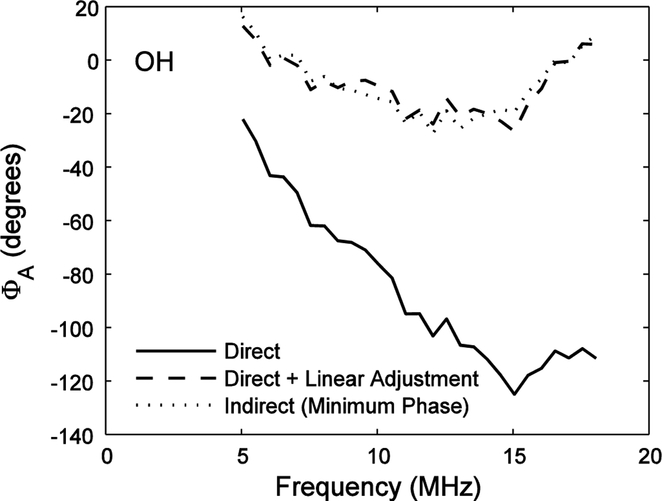
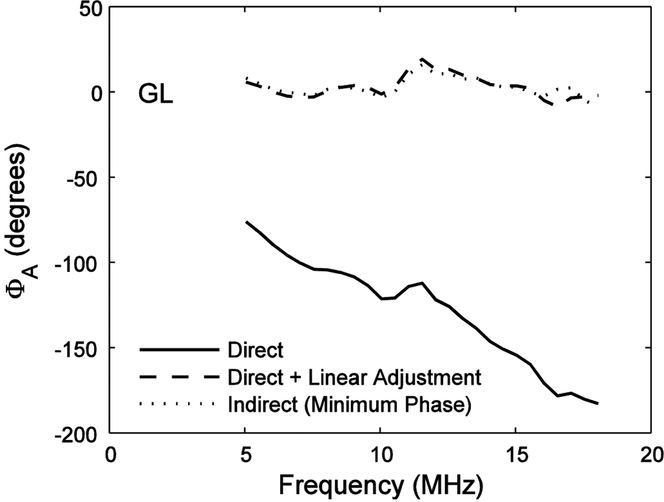
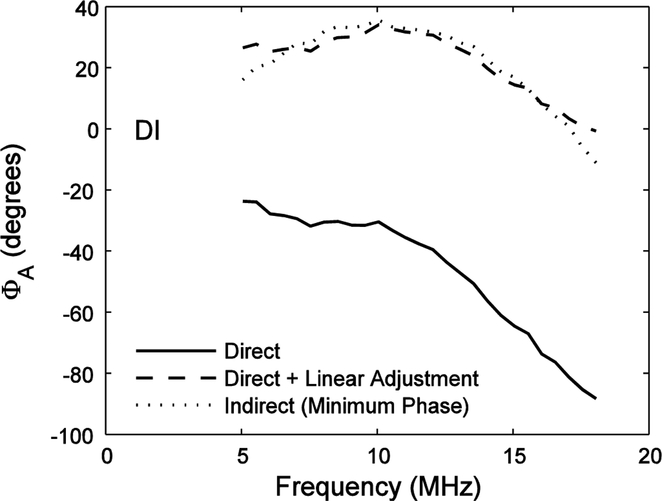
Figures 4 – 7 show phase response measurements for the Sonora (SO), Onda HGL-0200 (GL), Danish Institute of Biomedical Engineering (DI), and Onda HNA-0400 (OH) hydrophones using the calibrated NTR hydrophone as a reference. Solid lines show direct phase measurements (Equation 8). Dotted lines show indirect phase measurements (Equation 9). Dashed lines show direct phase measurements after adding linear functions to correct for hydrophone depth discrepancy (see previous section). The direct (after linear adjustment) and indirect measurements show consistent agreement over the usable frequency band (5 – 18 MHz) to within a few degrees, with root-mean-square differences of 1.76 degrees (PVDF spot-poled bilaminar membrane hydrophone), 3.10 degrees (PVDF capsule hydrophone), 3.43 degrees (PVDF needle hydrophone) and 3.36 degrees (ceramic needle hydrophone).
4.
Phase response measurements for the Sonora (SO) hydrophone using the calibrated NTR hydrophone as a reference. The solid line shows the direct phase measurement (Equation 8). The dotted line shows the indirect phase measurement (Equation 9). The dashed line shows the direct phase measurement after adding the linear function to correct for hydrophone depth discrepancy (see Methods section).
7.
Same as Figure 3 except for Onda needle (OH) hydrophone.
Figure 8 shows two TDS phase measurements, obtained after removal from tank and repositioning (four months later), for the bilaminar PVDF membrane hydrophone. The root-mean-square differences in phase after removal and repositioning (four months later) were 0.73 degrees (bilaminar PVDF membrane hydrophone), 2.49 degrees (PVDF capsule hydrophone), and 1.71 degrees (PVDF needle hydrophone) over the range from 5 – 15 MHz. Over the extended range from 5 – 18 MHz, the corresponding values were 0.98 degrees, 4.30 degrees, and 1.99 degrees respectively.
8.
Two TDS phase measurements, obtained after removal from tank and repositioning (four months later), for the bilaminar PVDF membrane hydrophone.
The analytic signal method (Equation 5) and the in-phase / quadrature method (Equation 7) yielded similar results for frequency-dependent phase differences. Before smoothing with a 50 kHz rectangular moving average window, the differences between the two methods for the four test hydrophones were (mean ± standard deviation over the range from 5 to 18 MHz) 0.01 ± 2.44 degrees (PVDF spot-poled bilaminar membrane hydrophone), −0.01 ± 2.69 degrees (PVDF capsule hydrophone), 0.03 ± 3.49 degrees (PVDF needle hydrophone), and −0.02 ± 2.77 degrees (ceramic needle hydrophone). After smoothing, the differences between the two methods were 0.01 ± 0.05 degrees (PVDF spot-poled bilaminar membrane hydrophone), −0.01 ± 0.06 degrees (PVDF capsule hydrophone), 0.03 ± 0.06 degrees (PVDF needle hydrophone), and −0.02 ± 0.06 degrees (ceramic needle hydrophone). For many applications, differences of a few degrees are not important, and therefore the two methods provide essentially equivalent results.
Figure 9 shows measurements of the phase of B(ω), the transfer function for all the components of the measurement system except for the hydrophone, obtained with all five hydrophones. The five estimates were fairly consistent, with an average standard deviation of 1.91 degrees over the range from 5 MHz and 16 MHz. The biggest discrepancy (about 12 degrees) may be seen for the Danish Institute of Biomedical Engineering hydrophone near 5 MHz, which is near the limit of the usable band of frequencies for the measurement system with this particular hydrophone, the least sensitive of the five used in this study. The sensitivities of the four hydrophones at 10 MHz were approximately 0.05 μV/Pa (PVDF spot-poled bilaminar membrane hydrophone), 0.16 μV/Pa (PVDF capsule hydrophone), 0.035 μV/Pa (PVDF needle hydrophone), 0.11 μV/Pa (ceramic needle hydrophone).
9.
Phase of the TDS system transfer function measured using all five hydrophones.
DISCUSSION AND CONCLUSIONS
A TDS-based method for measurement of hydrophone magnitude and phase response has been developed using both analytic signal analysis and in-phase / quadrature analysis. The method uses readily available components. It has been validated over the range from 5 – 18 MHz using measurements on electric circuits and experiments involving axial hydrophone displacements.
Previously, Koch validated a TDS-based phase measurement for two membrane hydrophones [18]. Wilkens and Koch showed that heterodyne TDS phase measurements agree well with measurements based on an optical multilayer reference hydrophone method for a needle-type and a membrane hydrophone [5]. The present study offers independent confirmation from a second laboratory that TDS may be used to accurately measure phase (e.g., within 10 degrees for low-pass and high-pass filters). In addition, the present study validates a TDS-based phase measurement not only for the polymeric membrane-type and needle-type hydrophones previously studied, but also the capsule and piezoelectric ceramic needle types. The approach performs well for hydrophones with sensitivity of at least 0.024 μV/Pa (which corresponds to the minimum sensitivity across the band of usable frequencies for the five hydrophones tested here). Moreover, the present study presents the mathematical analysis required to extract phase from TDS measurements.
As described in the Methods section, the linear adjustments in Figures 4 – 7 took the form of a + bf where f is frequency and a and b are fitting parameters. Nonzero values for b correspond to shifts of the signal in time domain, which can arise due to variability in hydrophone position. Nonzero values for a (which may be seen, for example, in Figure 4) are more difficult to explain. However, since they only correspond to constant multiplicative phase factors in impulse responses or transfer functions, they have little consequence for many practical applications.
TDS uses a time window to exclude ultrasound propagation paths other than the direct source-to-hydrophone path (e.g. reflections off walls of the tank and water surface). This time window corresponds to a convolution in the frequency domain that limits the spectral resolution of the TDS method. Therefore, fine structure in the magnitude or phase of the hydrophone transfer function, if it exists, can only be recovered by increasing the time window, with the consequent experimental considerations of elimination of stray signals [18]. For the TDS system of this study the frequency resolution was approximately 60 kHz.
The measurement method described in this paper provides phase response for frequencies within the usable bandwidth of the source transducer (here, 5 – 18 MHz). Phase responses over broader frequency ranges may be obtained by performing measurements with multiple source transducers and combining the results.
This paper presents the first validation of the minimum-phase model for common hydrophone measurement systems. For several different common hydrophone designs (membrane, needle, capsule), direct TDS-based measurements of phase responses closely matched measurements of phase responses obtained from magnitude responses under the assumption of minimum phase. These measurements support the hypothesis that many hydrophone measurement systems in common use in medical ultrasound exposimetry are approximately minimum phase systems. Therefore, direct phase measurements, which can be difficult due to factors such as their high sensitivity to small hydrophone position uncertainties and/or fluctuations in water temperature, may, for many applications, be replaced by straightforward Hilbert transform analysis of simpler measurements of magnitude response. As a result, the deconvolution process recommended in measurement standards for obtaining ultrasonic pressure waveforms can be accomplished more easily.
5.
Same as Figure 3 except for Onda capsule (GL) hydrophone.
6.
Same as Figure 3 except for Danish Institute of Biomedical Engineering (DI) hydrophone.
ACKNOWLEDGEMENTS
The mention of commercial products, their sources, or their use in connection with material reported herein is not to be construed as either an actual or implied endorsement of such products by the Department of Health and Human Services.
References
- [1].Harris GR, “Progress in medical ultrasound exposimetry.” IEEE Trans. Ultrason. Ferroelectr. Freq. Control 52, 717–736. 2005. [DOI] [PubMed] [Google Scholar]
- [2].Hurrell A, “Voltage to pressure conversion: are you getting ‘phased’ by the problem?” J. Phys. conf. Series, Adv. Metrol., Ultrasound Med, pp. 57–62, April 27–28 2004. [Google Scholar]
- [3].International Electrotechnical Commission IEC 62127–1. Ultrasonics – Hydrophones – Part 1: Measurement and characterization of ultrasonic fields up to 40 MHz (IEC, Geneva, Switzerland: ). 2007 [Google Scholar]
- [4].International Electrotechnical Commission IEC 62127–2. Ultrasonics – Hydrophones – Part 2: Calibration for ultrasonic fields up to 40 MHz (IEC, Geneva, Switzerland: ). Annex I 2007 [Google Scholar]
- [5].Wilkens V and Koch C “Amplitude and phase calibration of hydrophones up to 70 MHz using broadband pulse excitation and an optical reference hydrophone.” J. Acoust. Soc. Am 115, 2892–2903. 2004. [Google Scholar]
- [6].Umchid S, Gopinath R, Srinivasan K, Lewin PA, Daryoush AS, Bansal L, and and El-Sherif M, “Development of calibration techniques for ultrasonic hydrophone probes in the frequency range from 1 to 100 MHz.” Ultrasonics, 49, 306–311. 2009. [DOI] [PMC free article] [PubMed] [Google Scholar]
- [7].P Cooling M and Humphrey VF, “A nonlinear propagation model-based phase calibration technique for membrane hydrophones.” IEEE Trans. Ultrason. Ferroelectr. Freq. Control 55, 84–93. 2008. [DOI] [PubMed] [Google Scholar]
- [8].Gandhi G “Determination of phase characteristics for PVDF membrane hydrophones in the frequency range 1–100 MHz using nonlinear acoustics approach,” Drexel University. 2009. [Google Scholar]
- [9].Heyser RC, “Acoustical measurements by time delay spectrometry.” J. Audio Eng. Soc 15, 370–382 1967. [Google Scholar]
- [10].Prohs JR, Time Delay Spectrometry, “An anthology of the works of Richard C. Heyser on measurement, analysis, and perception.” New York: Audio Engineering Soc., Inc; 1988. [Google Scholar]
- [11].Heyser RC and Le Croissette DH, “A new ultrasonic imaging system using time delay spectrometry.” Ultrasound Med Biol 1, 119–131. 1974. [DOI] [PubMed] [Google Scholar]
- [12].Heyser RC, Hestenes JD, Rooney JA, Gammell PM, M. P, and Le Croissette DH, “Medical ultrasound imager based on time delay spectrometry.” Ultrasonics 27, 31–38. 1989. [DOI] [PubMed] [Google Scholar]
- [13].Lewin P, “Calibration and performance evaluation of miniature ultrasonic hydrophones using time delay spectrometry,” Proc. 1981 IEEE Ultrasonics Symp. pp. 660–664, 1981. [Google Scholar]
- [14].Pedersen PC, Lewin PA, and Bjorno L, L “Application of time-delay spectrometry for calibration of ultrasonic transducers.” IEEE Trans. Ultrason. Ferroelectr. Freq. Control 35, 185–205. 1988. [DOI] [PubMed] [Google Scholar]
- [15].Ludwig G, and Brendel K, “Calibration of hydrophones based on reciprocity and time delay spectrometry.” IEEE Trans. Ultrason. Ferro. Freq. Cont, 35, 168–174. 1988. [DOI] [PubMed] [Google Scholar]
- [16].Harris GR, Gammell PM, Lewin PA, and Radulescu EG, G. E “Interlaboratory evaluation of hydrophone sensitivity calibration from 0.1 to 2 MHz via time delay spectrometry.” Ultrasonics 42, 349–353. 2004. [DOI] [PubMed] [Google Scholar]
- [17].Gammell PM, Maruvada S, and Harris GR, “An ultrasonic time-delay spectrometry system employing digital processing.” IEEE Trans. Ultrason. Ferroelectr. Freq. Control 54, 1036–1044. 2007. [DOI] [PubMed] [Google Scholar]
- [18].Koch C, “Amplitude and phase calibration of hydrophones by heterodyne and time-gated time-delay spectrometry.” IEEE Trans. Ultrason. Ferroelectr. Freq. Control 50, 344–348. 2003. [DOI] [PubMed] [Google Scholar]
- [19].Papoullis A, The Fourier Integral and its Applications. New York, NY: McGraw-Hill, chap. 10 1962, p. 204. [Google Scholar]
- [20].Oppenheim A, and Schafer R, Digital Signal Processing. Englewood Cliffs, NJ: Prentice-Hall, Inc; 1975, p. 345. [Google Scholar]
- [21].Kuc R, “Modeling acoustic attenuation of soft tissue with a minimum-phase filter.” Ultrason. Imaging 6, 24–36. 1984. [DOI] [PubMed] [Google Scholar]
- [22].Bedrosian E, “A product theorem for Hilbert transforms.” Proc. IEEE, 51, 868–869. 1963. [Google Scholar]
- [23].Nuttall AH, and Bedrosian E, “On the quadrature approximation to the Hilbert transform of modulated signals.” Proc. IEEE, 54, 1458–1459. 1966. [Google Scholar]


