

Abstract
Background:
The relationship of training load to injury using wearable technology has not been investigated in professional American football players. The primary objective of this study was to determine the correlation between player workload and soft tissue injury over the course of a football season utilizing wearable global positioning system (GPS) technology.
Hypothesis:
Increased training load is associated with a higher incidence of soft tissue injuries.
Study Design:
Case-control study.
Level of Evidence:
Level 3.
Methods:
Player workloads were assessed during preseason and regular-season practice sessions using GPS tracking and triaxial accelerometry from 2014 to 2016. Soft tissue injuries were recorded during each season. Player workload during the week of injury (acute) and average weekly workload during the 4 weeks (chronic) prior to injury were determined for each injury and in uninjured position-matched controls during the same week. A matched-pairs t test was used to determine differences in player workload. Subgroup analysis was also conducted to determine whether observed effects were confounded by training period and type of injury.
Results:
In total, 136 lower extremity injuries were recorded. Of the recorded injuries, 101 injuries with complete GPS and clinical data were included in the analysis. Injuries were associated with greater increases in workload during the week of injury over the prior month when compared with uninjured controls. Injured players saw a 111% (95% CI, 66%-156%) increase in workload whereas uninjured players saw a 73% (95% CI, 34%-112%) increase in workload during the week of injury (P = 0.032). Individuals who had an acute to chronic workload ratio higher than 1.6 were 1.5 times more likely to sustain an injury relative to time- and position-matched controls (64.6% vs 43.1%; P = 0.004).
Conclusion:
Soft tissue injuries in professional football players were associated with sudden increases in training load over the course of a month. This effect seems to be especially pronounced during the preseason when player workloads are generally higher. These results suggest that a gradual increase of training intensity is a potential method to reduce the risk of soft tissue injury.
Clinical Relevance:
Preseason versus regular-season specific training programs monitored with wearable technology may assist team athletic training and medical staff in developing programs to optimize player performance.
Keywords: GPS, football, injury prevention
American football is characterized by bursts of intense physical exertion between periods of lower exertion or rest. While many football injuries are caused by collisions, soft tissue injuries are often noncontact in nature and may be caused by overexertion or fatigue. At the elite athlete level, soft tissue strains account for a significant proportion of injuries and subsequent loss in playing time.4,7,8 As a result, there is growing awareness of the importance of optimizing player performance and providing the safest environment possible to participate in sporting activities.
Teams across multiple sports have used a variety of methods in efforts to track injuries and player movement profiles during practice and game settings. During recent years, there has been rapidly growing use of wearable technology devices such as triaxial accelerometry and global positioning systems (GPS) in a number of sports, including Australian rules football, soccer, and rugby.11 While early uses of GPS technology involved identifying activity profiles of athletes during training or in matches, GPS and accelerometry technology has more recently been used to monitor training loads and exertion to determine correlation with injury.2,13,18 The devices use movement-based triaxial accelerometers to obtain characteristics of sporting activities such as accelerations, decelerations, jumps, and changes of direction.
The etiology of soft tissue injuries such as myotendinous strains and ligament sprains is multifactorial. One etiology of these injuries may be a function of overexertion, variation in training patterns, and fatigue.4,7,8 Hulin et al10 conducted workload-performance investigations on professional cricket and rugby players to determine the relationship between injury and workload. The study describes an “acute to chronic ratio” (ACR) that measures athlete workload during the week of injury relative to workload over the past month. The logic for using this measurement is to standardize athlete workload relative to their fitness level, reflected by their chronic workload.10 Prior studies have shown that the acute to chronic workload ratio is a more reliable predictor of injury than absolute workload alone.10,17
The relationship between soft tissue injury and training load has not been studied in American football using wearable technology. The objective of this study was to determine the association between workload, as measured using wearable technology, and soft tissue injury over the course of professional football seasons.
Methods
Participants
Institutional review board and National Football League (NFL) research committee approval was obtained prior to initiating this study. This was a 2-year longitudinal study conducted over the course of the 2014-2015 and 2015-2016 NFL seasons for a single team. One hundred fifteen players participated during the 2014-2015 season and 117 players participated during the 2015-2016 season. Each season consisted of a 14-week preseason period followed by 17 weeks of regular-season competition. Injuries were recorded and data were retrospectively analyzed.
Data Collection
This study used commercially available GPS units (Catapult OptimEye, Catapult Sports) that operated in a nondifferential mode at a sampling frequency of 15 Hz. GPS receivers were also outfitted with triaxial accelerometers that assessed magnitude and vector of full-body acceleration sampling at 100 Hz. At season’s end, GPS data from the receivers were downloaded using commercially available software (Catapult Sports). Players were provided with the same GPS receiver for the duration of the preseason and regular season. The GPS receivers were worn during all organized team activities at the team’s home facility during practice and training sessions. The GPS units were positioned between players’ scapulae in the manufacturer’s suggested custom harnesses. The players voluntarily elected to wear the devices and could remove them at any time. Players did not wear GPS units during days on which games were played because of regulations from the NFL.
The primary GPS variable of interest was player load. In this study, player load was calculated as a part of the Minimaxx analytics platform (Catapult Sports) and as part of a Cartesian formula incorporating acceleration in the forward, side-to-side, and upward/downward axes at each time point.16 It is calculated by the following formula:
In this formula, ay is anterior to posterior acceleration, ax is side to side acceleration, and az is vertical acceleration at any given time t. Player load is one of the methods for quantifying athlete external workload that has been validated in previous literature.14 In this study, we use player load as a measure of external workload on athletes.
All injuries that occurred in practice or games were recorded during the study period. Upper extremity injuries and osseous injuries involving the lower extremities were excluded. Lower extremity soft tissue injuries were subdivided into 4 categories: ankle ligamentous injuries, knee ligamentous injuries, hamstring strains, and other injuries, including soft tissue injuries involving the groin, calf, and abdominal oblique musculature. Injuries were documented and included if the player sought treatment or evaluation by any team medical staff. Injuries were recorded in the NFL electronic medical record system used across the league by the team physician or head athletic trainer. Injuries included those sustained through both contact and noncontact mechanisms.
Statistical Analysis
Player injuries and baseline demographic characteristics were summarized using descriptive statistics. Chi-square analysis was used to determine associations between player position, injury type, and time of injury. The 4 lower extremity soft tissue injury categories were combined into 2 categories: (1) myotendinous injuries including all hamstring, groin, calf, and abdominal oblique injuries, and (2) ligamentous injuries including all ankle and knee sprains. Player position was also divided into 2 groups: 1 group consisted of the defensive back (DB) and wide receiver (WR) positions, as prior studies have shown higher incidence of soft tissue injury in these positions among NFL players, and the second group consisted of all other positions.7,8
The relationship between player load and player injury was analyzed using 2 methods. In the first part of our analysis, player load data were compared among injured players over the course of a season, including preseason and the regular season. For each soft tissue injury, the mean weekly player load was calculated in the 1 week leading up to injury (injury block) and in the 4 weeks preceding the injury block (preinjury block). The mean weekly player load was also calculated from the start of preseason to the point of injury. All injuries sustained in weeks where player load was not recorded were excluded from this analysis. Additionally, this analysis included only the preseason and regular season of each NFL season. All injuries and workouts conducted in the offseason, during which players performed workouts outside of the home facility, were not included in the analysis. One-way analysis of variance was used to determine differences in player load between the injury block, preinjury block, and the running season average for the preseason, regular season, and the entire year. Post hoc Bonferroni analysis was conducted to determine differences in player load between individual blocks.
There was a significant week-to-week variation in player load over the course of each season (Figure 1). For this reason, player load of injured players was compared with uninjured players during the week and month leading up to injury as the second part of the analysis. For each soft tissue injury, the mean weekly player load in the 1 week (injury block) prior to injury and the mean weekly player load and 4 weeks leading up to the week of injury (preinjury block) were calculated. Player load difference, the difference in player load between the preinjury and injury blocks for each soft tissue injury, was determined. This comprised the injury cohort. Each injury was matched by season and week to uninjured players of the same position, which comprised the noninjured cohort. Mean player load during the injury block, preinjury block, and player load difference were also determined for the noninjured cohort. Finally, the acute-to-chronic ratio was determined as the ratio of player load in the injury block to player load in the preinjury block. A matched-pairs t test was conducted to compare mean player load during the injury block, preinjury block, player load difference, and acute to chronic ratio for the injured and noninjured cohorts. Analysis was conducted for the preseason, regular season, and entire season, encompassing both preseason and regular season. Subgroup analysis was also conducted for myotendinous injuries and ligamentous injuries.
Figure 1.
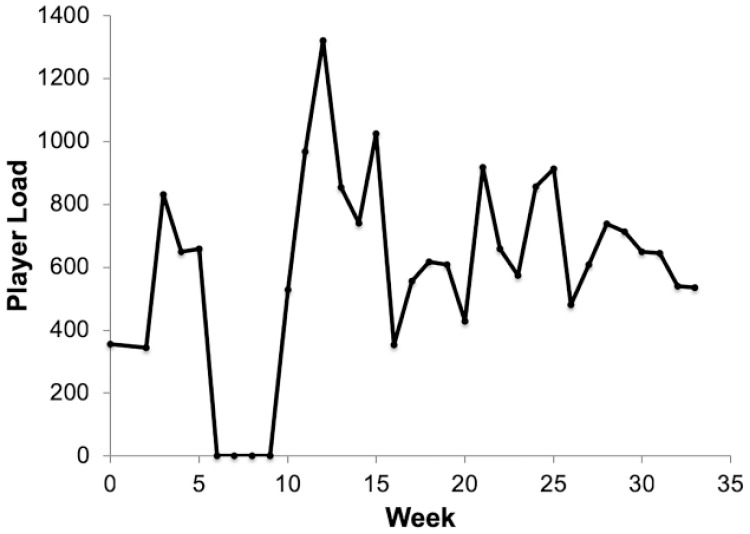
Mean weekly player workload for all players over the course of National Football League season (week 1 = July 2014/2015).
Post hoc sample size calculation was performed using the acute to chronic ratio. In a prior study of Australian football, Murray et al13 showed that individuals with an ACR > 2.0 had increased likelihood of injury compared with individuals with ACR between 0.5 and 0.99. Estimating a population ACR standard deviation of 2.5 using all available training sessions, we determined that a sample size of at least 98 per group would be required to detect an ACR difference of 1 with 80% power.13 Stata version 12.1 (StataCorp) was used for all statistical analysis. Level of significance for hypothesis testing was set to 0.05.
Results
One hundred seventeen players participated in 73 practice sessions during the 2014-2015 season and 115 players participated in 56 practice sessions during the 2015-2016 season. A total of 136 soft tissue injuries were sustained over the course of the preseason and regular-season periods. Among these, 39 (29%) were ankle sprains, 26 (19%) knee sprains, 35 (26%) hamstring strains, and 36 (26%) included all other soft tissue injuries (Table 1). Sixty-two (45.5%) injures were sustained during the 14 preseason weeks while 74 (54.5%) injuries were sustained during the 17-week regular season. Hamstring strains were sustained more often in the preseason compared with the regular season (P = 0.02). Overall, ligament injuries occurred more commonly during the regular season while myotendinous injuries occurred more commonly during the preseason (P = 0.009). The mean age for players with myotendinous injuries was significantly greater (26.1 ± 3.2) compared with mean age for players with ligamentous injuries (24.5 ± 2.5 years, P = 0.002). There was no significant association between position and type of injury (P = 0.31) (Table 2).
Table 1.
Injuries by type during the 2014 and 2015 seasons
| Injury | Number |
|---|---|
| Ankle ligamentous injury | 39 |
| Lateral ankle sprain | 27 |
| Interosseous (high ankle sprain) | 4 |
| Medial ankle sprain | 5 |
| Other (posterior tibialis, Achilles, strain) | 3 |
| Knee ligamentous injury | 26 |
| Posterior capsular strain | 9 |
| Medial collateral ligament sprain | 13a |
| Patella tendon strain | 3 |
| Multiligament injury | 1 |
| Hamstring strain | 35 |
| Other muscle strain | 36 |
| Oblique muscle strain | 8 |
| Groin strain | 15 |
| Gluteus strain | 3 |
| Hip flexor strain | 4 |
| Rectus femoris strain | 2 |
| Calf strain | 4 |
8 grade I, 4 grade II, and 1 grade III.
Table 2.
Injury characteristics during the 2014 and 2015 seasons
| Ligamentous Injuries (n = 65) | Myotendinous Injuries (n = 71) | P | |
|---|---|---|---|
| Player age, y, mean (SD) | 26.1 (3.2) | 24.5 (2.5) | 0.002 |
| Player position | |||
| WR / DB, n (%) | 25 (40.3) | 37 (59.7) | 0.31 |
| non-WR/DB positions, n (%) | 40 (54.1) | 34 (45.9) | |
| Season | |||
| Preseason, n (%) | 22 (35.5) | 40 (64.5) | 0.009 |
| Regular season, n (%) | 40 (56.3) | 31 (43.7) |
DB, defensive back; WR, wide receiver.
The mean age for players in the injury cohort was 26.1 years (SD, 2.87 years). The mean age for players in the noninjured cohort was 25.5 years (SD, 2.92 years). There was no significant difference between players in the injured versus noninjured cohort (P = 0.07). One hundred one of the 136 soft tissue injuries were associated with a complete set of GPS data and comprised the injury cohort. Of these 101 injuries, 25 were sustained by the DB position, 14 by the defensive lineman position, 8 by the linebacker position, 20 by the offensive lineman position, 1 by the quarterback position, 4 by the running back position, 8 by the tight end position, 19 by the WR position, and 2 by special teams positions. During the season, the mean player load during the week of injury for injured players was 745.6 (95% CI, 646.4-840.8). Within the injury cohort, player load during the injury block was significantly greater than mean weekly player load during the preinjury block (523.6; 95% CI, 452.6-594.5; P < 0.001). However, no significant difference was found in player load when comparing the week of injury with the mean weekly cumulative player load (746.6; 95% CI, 646.4-840.9). These relationships held true when analyzing by subgroup for preseason and regular-season injuries (Table 3). Among myotendinous injuries, player load was significantly greater during the week of injury compared with the month prior to injury over the entire season and during the preseason; however, no significant difference was observed during the regular season. Among ligamentous injuries, player load was significantly greater during the week of injury compared with the month prior to injury over the entire season and during the regular season; however, no significant difference was observed during the preseason.
Table 3.
Player load of injured players during the preinjury block and the cumulative mean weekly player load as compared with the injury block
| Injury Block (95% CI) | Preinjury Block (95% CI) | P | Cumulative Mean Weekly Player Load (95% CI) | P | |
|---|---|---|---|---|---|
| All data (n = 100) | |||||
| Full data set (n = 100) | 745.6(646.4-840.8) | 523.6 (452.6-594.5) | <0.001 | 746.6 (646.4-840.9) | 0.94 |
| Preseason (n = 36) | 867.9 (650.0-1085.9) | 427.4 (317.4-537.4) | <0.001 | 812.1 (654.6-969.7) | 0.49 |
| Regular season (n = 64) | 673.7 (582.5-764.8) | 577.7 (486.3-669.0) | <0.001 | 708.8 (623.0-794.7) | 0.20 |
| Myotendinous injuries (n = 46) | |||||
| Full data set (n = 46) | 790.7 (616.7-964.7) | 491.3 (390.1-592.5) | <0.001 | 729.6 (610.8-848.5) | 0.28 |
| Preseason (n = 20) | 944.6 (605.3-1283.9) | 327.6 (223.7-431.4) | <0.001 | 770.5 (539.2-1001.7) | 0.14 |
| Regular season (n = 26) | 672.3 (498.4-846.2) | 617.3 (469.6-764.9) | 0.093 | 698.2 (570.1-826.4) | 0.53 |
| Ligamentous injuries (n = 54) | |||||
| Full data set (n = 54) | 703.5 (596.6-810.5) | 551.1 (449.5-652.6) | 0.0024 | 760.0 (653.7-866.3) | 0.16 |
| Preseason (n = 16) | 772.2 (487.8-1056.6) | 552.2 (342.8-761.7) | 0.12 | 864.2 (631.0-1097.4) | 0.38 |
| Regular season (n = 38) | 674.6 (569.8-779.4) | 550.6 (429.5-671.7) | 0.0028 | 716.1 (596.2-836.0) | 0.27 |
For the second part of the analysis, 101 injuries in the injury cohort were matched to 339 instances in the noninjury cohort (Table 2). In the entire cohort, player load during the month prior to injury and the increase in player load from the preinjury block to the injury block were both significantly higher in the injury cohort. The ACR was also significantly higher in the injury cohort compared with the uninjured cohort (2.14; 95% CI, 1.68-2.59 vs 1.73; 95% CI, 1.34-2.12; P = 0.022). There was no significant difference in player load during the week of injury between the 2 cohorts (Figure 2a). During the preseason, there was no statistically significant difference in player load during the week of injury, month prior to injury, and ACR between the 2 cohorts. Change in player load was significantly greater in the injury cohort (Figure 2b). During the regular season, there was no statistically significant difference in player load during the week of injury, change in player load, or ACR between the 2 cohorts. Player workload during the month prior to injury was significantly lower in injured players compared with uninjured players (Figure 2c).
Figure 2.
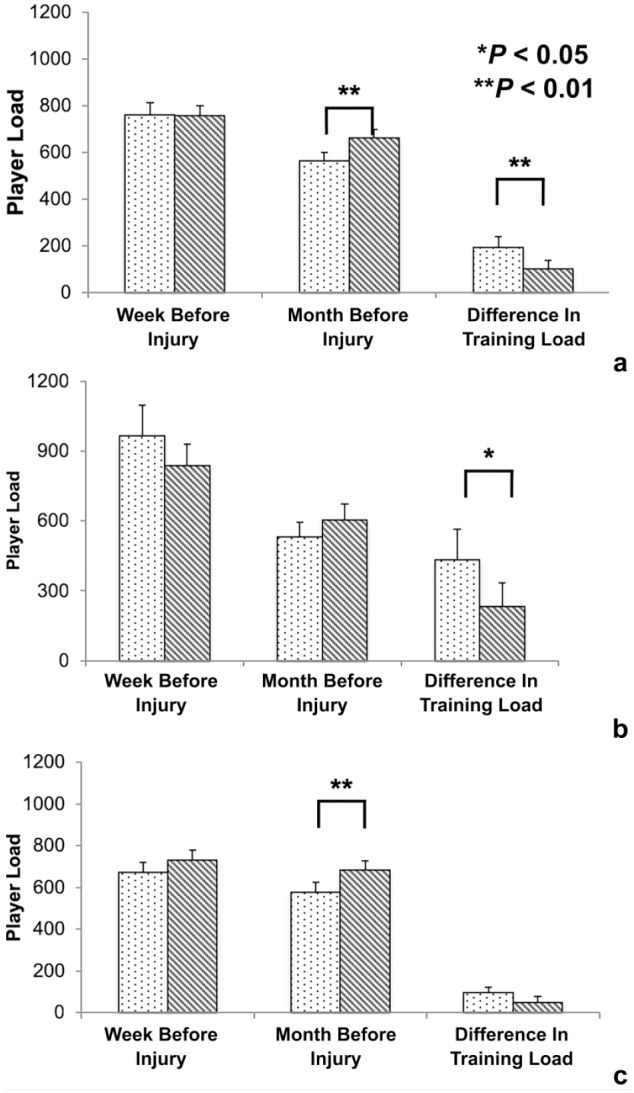
Player workload in injured versus noninjured cohorts for (a) full season, (b) preseason, and (c) regular season training session for any injury.
When including only myotendinous injuries, the injured cohort had a lower player load in the month prior to injury as well as a greater change in workload and a higher ACR (Figure 3a). In the preseason, differences in workload change and ACR were even further accentuated between the 2 cohorts (Figure 3b). In the regular season, there was no significant difference in workload change or ACR. Player workload during the month prior to injury was significantly lower in the injury cohort (Figure 3c).
Figure 3.
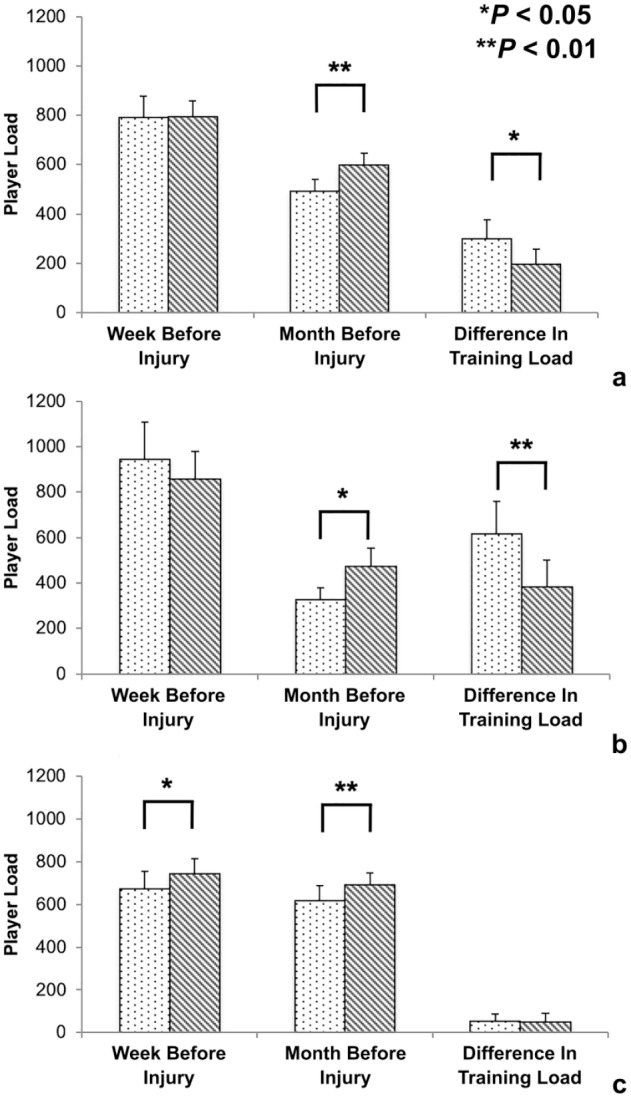
Player workload in injured versus noninjured cohorts for (a) full season, (b) preseason, and (c) regular season training session for myotendinous injuries.
When including only ligamentous injuries, workload during the month prior to injury was significantly lower in the injury cohort (Figure 4a). In the preseason, there was no significant difference in the player workload during the week of injury, the month prior to injury, the change in workload, or the ACR (Figure 4b). During the regular season, player load during the month prior to injury was significantly lower in the injury cohort. There were no differences in player load during the week of injury, change in workload, or ACR (Figure 4c).
Figure 4.
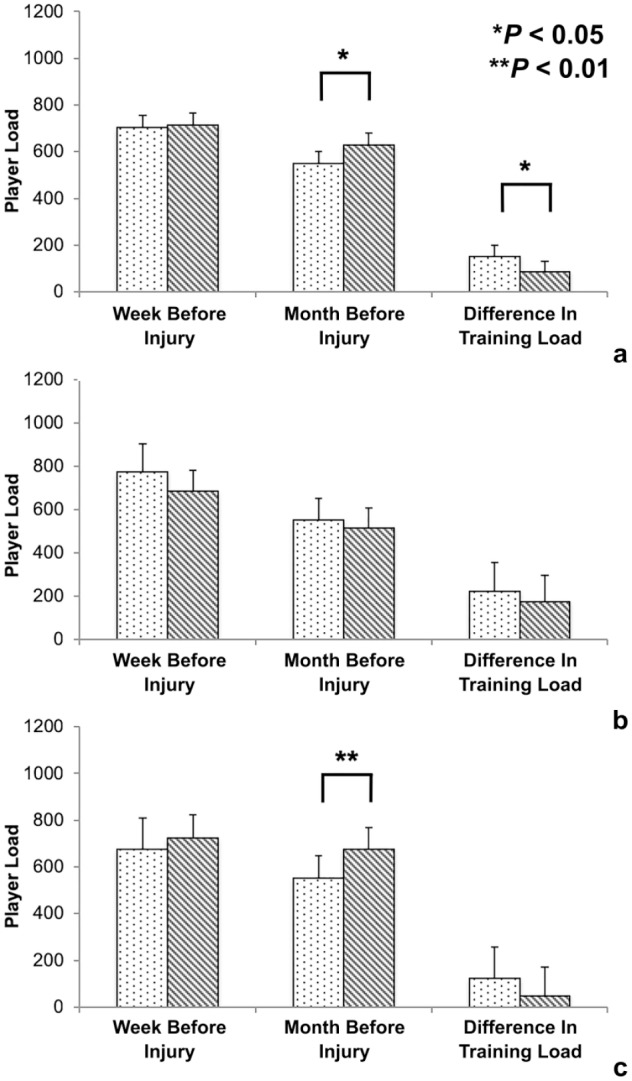
Player workload in injured versus noninjured cohorts for (a) full season, (b) preseason, and (c) regular season training session for ligamentous injuries.
Discussion
The results indicate that soft tissue injuries most often occur during weeks with a high training load in relation to the training load over the previous month. During these weeks, more dramatic increases in workload make individuals more susceptible to injury. Additionally, a greater proportion of injuries are associated with higher levels of ACR over 1.6. These findings suggest that training loads of professional football players should be individually monitored on a weekly basis.
A significantly higher prevalence of hamstring injury during the preseason compared with the regular season was found. The overall incidence of total injuries during preseason and regular season were 0.053 and 0.042 injuries per player-week, respectively (P = 0.36), while the incidence of hamstring injury during the same periods was 0.026 and 0.007 injuries per player-week (P = 0.0038). Elliott et al7 reported hamstring strains in every NFL team over a 10-year period totaling over 1700 injuries, showing that more than half (53.1%) occurred during the preseason period. DBs (23.1%) and WRs (20.8%) suffered the highest percentage of strains compared with other positions.7 These findings are corroborated by the current study, which found 65.7% of hamstring injuries were sustained by DBs and WRs.
Duhig et al5 used GPS to investigate Australian Football League players and their correlation with hamstring strain. The study found that increases in high speed running distances in the 4 weeks prior to injury (odds ratio [OR], 1.96; 95% CI, 1.54-2.51) and especially in the 1 week prior to injury (OR, 6.44; 95% CI, 2.99-14.41) increased the likelihood of hamstring injuries. The current study shows higher overall workloads and incidence of hamstring injuries during the preseason, corroborating prior findings that high exertion and increases in high speed running predispose individuals to hamstring injury.1,3
Workload had a stronger association with injury during the preseason. There was no difference in weekly workload between the injury block and the cumulative average workload starting from the beginning of preseason (P = 0.91) among injured players. However, a significant increase in mean weekly workload between the preinjury and injury blocks was found. This suggests that sudden changes in workload are associated with increased risk for injury. Large increases in workload have been associated with injury in other sports, including rugby and Australian rules football.9,15
In professional rugby players, individuals who had an ACR greater than 1.6 were 3.4 to 5.8 times more likely to sustain a match injury compared with individuals with a lower ratio.9 While the mean ACR of all players in this study was slightly higher than those reported by Hulin et al,9 the current study supports that an ACR of 1.6 or greater is associated with an increased risk of lower extremity soft tissue injury in professional American football. An increase of greater than 60% workload was associated with injury in 64.6% (42/65) of instances whereas a less than 60% workload increase was associated with injury in only 43% (59/137) of instances (P = 0.004). This effect was especially pronounced during preseason training in myotendinous injuries, as these injuries were associated with significantly greater increases in training compared with uninjured controls (599.4; 95% CI, 313.9-884.9 vs 370.8; 95% CI, 135.3-606.3; P = 0.0075). Certainly, there are players that can tolerate a much higher ACR (Appendix Table A1, available in the online version of this article). While an ACR of 1.6 provides general guidelines as an attempt to mitigate soft tissue injury, the variation of ACR tolerances between players further reinforces the need to develop personalized, player-specific risk thresholds.
Higher consistent workloads over a prolonged period of time may have a protective effect against injuries. Additionally, a temporary hiatus in training followed by a rapid increase in workload may predispose individuals to injury. The acute to chronic workload ratio is an important predictive factor for injury in elite rugby players.9 The games of rugby and American football share a number of similarities, as both are collision-based team sports involving shorter periods of intense physical exertion interspersed with periods of less strenuous physical activity. Training for both sports involves extensive conditioning drills combined with skill-specific drills. Similar to prior studies involving other sports, the current study showed that the absolute training loads over 1 week and 4 weeks were less predictive of injury compared with the relative increase in training load during the week of injury. Increased training loads over a prolonged period of time increase aerobic capacity and improved ability to engage in higher intensity exertion. However, large increases in workload relative to an individual’s physical fitness produces increased fatigue, predisposing individuals to injury.6,12,15
Subgroup analysis of myotendinous versus ligamentous injuries further clarifies the relationship between training and injury. During the preseason, individuals with myotendinous injuries experienced a dramatically greater increase in workload during the week of injury compared with their uninjured counterparts. This effect was not seen in individuals with ligamentous injuries, as there was no statistically significant difference in workload increase between injured players and their uninjured counterparts. These findings support the idea that variation in frequency and intensity of conditioning drills can have a significant effect on muscle fitness and fatigue, and subsequently affect myotendinous injury. Additionally, the findings support the notion of ligamentous injuries as traumatic injuries more closely associated with collisions that may not be as susceptible to workload variations in training.
The study also demonstrated an association between workload variation and injury during the regular season. Among injured players, an increase in weekly workload from the month prior to injury to the week of injury was observed (Table 2). However, the increase was less dramatic than that observed in injured players during the preseason. When comparing injured and uninjured players, injured individuals had a lower workload during the month prior to injury. There was no significant difference with regard to increase in player load, player load during the week of injury, and acute to chronic ratio. The results during the regular season may also be confounded by the lack of game workloads in the data set. As games are played with increased intensity during the regular season compared with the preseason due to elevated competition, in-game collisions may have a more significant impact on soft tissue injuries compared with the preseason. Additionally, workloads are likely to be increased during games in the regular season compared with the preseason, which may affect soft tissue injury. Further investigation will be required to determine the interplay between collisions, game workloads, and their effect on soft tissue injury.
The study had a number of weaknesses. Thirty-five of our 136 soft tissue injuries were associated with incomplete training data, and therefore our injury cohort did not reflect all the lower extremity soft tissue injuries over 2 seasons. The majority of “incomplete” data were associated with injuries that occurred within the first few weeks of the preseason before a complete month of workload was performed to determine an accurate ACR. When these incomplete injuries were statistically analyzed, the trends did suggest a significant increase in the ACR consistent with the other injuries with a complete data set. The data include only official preseason and regular-season practices. This does not take into account any individual offseason workouts conducted by the players, which may artificially alter workload. There are other factors that may contribute to the risk of soft tissue injury such as variations in weight room programs, hydration, sleep, nutrition, and body habitus. Finally, the analysis treated each injury independently and did not account for the effect of prior injury. Prior injury may predispose individuals to future injury by decreasing workload. However, prior injury may also influence future injuries in a number of other ways, most notably through direct trauma to soft tissues that incompletely heals prior to returning to training. To address this concern, the analysis was repeated after excluding all repeat injuries. The results showed similar conclusions both in the preseason and regular season (Appendix Table A2, available online), indicating that the conclusions appear to be valid.
Despite these weaknesses, the study is unique in several ways. The study design is a strength of this study. In the first part of the analysis, intrinsic effects such as individual player fitness and prior injury history were controlled by comparing workload in the same player between the week of injury and weeks prior to injury. In the second part of the analysis, extrinsic effects such as heat and humidity were controlled by comparing injured players with uninjured players during the same weeks.
Conclusion
Minimizing soft tissue injury risk is crucial for professional football players, as any decrease in injury can dramatically improve on-field performance. Soft tissue injuries occurred during weeks with increased exertion compared with the previous 4 weeks. During the regular season, injury was associated with overall lower training workloads in the week prior to injury and the period from 1 week to 1 month prior to injury.
Supplemental Material
Supplemental material, DS_10.1177_1941738119868477 for Does Overexertion Correlate With Increased Injury? The Relationship Between Player Workload and Soft Tissue Injury in Professional American Football Players Using Wearable Technology by Ryan T. Li, Michael J. Salata, Sagar Rambhia, Joe Sheehan and James E. Voos in Sports Health: A Multidisciplinary Approach
Footnotes
The following authors declared potential conflicts of interest: M.J.S. is a consultant for Stryker and J.E.V. is an educational consultant for Arthrex.
References
- 1. Brooks JR, Fuller CW, Kemp SP, Reddin DB. Incidence, risk, and prevention of hamstring muscle injuries in professional rugby union. Am J Sports Med. 2006;34:1297-1306. [DOI] [PubMed] [Google Scholar]
- 2. Burgess DJ, Naughton G, Norton KI. Profile of movement demands of national football players in Australia. J Sci Med Sport. 2006;9:334-341. [DOI] [PubMed] [Google Scholar]
- 3. Croisier JL, Forthomme B, Namurois MH, Vanderthommen M, Crielaard JM. Hamstring muscle strain recurrence and strength performance disorders. Am J Sports Med. 2002;30(2):199-203. [DOI] [PubMed] [Google Scholar]
- 4. Dalton SL, Kerr ZY, Dompier TP. Epidemiology of hamstring strains in 25 NCAA sports in the 2009-2010 to 2013-2014 academic years. Am J Sports Med. 2015;43:2671-2679. [DOI] [PubMed] [Google Scholar]
- 5. Duhig S, Shield AJ, Opar D, Gabbett TJ, Ferguson C, Williams M. Effect of high-speed running on hamstring strain injury risk. Br J Sports Med. 2016;50:1536-1540. [DOI] [PubMed] [Google Scholar]
- 6. Ekstrand J, Hägglund M, Waldén M. Injury incidence and injury patterns in professional football: the UEFA injury study. Br J Sports Med. 2011;45:553-558. [DOI] [PubMed] [Google Scholar]
- 7. Elliott MC, Zarins B, Powell JW, Kenyon CD. Hamstring muscle strains in professional football players a 10-year review. Am J Sports Med. 2011;39:843-850. [DOI] [PubMed] [Google Scholar]
- 8. Feeley BT, Kennelly S, Barnes RP, et al. Epidemiology of National Football League training camp injuries from 1998 to 2007. Am J Sports Med. 2008;36:1597-1603. [DOI] [PubMed] [Google Scholar]
- 9. Hulin BT, Gabbett TJ, Caputi P, Lawson DW, Sampson JA. Low chronic workload and the acute:chronic workload ratio are more predictive of injury than between-match recovery time: a two-season prospective cohort study in elite rugby league players. Br J Sports Med. 2016;50:1008-1012. [DOI] [PubMed] [Google Scholar]
- 10. Hulin BT, Gabbett TJ, Caputi P, Lawson PW, Sampson JA. The acute:chronic workload ratio predicts injury: high chronic workload may decrease injury risk in elite rugby league players. Br J Sports Med. 2016;50:231-236. [DOI] [PubMed] [Google Scholar]
- 11. Li RT, Kling SR, Salata MJ, Cupp SA, Sheehan J, Voos JE. Wearable performance devices in sports medicine. Sports Health. 2016;8:74-78. [DOI] [PMC free article] [PubMed] [Google Scholar]
- 12. Mair SD, Seaber AV, Glisson RR, Garrett WE., Jr. The role of fatigue in susceptibility to acute muscle strain injury. Am J Sports Med. 1996;24:137-143. [DOI] [PubMed] [Google Scholar]
- 13. Murray NB, Gabbett TJ, Townshend AD, Hulin BT, McLellan CP. Individual and combined effects of acute and chronic running loads on injury risk in elite Australian footballers. Scand J Med Sci Sports. 2017;27:990-998. [DOI] [PubMed] [Google Scholar]
- 14. Nicolella DP, Torres-Ronda L, Saylor KJ, Schelling X. Validity and reliability of an accelerometer-based player tracking device. PLoS One. 2018;13:e0191823. [DOI] [PMC free article] [PubMed] [Google Scholar]
- 15. Rogalski B, Dawson B, Heasman J, Gabbett TJ. Training and game loads and injury risk in elite Australian footballers. J Sci Med Sport. 2013;16:499-503. [DOI] [PubMed] [Google Scholar]
- 16. Seshadri D, Drummond C, Craker J, Rowbottom JR, Voos JE. Wearable devices for sports: new integrated technologies to better understand the physical demands of athletes in real time. IEEE Pulse. 2017;8:38-43. [DOI] [PubMed] [Google Scholar]
- 17. Windt J, Gabbett TJ, Ferris D, Khan KM. Training load-injury paradox: is greater preseason participation associated with lower in-season injury risk in elite rugby league players? Br J Sports Med. 2017;51:645-650. [DOI] [PubMed] [Google Scholar]
- 18. Wisbey B, Montgomery PG, Pyne DB, Rattray B. Quantifying movement demands of AFL football using GPS tracking. J Sci Med Sport. 2010;13:531-536. [DOI] [PubMed] [Google Scholar]
Associated Data
This section collects any data citations, data availability statements, or supplementary materials included in this article.
Supplementary Materials
Supplemental material, DS_10.1177_1941738119868477 for Does Overexertion Correlate With Increased Injury? The Relationship Between Player Workload and Soft Tissue Injury in Professional American Football Players Using Wearable Technology by Ryan T. Li, Michael J. Salata, Sagar Rambhia, Joe Sheehan and James E. Voos in Sports Health: A Multidisciplinary Approach