Abstract
Introduction
Successful initiation of spiral wave reentry in the neonatal rat ventricular myocyte (NRVM) monolayer implicitly assumes the presence of spatial dispersion of repolarization (DR), which is difficult to quantify. We recently introduced a NRVM monolayer that utilizes anthopleurin‐A to impart a prolonged plateau to the NRVM action potential. This was associated with a significant degree of spatial DR that lends itself to accurate quantification.
Methods and results
We utilized the monolayer and fluorescence optical mapping of intracellular calcium transients (FCai) to systematically study and compare the contribution of spatial dispersion of the duration of FCai (as a surrogate of DR) to induction of spiral wave reentry around a functional core versus reentry around a fixed anatomical obstacle. We show that functional reentry could be initiated by a premature stimulus acting on a substrate of spatial DR resulting in a functional line of propagation block. Subsequent wave fronts circulated around a central core of functional obstacle created by sustained depolarization from the circulating wave front. Both initiation and termination of spiral wave reentry around an anatomical obstacle consistently required participation of a region of functional propagation block. This region was similarly based on spatial DR. Spontaneous termination of spiral wave reentry also resulted from block in the functional component of the circuit obstacle, usually preceded by beat‐to‐beat slowing of propagation.
Conclusions
The study demonstrates the critical contribution of DR to spiral wave reentry around a purely functional core as well as reentry around a fixed anatomical core.
Keywords: anthopleurin‐A, dispersion of repolarization, neonatal rat ventricular myocyte monolayer, spiral wave reentry
1. INTRODUCTION
Cultured cardiac cell monolayers have become a contemporary experimental preparation for the study of fundamental mechanisms that underlie normal and pathological electrophysiology at the tissue level (Tung & Zhang, 2006). Although studies have shown that the neonatal rat ventricular myocyte (NRVM) monolayer has many of the ionic characteristics of adult ventricular myocytes (especially with respect to T tubule and sarcoplasmic reticulum Ca cycling properties) (Husse & Wassling, 1996), the triangular action potential (AP) is considered one of the major limitations of NRVM monolayer (Tung & Zhang, 2006). For example, the successful initiation of spiral wave reentry in the regular monolayer implicitly assumes the presence of spatial dispersion of repolarization (DR), which is difficult to quantify. We have recently introduced a novel NRVM monolayer preparation that addresses this limitation (Himel et al., 2013). We utilized anthopleurin‐A (AP‐A) to impart a prolonged plateau to the NRVM AP. An initial concern with the model was the expectation that an AP‐A induced prolonged plateau would result in spontaneous early after depolarizations (EADs) and triggered activity. This would have limited many of the study protocols that could be conducted in the monolayer preparation. However, our study demonstrated that plateau level prominent oscillations that could be shown in isolated single cardiac myocytes exposed to AP‐A were markedly suppressed in electronically coupled myocytes in the monolayer (Boutjdir, Restivo, Wei, Stergiopoulos, & El‐Sherif, 1994; Himel et al., 2013). Thus, the NRVM monolayer AP‐A preparation can provide a novel experimental model to study in detail the electrophysiological characteristics of spiral wave reentry around a functional core versus spiral wave reentry around a fixed anatomical core.
2. METHODS
The investigation conforms to the Guide for the Care and use of Laboratory Animals published by the US National Institutes of Health (NIH Publication, 8th Edition, 2011). Animal experiments were approved by the Institutional Review Board (Protocol# 00338). Sprague–Dawley rats were euthanatized by isoflurane 4%. Animal was placed inside chamber for 2 min with substance present (1–2 ml). After animal became unresponsive and breathing had stopped, investigators waited an additional 2 min of isoflurane exposure. If animal was unresponsive to toe pinch with forceps, this was followed by cervical dislocation.
2.1. The NRVM monolayer AP‐A model
NRVMs were obtained using a standard trypsin‐collagenase digestion protocol as previously described (Himel et al., 2013). Cells were plated onto 35 mm cell culture treated dishes, and then incubated for 3–7 days. The NRVM monolayer was stained by immersion into oxygenated Tyrode's solution (in mmol/L: 136 NaCl, 5.4 KCl, 1.8 CaCl2, 0.33 NaH2PO4, 1 MgCl2, 10 HEPES, and 10 glucose; pH 7.3) containing the fluorescent calcium dye Rhod‐2 a.m. (5 µmol/L for 30 min, Molecular Probes, Eugene, OR) at 37°C. Intracellular Ca2+ transients (FCai) were mapped at a resolution of 80 × 80 pixels and a temporal resolution of 500 Hz, using a CCD Camera (Cardio CCD‐SMQ, Redshirt Imaging, Decatur, GA). Fluorescence values were recorded with 14‐bit resolution. The circular mapping field was 15 mm in diameter. The FCaiD85 was measured using custom‐written MATLAB (MATLAB R2014a; MathWorks, Natick, MA, USA) software to measure the time from onset of the FCai signal to 85% measured from the peak of the FCai amplitude back to the baseline of the same FCai. The FCai signals were analyzed as a surrogate for voltage signal because of its much higher fluorescence intensity (Himel, Savarese, & El‐Sherif, 2011; Tung & Zhang, 2006). Although in the conventional monolayer the triangular FCaiD85 signal may be slightly different from the duration of the voltage signal, we have previously shown that in the AP‐A monolayer the prolonged FCaiD85 roughly approximates the prolonged voltage duration (Himel et al., 2013). Propagation velocity was estimated with custom‐written MATLAB software that detected the activation time of each pixel and measured the difference in activation between two points separated by a known distance located orthogonally to propagation direction.
2.2. The AP‐A monolayer mode
A stock solution of AP‐A (Sigma‐Aldrich, St. Louis, MO) was prepared by dissolving 100 µg of AP‐A into 5 ml of Tyrode's solution, giving a stock solution of 4 µM. For perfusion during experiments, 100 µl aliquots of the stock solution were dissolved in 100 ml of Tyrode's solution, resulting in a final concentration of 4 nM.
For the monolayer to be selected for study, it was first examined to confirm the presence of an interconnected confluent network that was either silent or had an intrinsic rhythm <0.5 Hz. S1 stimulation was applied at 1.0 Hz at the start of each experiment to assess overall wave front propagation. Following controlled perfusion with normal Tyrode's solution, the monolayer was perfused with AP‐A solution at a flow rate of 1–3 ml/min. The preparation was paced at a cycle length (CL) of 0.5 to 1.0 Hz with a 10 ms, 2× threshold stimulus using a bipolar electrode placed at the lower edge of the preparation. A second bipolar electrode was placed at one of three other sites of the preparation. Both electrodes were connected to a stimulator (Grass Stimulator S88, Grass Technologies, Warwick, RI) triggered by a computer‐controlled programmable pacing sequence. Single wave reentry was induced by an S1S2 stimulation protocol. The S2 stimulus was introduced following a train of S1S1 stimuli at 0.5 or 1.0 Hz at gradually shorter coupling intervals until reentry was induced or refractoriness developed. In the latter case, S2 was introduced from another site and/or the S1S2 CL was changed. For experiments with an anatomical obstacle, cells were scraped from a 2 × 3 mm section in the center of the monolayer.
During data collection, the plates were perfused with oxygenated and temperature controlled (Precision Molecular Biology Water Bath Model 180; Thermo Fisher Scientific, Pittsburgh, PA, USA) Tyrode's solution using two peristaltic pumps (Instech P720 Laboratory Peristaltic Pumps; Instech Laboratories, Inc., Plymouth Meeting, PA USA) to maintain physiologic conditions.
2.3. Statistical analysis
FCaiD85 was measured as a surrogate for action potential duration. Dispersion of FCaiD85 was quantified as the standard deviation of FCaiD85. Values for the FCaiD85 and duration dispersion of FCaiD85 during S1 stimulation at 0.5 Hz in control monolayers perfused by Tyrode's solution and monolayers perfused by AP‐A are listed as mean ± standard deviation. The two‐tailed Student's t test assessing unequal variance was used to test for difference between groups. A p‐value less than 0.05 was considered significant.
3. RESULTS
3.1. DR in the conventional monolayer versus the AP‐A monolayer model
The FCaiD85 duration in the monolayer stimulated at 0.5 Hz before superfusion with AP‐A and stimulated at 0.5 Hz was 626 ± 98 ms and the duration dispersion of FCaiD85 in the monolayer was 38 ± 16 ms (n = 6). On the other hand, the FCaiD85 duration at 0.5 Hz stimulation in monolayers superfused with AP‐A was 1,174 ± 255 ms with a duration dispersion of 182 ± 46 ms (n = 8). The difference in both FCaiD85 (Figure 1a) and the dispersion in the monolayer (Figure 1b) was highly significant, p < 0.0001 (Figure 1).
Figure 1.

Graphical representation of the FCaiD85 duration (left panel) and duration dispersion (right panel) pre‐ and post‐AP‐A superfusion with the monolayer stimulated at 0.5 Hz. Before superfusion, the FCaiD85 duration and duration dispersion in the monolayer were 626 ± 98 and 38 ± 16 ms (n = 6), respectively, and postperfusion both parameters significantly increased to 1,174 ± 255 and 182 ± 46 ms (n = 8)
3.2. Initiation and maintenance of spiral wave reentry around a functional core in the NRVM AP‐A monolayer
We studied the initiation and maintenance of spiral wave reentry in eight different AP‐A monolayers. A similar S1S2 protocol could initiate a single reentrant cycle or sustained reentry on different attempts. This is shown in Figure 2 (see also Supporting Information Movie S1). In other monolayers, a change of the site of S2 application and/or the coupling interval was required to initiate sustained reentry.
Figure 2.
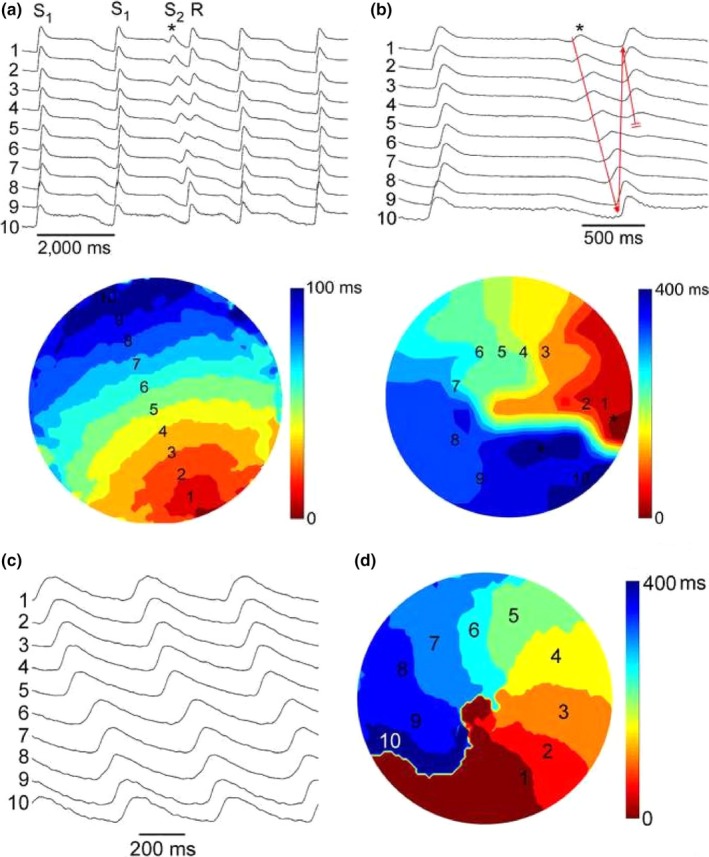
Panels (a) and (b): Initiation of a single spiral wave reentry by an S1S2 protocol. The figure illustrates the last two beats of a series of 10 S1S1 stimulations at 0.5 Hz from a site close to the bottom of the optical field. The preparation was perfused with 4 nM AP‐A, resulting in prolongation of FCaiD85 to 1,500–1,600 ms. An S2 stimulus was applied to a site close to the right edge of the optical field at a CL of 1,250 ms (marked by asterisk) and induced a single reentrant spiral wave (R). Panel (a) shows 10 selected FCai potentials to illustrate the pathway of the FCai propagation wave of the S2 stimulus. Panel (b) illustrates an expanded view of the last S1 stimulus, the S2 stimulus, and the single spiral wave reentry. The isochronal map of both the S1 and S2 stimuli is shown underneath. The S1 map is drawn at 10 ms isochrones while the S2 map is drawn at 40 ms isochrones. The S1 stimulus resulted in a smooth propagation wave from the bottom to the top of the optical field at an average conduction velocity of 15 cm/s. On the other hand, the S2 stimulus failed to propagate to the bottom right half of the optical field resulting in a line of functional block that extended from the right edge to the middle of the optical field. The FCai wave front circulated around the left side edge of the line of block. However, the circulating wave front failed to propagate through the bottom side of the line of block, thus resulting in a single reentrant cycle. The expanded recordings in panel (b) illustrate both propagation of the circulating wave front (red arrow) and its final failure of propagation at the lower side of the line of functional block (double red bars). Panels (c) and (d) illustrate FCai signals and an isochronal map of sustained spiral wave reentry that was obtained 30 s following the recording in Panel (a) utilizing a similar S1S2 protocol. The spiral rotated at a CL of 400 ms around a 2 mm diameter core in the center of the optical field at approximately the same site as the left side end of the line of functional propagation block during the initiation of reentry in figure (a)
Figure 3a illustrates the FCaiD85 map of the S1 beat that preceded the onset of spiral wave reentry shown in Figure 2. Panel B shows two representative FCai signals obtained from two pixels in isochrones 160 and 360 ms and illustrate a 200 ms difference in FCaiD85.
Figure 3.
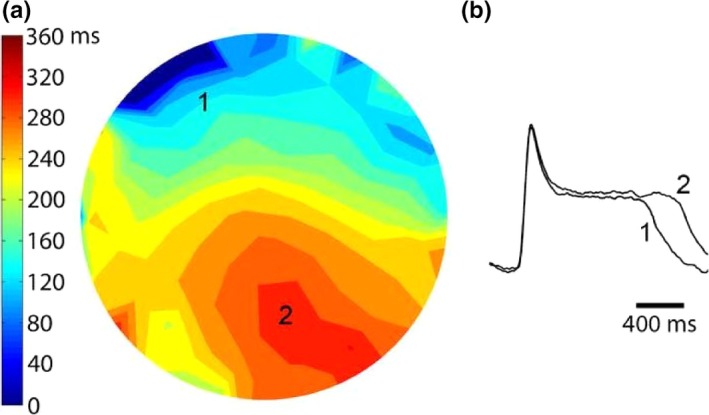
Panel (a) illustrates the repolarization map of the S1 beat that preceded the onset of spiral wave reentry shown in Figure 2. Isochrones of FCaiD85 were mapped at 40 ms duration. The line of functional propagation block around which the spiral wave reentry circulated developed at zones of crowded isochrones reflecting spatial dispersion of FCaiD85. Panel (b) shows two representative FCai signals recorded from two pixels in isochrones 160 and 360 ms and illustrate a 200 ms difference in FCaiD85
In eight different experiments, the duration dispersion of FCaiD80 in the monolayer during basic stimulation at 0.5 Hz and successful S1S2 initiation of spiral wave reentry was 182 ± 46 ms. More important than the duration dispersion of FCaiD85 is the spatial distribution with zones of crowded isochrones. The S2‐induced lines of functional propagation block consistently developed at zones of crowded isochrones.
Figure 4 shows that the core of the spiral is made of a small area of tissue which is depolarized and refractory but is likely to be functionally normal.
Figure 4.
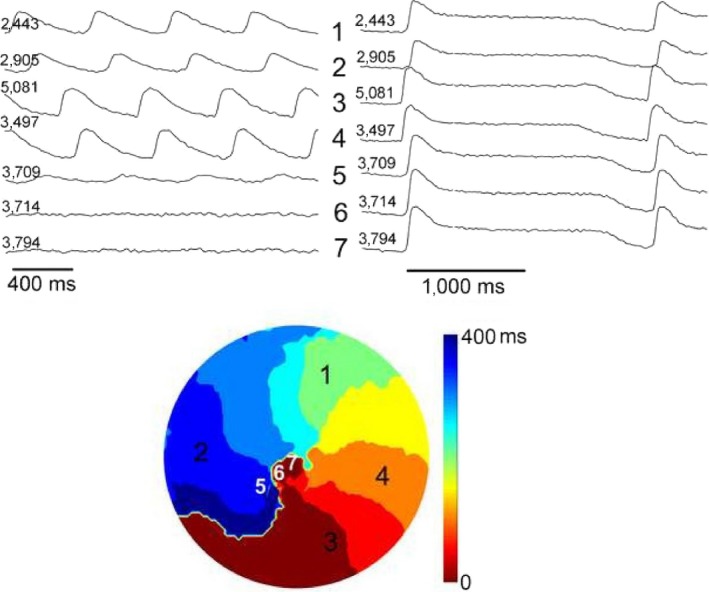
Illustrates the nature of FCai potentials in the core of the spiral wave reentry. The left panel illustrates selective FCai signals during sustained spiral wave reentry. The right panel illustrates the same signals during stimulation at 0.5 Hz. During reentry, there was a 2 mm diameter confluent zone of steady‐state small oscillations (sites 6 and 7). The approach to this zone showed low amplitude signals (site 5). The core of the spiral is made of a small area of tissue, which is depolarized and refractory, thus constituting a functional obstacle. This area is functionally normal during regular stimulation as shown in the right panel
3.3. Initiation and termination of spiral wave reentry around an anatomical core in the AP‐A monolayer
Figure 5a was obtained from a monolayer with a fixed anatomical obstacle and illustrates the FCaiD85 map of the S1 stimulus that preceded the onset of spiral wave reentry. The figure shows a zone of spatial dispersion FCaiD85 that extends from the central anatomical obstacle to the edge of the monolayer along the 2 o'clock line. Figure 5b illustrates two representative recordings of FCai signals from opposite sides of the zone of crowded isochrones.
Figure 5.
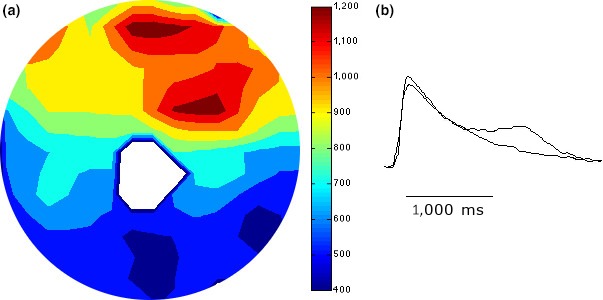
Panel (a) was obtained from a monolayer with a fixed anatomical obstacle and illustrates the FCaiD85 map of the S1 stimulus that preceded the onset of spiral wave reentry. The figure shows a zone of spatial dispersion of FCaiD85 that extends from the central anatomical obstacle to the edge of the monolayer along the 2 o'clock line. Panel (b) illustrates two representative recordings of FCai from opposite sides of the zone of crowded isochrones. The FCaiD85 was 1,505 and 1,940 ms, respectively
Figure 6 demonstrates the initiation of spiral wave reentry by an S1S2 stimulation protocol. The S2 stimulus was applied to a site close to the zone of functional spatial dispersion of FCaiD85 and induced a single spiral wave. The S2 stimulus failed to propagate in a counterclockwise direction because of a continuous line of block that included the central anatomical obstacle and a functional line of block that extended to the edge of the monolayer approximately between the 1 and 2 o'clock positions. The propagation wave front instead circulated in a clockwise direction around the central anatomical obstacle but failed to break through the functional line of block at the 1 o'clock zone, thus resulting in a single reentrant cycle (Supporting Information Movie S2). Figure 6 also illustrates the possible electrophysiological mechanism of the failure to induce repetitive spiral wave reentry by this S1S2 protocol based on differential shortening of the FCaiD85 signals on each sides of the functional line of block.
Figure 6.
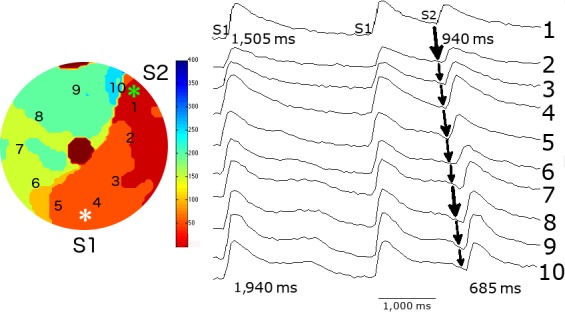
Initiation of spiral wave reentry by an S1S2 stimulation protocol from the monolayer with a central anatomical obstacle. The middle panel illustrates the last two beats of a series of 10 S1S1 stimuli at 0.5 Hz and their position is shown in the right panel. An S2 stimulus (marked by asterisk) was applied to a site close to the zone of functional spatial dispersion of FCaiD85 and induced a single reentrant spiral wave. The selected FCai signals of S2 stimulus illustrate the pathway of the FCai propagation wave. The isochronal map of the S2 stimulus is shown on the left panel. The S2 stimulus failed to propagate in a counterclockwise direction because of a continuous line of block that includes the central anatomical obstacle and a functional zone of block. The wave front instead circulated in a clockwise direction around the central anatomical obstacle but failed to propagate through the functional line of block at the 1 o'clock zone, thus resulting in a single reentrant cycle. The figure illustrates the possible electrophysiological mechanism of the failure of the counterclockwise wave front to break through the line of functional block. The FCaiD85 of the two S1 signals on each side of the line of functional block were 1,505 and 1,940 ms. The duration of the closely coupled S2 signal at both sites showed significant shortening as expected. However, there was relatively more shortening of the FCaiD85 bottom signal. This resulted in a shorter duration of the FCaiD85 bottom S2 signal on the left side of the functional block compared to the FCaiD85 top S2 signal on the right side of the line of block. Repetitive reentry would have required a longer duration of the FCaiD85 S2 signal of the left side of the line of functional block compared to the signal on the right side of the block
Figure 7 illustrates the initiation and spontaneous termination of spiral wave reentry from a different monolayer with a fixed anatomical core. The figure shows FCai recordings from one pixel that illustrate the last three of a series of 10 S1 stimuli at a CL of 1 Hz followed by an S2 stimulus that initiated a train of nine cycles of spiral waves that terminated spontaneously. Figure 8 illustrates the mechanism of spontaneous termination of the spiral wave reentry. The termination was associated with a gradual increase of successive reentrant cycle length representing slowing of propagation before final block. The propagation delay and terminal block of reentrant activation took place in the normal section of the monolayer outside the fixed anatomical obstacle.
Figure 7.
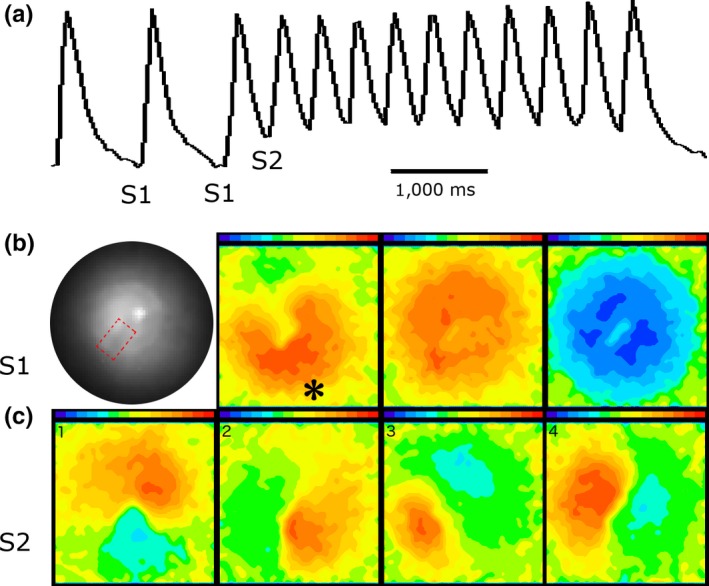
The figure illustrates the initiation and spontaneous termination of spiral wave reentry from a different monolayer with a fixed anatomical core. Panel (a) shows FCai recordings from one pixel that illustrates the last three of a series of 10 S1 stimuli at a CL of 1 Hz followed by an S2 stimulus that initiated a train of nine cycles of spiral waves that terminated spontaneously. Panel (b) consists of four sections. The section on the left is a low power fluoroscopic image of the monolayer that illustrates the anatomical obstacle that was created in the middle of the monolayer by scraping the cells from a 2 × 3 mm section (visible as a darker zone in the fluoroscopic image compared to the rest of the monolayer and is delineated by dotted line). The remaining three sections illustrate the FCai wave front of the S1 stimulus. The propagation of FCai signal is represented in red while the absence of FCai signals in the monolayer is represented in blue. The site of the S1 stimulus is marked by an asterisk. The advancing FCai wave front circulated around the anatomical obstacle (section 2) and propagated quickly within less than 40 ms to the rest of the monolayer (section 3) before the monolayer became quiet during the interval between successive S1 stimuli (labeled blue). Panel (c) illustrates sequential recordings of the clockwise rotating FCai wave front (consecutive sections 1 to 4) representing spiral wave reentry
Figure 8.
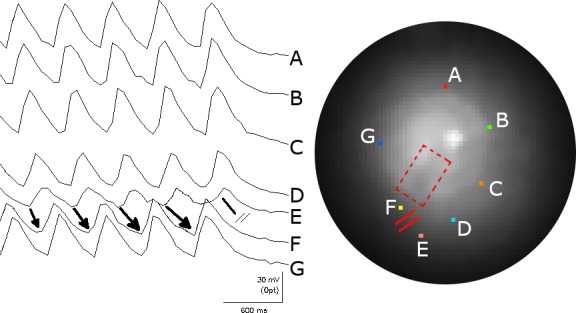
The mechanism of spontaneous termination of the spiral wave reentry. The figure illustrates seven FCai signals from selected pixels around the spiral wave front (marked by different colors on the fluoroscopic image of the monolayer and labeled A to G). The recording illustrates the sequential rotation of the FCai wave front around the anatomical obstacle. The termination of the spiral wave reentry occurred at a site located between the E and F traces (marked by a line with double cross bars). The gradual lengthening of the arrows drawn between the E and F traces represents gradual slowing of propagation of the FCai wave front between these two sites before propagation failure terminated the reentrant activation. The conduction delay and terminal block of reentrant activation took place in the normal section of the monolayer outside the fixed anatomical obstacle. Thus, termination of the circulating wave front has to occur at a continuous line of block that consists of the anatomical fixed obstacle and a functional line of block that extends the electrophysiological barrier to the edge of the monolayer
4. DISCUSSION
4.1. Initiation of reentry by programmed stimulation
With the advent of the monolayer as an appropriate model for reentry, several studies have investigated the electrophysiological mechanisms of spiral wave reentry initiation and termination in both the conventional monolayer and in monolayers with fixed anatomical obstacle (Agladze, Kay, Krinsky, & Sarvazyan, 2007; Entcheva, Lu, Troppman, Sharma, & Tung, 2000; Lim, Maskara, Aguel, Emokpae, & Tung, 2006; Tung & Zhang, 2006). The successful initiation of spiral wave reentry in the conventional monolayer implicitly assumes the presence of spatial DR that is usually difficult to quantify (Tung & Zhang, 2006). On the other hand, Entcheva and associates described spiral wave reentry around an anatomical obstacle in the NRVM monolayer initiated by an S1S2 stimulation protocol (Entcheva et al., 2000). As in the present study, the obstacle was created by scraping away cells from the center of the monolayer. However, details of the initiation and termination of the reentrant activity were not well demonstrated. Later, Lim et al. initiated spiral wave reentry attached to a millimeter‐sized obstacle in the NRVM (Lim et al., 2006). Spiral waves exhibited properties of both unattached functional spiral waves and anatomical reentry. The authors suggested that these properties may be representative of functional reentry dynamics in cardiac tissue, particularly in the setting of monomorphic tachyarrhythmias.
4.2. Advantage of the AP‐A monolayer model for study of DR and reentry
One of the major limitations of conventional NRVM monolayer is the brief triangular AP. The neurotoxin AP‐A and the closely similar neurotoxin ATX‐II have been shown to change the kinetics of late Na+ current (Boutjdir et al., 1994; El‐Sherif, Fozzard, & Hanck, 1992). A persistent Na+ current can result in marked prolongation of the plateau in a bradycardia‐dependent manner. As is shown in this study, this was accompanied by a significant degree of spatial DR that lends itself to accurate quantification. Suppression of EADs in the monolayer helps to create an experimental model unencumbered by EAD‐triggered focal activity in which the arrhythmogenic substrate of DR could be systematically investigated by programmed stimulation, including site and CL‐controlled introduction of a premature stimulus. The study showed that functional reentry could be initiated by a premature stimulus acting on a substrate of spatial DR resulting in a functional line of propagation block. Subsequent wave fronts circulated around a small central core of functional obstacle created by sustained depolarization from the circulating wave front. The study also clearly demonstrated that both the initiation and termination of spiral wave reentry around an anatomical fixed obstacle in the monolayer require the participation of a region of functional block. This region is similarly based on spatial DR. Spontaneous termination of spiral wave reentry also resulted from block in the functional component of the obstacle. Block in the functional component of the obstacle was usually preceded by a detectable beat‐to‐beat slowing of conduction with the resultant gradual lengthening of the spiral wave reentry's CL.
4.3. Clinical correlate
Despite significant difference between reentrant rhythm in the simple monolayer and reentrant rhythm in the 3‐D structure of the human heart, the present study provides insight into current clinical management strategy for ablation of the arrhythmias. Since the original description of the figure‐eight reentrant tachycardia and the critical site for successful ablation (El‐Sherif, Mehra, Gough, & Zeiler, 1983), clinical efforts were directed toward accurate mapping of the reentrant pathway (Stevenson, 2005). It was later realized that in the postinfarction heart, the myocardial scar is usually complex with islands of surviving myocardium and sometimes more than one reentrant tachyarrhythmia may be induced. A more practical strategy gradually evolved that entailed electro‐anatomic mapping of the scar zone (low amplitude electrical potentials) and island of viable myocardium (large electrical potentials). The present study has shown that in a reentrant rhythm around an anatomical core, the critical component of the circuit resides in the region of viable myocardium where reentry could be interrupted. Similarly, the clinical strategy is to apply ablative energy to as many zones of viable myocardium as necessary to make the arrhythmia noninducible (Raymond, Sacher, Winslow, Tedrow, & Stevenson, 2009). Although less elegant than mapping of the reentrant pathway in the monolayer, the technique is frequently successful.
4.4. Limitations
Although the NRVM‐AP‐A monolayer model creates an action potential that may seem morphologically close to human ventricular myocytes, it obviously does not reproduce the same ionic current densities and kinetics as in the human myocyte. The model simulates more closely the clinical electrophysiological substrate seen in the long QT syndrome (LQTS) where prolongation of action potential duration has been associated with increased spatial DR (El‐Sherif, Caref, Yin, & Restivo, 1996). In clinical LQTS, DR usually develops because of differences in ion channel characteristics of cells, usually across the left ventricular wall (Antezelevich, 2001). The mechanism(s) of the marked DR in the AP‐A‐monolayer shown in this study requires further investigation. These could include minor to moderate disparities in ion channel characteristics, differences in cell size, and intercellular connections.
CONFLICT OF INTEREST
There is no conflict of interest.
Supporting information
Himel HD, Cupelli M, Gantt M, Boutjdir M, El‐Sherif N. Role of spatial dispersion of repolarization in reentry around a functional core versus reentry around a fixed anatomical core. Ann Noninvasive Electrocardiol. 2019;24:e12647 10.1111/anec.12647
Funding information
This work was supported by the Narrows Institute for Biomedical Research and Education Cardiovascular Research Funds and Award Number I01BX007080 from Biomedical Laboratory Research & Development Service of Veterans Affairs Office of Research and Development.
REFERENCES
- Agladze, K. , Kay, M. W. , Krinsky, V. , & Sarvazyan, N. (2007). Interaction between spiral and paced waves in cardiac tissue. American Journal of Physiology‐Heart and Circulatory Physiology, 293(1), H503–H513. 10.1152/ajpheart.01060.2006 [DOI] [PMC free article] [PubMed] [Google Scholar]
- Antezelevich, C. (2001). Heterogeneity of cellular repolarization in LQTS: The role of M cells. European Heart Journal Supplements, 3(Suppl. K), K2–K16. 10.1016/S1520-765X(01)90001-X [DOI] [Google Scholar]
- Boutjdir, M. , Restivo, M. , Wei, Y. , Stergiopoulos, K. , & El‐Sherif, N. (1994). Early afterdepolarizations formation in cardiac myocytes: Analysis of phase plane patterns, action potential, and membrane currents. Journal of Cardiovascular Electrophysiology, 5(7), 609–620. 10.1111/j.1540-8167.1994.tb01302.x [DOI] [PubMed] [Google Scholar]
- El‐Sherif, N. , Caref, E. B. , Yin, H. , & Restivo, M. (1996). The electrophysiological mechanism of ventricular tachyarrhythmias in the long QT syndrome. Tridimensional mapping of activation and recovery patterns. Circulation Research, 79(3), 474–492. 10.1161/01.res.79.3.474 [DOI] [PubMed] [Google Scholar]
- El‐Sherif, N. , Fozzard, H. A. , & Hanck, D. (1992). Dose‐dependent modulation of the cardiac sodium channel by the sea anemone toxin ATX‐II. Circulation Research, 70(2), 285–301. 10.1161/01.RES.70.2.285 [DOI] [PubMed] [Google Scholar]
- El‐Sherif, N. , Mehra, R. , Gough, W. B. , & Zeiler, R. H. (1983). Reentrant ventricular arrhythmias in the late myocardial infarction period. Interruption of reentrant circuits by cryothermal techniques. Circulation, 68(3), 644–656. 10.1161/01.CIR.68.3.644 [DOI] [PubMed] [Google Scholar]
- Entcheva, E. , Lu, S. N. , Troppman, R. H. , Sharma, V. , & Tung, L. (2000). Contact fluorescence imaging of reentry in monolayers of cultures neonatal rat ventricular myocytes. Journal of Cardiovascular Electrophysiology, 11(6), 665–676. 10.1111/j.1540-8167.2000.tb00029.x [DOI] [PubMed] [Google Scholar]
- Himel, H. , Garny, A. , Noble, P. J. , Wadgaonkar, R. , Savarese, J. , Liu, N. , … El‐Sherif, N. (2013). Electrotonic suppression of early after depolarizations in the neonatal rat ventricular myocyte monolayer. The Journal of Physiology, 591(21), 5357–5364. 10.1113/jphysiol.2013.262923 [DOI] [PMC free article] [PubMed] [Google Scholar]
- Himel, H. , Savarese, J. , & El‐Sherif, N. (2011). Photodiodes – communications, bio‐sensings, measurements and high‐energy physics. Chapter 8: The photodiode array: A critical cornerstone in cardiac optical mapping. 10.5772/19094 [DOI]
- Husse, B. , & Wassling, M. (1996). Developmental changes of calcium transients and contractility during the cultivation of rat neonatal cardiomyocytes. Molecular and Cellular Biochemistry, 163–164, 13–21. [DOI] [PubMed] [Google Scholar]
- Lim, Z. Y. , Maskara, B. , Aguel, F. , Emokpae, R. , & Tung, L. (2006). Spiral wave attachment to millimeter‐sized obstacles. Circulation, 114(20), 2113–2121. 10.1161/circulationaha.105.598631 [DOI] [PubMed] [Google Scholar]
- Raymond, J. M. , Sacher, F. , Winslow, R. , Tedrow, U. , & Stevenson, W. G. (2009). Catheter ablation of scar‐related ventricular tachycardias. Current Problems in Cardiology, 34(5), 225–270. 10.1016/j.cpcardiol.2009.01.002 [DOI] [PubMed] [Google Scholar]
- Stevenson, W. G. (2005). Catheter ablation of monomorphic ventricular tachycardia. Current Opinion in Cardiology, 20(1), 42–47. 10.1097/01.hco.0000147380.90251.60 [DOI] [PubMed] [Google Scholar]
- Tung, L. , & Zhang, Y. (2006). Optical mapping of arrhythmias in tissue culture. Journal of Electrocardiology, 39(4 Suppl.), S2–S6. 10.1016/j.jelectrocard.2006.04.010 [DOI] [PubMed] [Google Scholar]
Associated Data
This section collects any data citations, data availability statements, or supplementary materials included in this article.
Supplementary Materials


