Abstract
Background
Recently a new risk marker for drug‐induced arrhythmias called index of cardio‐electrophysiological balance (iCEB), measured as QT interval divided by QRS duration, was evaluated in an animal model. It was hypothesized that iCEB is equivalent to the cardiac wavelength λ (λ = effective refractory period (ERP) x conduction velocity) and that an increased or decreased value of iCEB would potentially predict an increased susceptibility to TdP or non‐TdP mediated VT/VF, respectively.
Methods
First, the correlation between QT interval and ERP was evaluated by invasively measuring ERP during a ventricular stimulation protocol in humans (N = 40). Then the effect of administration of sotalol and flecainide on iCEB was measured in 40 patients with supraventricular tachycardias. Finally iCEB was assessed in carriers of a long QT syndrome (LQTS, N = 70) or Brugada syndrome (BrS, N = 57) mutation and compared them with genotype negative family members (N = 65).
Results
The correlation between QT interval and ERP was established (Pearson R2 = 0.25) which suggests that iCEB≈ERPxCV≈QT/QRS. Sotalol administration increased iCEB (+ 0.23; P = 0.01), while it decreased with the administration of flecainide (–0.21, P = 0.03). In the LQTS group iCEB was increased (5.22 ± 0.93, P < 0.0001) compared to genotype negative family members (4.24 ± 0.5), while it was decreased in the BrS group (3.52 ± 0.43, P < 0.0001).
Conclusions
Our data suggest that iCEB (QT/QRS) is a simple but effective ECG surrogate of cardiac wavelength. iCEB is increased in situations that predispose to TdP and is decreased in situations that predispose to non‐TdP mediated VT/VF. Therefore, iCEB might serve as a noninvasive and readily measurable marker to detect increased arrhythmic risk.
Keywords: index of cardio‐electrophysiological balance; iCEB, risk stratification; sudden cardiac death; cardiac wavelength
MANUSCRIPT TEXT
Risk stratification for sudden cardiac death due to drug‐induced arrhythmias, acquired heart disease or hereditary heart disease remains challenging. To date there is no comprehensive, easy to measure and widely available risk marker available. The QT interval is an ECG surrogate for action potential duration and is the most widely used ECG risk marker for arrhythmias.1 Prolonged QT interval is commonly used as a risk marker to detect individuals prone to develop torsades de pointes (TdP), a type of polymorphic ventricular tachycardia (VT) or ventricular fibrillation (VF) in the context of prolonged QTc. Patients at risk for the development of nontorsadogenic VT/VF are not identified if only QTc is evaluated, emphasizing the need for additional biomarkers.
Recently a new noninvasive marker—index of cardio‐electrophysiological balance (iCEB) between the depolarization and repolarization of the action potential—was introduced as a potential risk predictor of drug induced arrhythmia in rabbit left ventricular wedge preparations.2 The rationale for this parameter is that iCEB, measured as QT interval divided by QRS duration, might serve as an ECG‐based derivative of cardiac wavelength λ, which plays an important role in arrhythmogenesis: drugs that increase wavelength tend to increase the risk for TdP while agents that decrease the wavelength tend to increase the risk for non‐TdP VT or VF.3, 4, 5 Cardiac wavelength λ is the distance travelled by the depolarization wave during the functional refractory period. A local estimate of λ is determined by the product of conduction velocity (CV) and effective refractory period (ERP).6 QRS duration in absence of a typical bundle branch block is inversely proportional to CV within the cardiac ventricle. Conflicting data exist on the association of QT interval and ERP, requiring re‐evaluation of its correlation.7, 8, 9 Nevertheless, from a theoretical point of view, we would expect a correlation between action potential duration (at the cellular level), ERP (at the level of the whole tissue) and QT interval (at the level of the surface ECG). Therefore we hypothesize that QT/QRS is an easy to measure ECG surrogate for cardiac wavelength (λ = CV × ERP or QT/QRS) and thus iCEB reflects the balance between cardiac depolarization and repolarization (Fig. 1).
Figure 1.
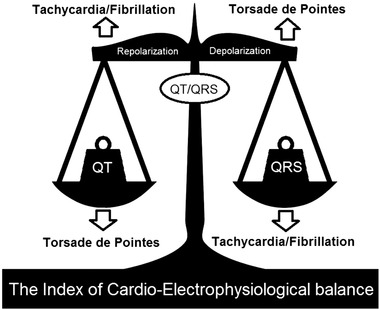
Schematic overview of iCEB. Balance and imbalance of the depolarization (QRS duration) and repolarization (QT interval) of cardiac electrophysiology. Schematic changes in the index of cardio‐electrophysiological balance (iCEB): significant increase/decrease (↑ or ↓) in iCEB by increase/decrease in QT interval or decrease/increase in QRS duration could potentially be proarrhythmic for TdP‐ and non‐TdP mediated VT/VF respectively (imbalance of cardiac electrophysiology). TdP = torsades de pointes; VT = ventricular tachycardia; VF = ventricular fibrillation.
It was already shown in isolated rabbit left ventricle wedge preparations that iCEB, like λ, is increased after administration of drugs that predispose to TdP and that both iCEB and λ were decreased after administration of drugs that increase the risk for non‐TdP VT/VF.2 As a follow‐up investigation, we evaluated the value of this potential new biomarker in the clinical setting. We first wanted to try and demonstrate the correlation between uncorrected QT interval and ERP measured invasively during an electrophysiological study (EPS). Subsequently, we wanted to see if iCEB was altered in opposite directions in patients after administration of a drug that predisposes to TdP (sotalol) or to non‐TdP mediated VT/VF (flecainide).10, 11, 12 Finally, we wanted to assess the value of this new biomarker in hereditary heart disease, including congenital long QT syndrome (LQTS), which predisposes to TdP, and Brugada syndrome (BrS), which predisposes to non‐TdP mediated VT/VF.
METHODS
Study Population
In this retrospective single center study, we tested our hypothesis in three different populations. Overall patients with a clear bundle branch block were excluded from analysis. Our study complied with the Declaration of Helsinki, and the research protocol was approved by the locally appointed ethics committee.
First we evaluated whether QT interval measured from the surface ECG and ERP measured during an electrophysiological study (EPS) are correlated. Therefore we analyzed the EPS database of the university hospitals Leuven to identify Brugada syndrome patients, according to the diagnostic criteria stated by the recent expert consensus document endorsed by the Heart Rhythm Society, European Heart Rhythm Association and the Asia Pacific Heart Rhythm Society, who underwent an EPS between November 2009 and May 2014.13 We also included a cohort who were referred for unexplained syncope or palpitations and were not diagnosed with overt underlying cardiomyopathy, primary arrhythmic heart disease or other diagnosis prior to EPS.
For our second goal we selected patients with atrial arrhythmias followed at our arrhythmia outpatient clinic who were started on either Sotalol or Flecainide. We analyzed available ECG's of patients on and off drug treatment in order to evaluate their effect on iCEB values.
The third patient population consisted of carriers of a likely or confirmed pathogenic mutation in one of the susceptibility genes for LQTS or BrS, identified at the center for hereditary heart disease of the university hospitals Leuven between March 2003 and March 2014. We considered patients carrying a (putative) pathogenic mutation as having the disease, whether or not they were phenotypically affected. Children younger than 8 years old were excluded because of pediatric ECG variations. As controls we included genotype negative family members of genotype positive probands who were screened for LQTS or BrS. Patients were classified as symptomatic if they experienced abrupt (likely arrhythmic) syncope, VT, VF or aborted sudden death. Patients in the BrS group with atrial arrhythmias, severe AV conduction impairment or sick sinus syndrome as expression of their SCN5A disease were considered asymptomatic. Brugada syndrome patients with inducible VT during EPS without clinical events were not considered as being symptomatic.
ECG Measurements
Twelve‐lead ECG recordings were analyzed by MUSE software (GE healthcare). Automated measurements of QRS duration, QT interval and heart rate were performed. Manual measurements of the QT interval, measured as the intersection of a tangent to the steepest slope of the last limb of the T wave and the baseline, were subsequently performed with high resolution calipers within the MUSE software program. Signal averaged beats of 10 seconds of ECG of the precordial and peripheral leads were superimposed to facilitate interval delineation. The measurements were performed on lead II and lead V5 and then the longest QT interval was selected for analysis. QT interval was corrected using both the Bazett (QTc = QT/(RR1/2)) and Fridericia (QTc = QT/(RR1/3)) formulae.
Invasive ERP Measurements
During a ventricular stimulation protocol the right ventricular apex or outflow tract were stimulated eight times at a constant cycle length (stimulation train) followed by a premature beat (S1 is basic stimulus, S2 is first premature stimulus). The first S2 was given at a coupling interval of 400 ms and was shortened with 10 ms per step. The ERP is defined as the longest premature coupling interval S1–S2 that fails to produce a propagated ventricular response. We evaluated the ERP at a cycle length of 600 ms (100 BPM) stimulated at the right ventricular apex. QT interval, RR interval and QRS duration were manually measured at the start of the electrophysiological study (EPS) to allow correlation of QT and ERP measured closely together. All measurements were done with Labsystem Pro Recording System (Bard Electrophysiology System).
Statistical Analysis
Data were analyzed within Microsoft Excel and Graphpad Prism software programs. The artwork was created with Graphpad prism. All continuous variables are expressed as mean ± standard deviation and as number (percentage) for categorized variables. The association of ERP and QT was assessed using a Pearson correlation. Univariate comparisons were performed using the two‐sided t‐test, one way ANOVA or chi‐square test, where appropriate. The effect of sotalol and flecainide was evaluated by a paired t‐test. Normality testing was done with d'Agostino's K‐squared test. P values below 0.05 were considered statistically significant.
RESULTS
ERP‐QT Correlation
We included 40 patients, 20 with BrS and 20 others, to evaluate the correlation of ERP and QT. Final diagnosis in the 20 cases of unexplained syncope or palpitations (“other” group mentioned above) was sinus tachycardia in one, atrial fibrillation in four, paroxysmal AV block in one, AVNRT in two, RVOT VT in three and vasovagal syncope in one. Definite diagnosis remained elusive in eight patients. Both groups consisted of 75% males, but the BrS group were significantly older compared to the “other” group (45 ± 13 versus 34 ± 15; P = 0.016).
Results of the ECG and EPS measurements are summarized in Table 1. ERP and QT measured during EPS were significantly correlated (Fig. 2). This correlation was more pronounced for uncorrected QT interval compared to rate corrected QT interval with Bazett's formula (R 2 0.25 vs. 0.12, respectively) and for QT measured during EPS compared to measurements on standard ECG a couple of hours before EPS (R 2 0.25 vs. 0.12, respectively). Rate uncorrected QT/QRS was highly correlated with ERP/QRS (R2 = 0.8; P < 0.0001), as well as with rate corrected QTc/QRS (R2 = 0.77; P < 0.0001). There was no difference in ERP between BrS patients and the control group (222 ms ± 18 vs. 227 ms ± 17; P = 0.37). These findings support the use of uncorrected QT interval as a surrogate for ERP. Consequently iCEB defined as QT interval divided by QRS duration can be used as the best available ECG based surrogate of cardiac wavelength λ.
Table 1.
Results of Baseline ECG and Invasive ERP Measurements during EPS in the Combined BrS and “Others” Cohort
| Value | |
|---|---|
| N | 40 |
| Age | 39 ± 15 |
| RR (ms) | 955 ± 197 |
| QRS (ms) | 103 ± 20 |
| QT (ms) | 376 ± 36 |
| QTcB (ms) | 388 ± 33 |
| iCEB (QT/QRS) | 3.76 ± 0.65 |
| iCEBc (QTcB/QRS) | 3.9 ± 0.75 |
| QT/ERP | 1.68 ± 0.14 |
| QTc/ERP | 1.74 ± 0.16 |
Data are represented as mean values ± SD. ERP = effective refractory period; EPS = electrophysiological study; N = number; Auto = automated measurement; c = rate corrected value; B = corrected with Bazett's formula; iCEB = index of cardio‐electrophysiological balance.
Figure 2.
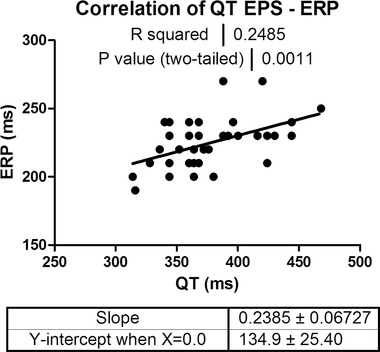
Correlation between ERP and QT. Pearson correlation of invasively measured ERP during EPS and QT measured at the beginning of EPS (N = 40): data indicating that there is a moderate (R2 = 0.25) but highly significant correlation between ERP and QT‐interval (P = 0.001). ERP = effective refractory period; EPS = electrophysiological study.
Effect of Sotalol and Flecainide on iCEB (Table 2, Fig. 3)
Table 2.
Clinical Characteristics in the Sotalol/Flecainide Group (upper part) and Effects of Sotalol and Flecainide (lower part)
| Sotalol | Flecainide | |
|---|---|---|
| N | 20 | 20 |
| Age | 59 ± 9 | 50 ± 11 |
| Males | 11 (55%) | 16 (80%) |
| Mean daily dose (mg) | 160 ± 45 | 158 ± 61 |
| Mean Δ | P Value | Mean Δ | P Value | |
|---|---|---|---|---|
| RR (ms) | +38 ± 48 | 0.25 | +34 ± 53 | 0.19 |
| QRS (ms) | +2.1 ± 4.9 | 0.12 | +10 ± 4.2 | <0.0001 |
| QT auto (ms) | +29 ± 11 | 0.0005 | +22 ± 12 | 0.006 |
| QTcB auto (ms) | +20 ± 7.2 | 0.0005 | +15 ± 6.8 | 0.004 |
| JT auto (ms) | +27 ± 10 | 0.0007 | +12 ± 12 | 0.09 |
| iCEB | +0.23 ± 0.23 | 0.01 | −0.2 ± 0.19 | 0.03 |
| iCEBc (QTcB/QRS) | + 0.15 ± 0.26 | 0.08 | −0.28 ± 0.22 | 0.01 |
| JTcB/QRS | +0.18 ± 0.25 | 0.03 | −0.26 ± 0.21 | 0.01 |
Data are represented as mean values ± SD for continuous variables and as number (percentage) for categorized variables. Auto = automated measurement; B = corrected with Bazett's formula; c = rate corrected value; iCEB = index of cardio‐electrophysiological balance.
Figure 3.
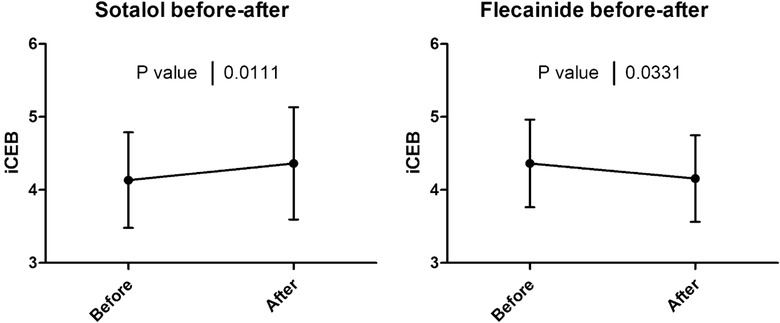
Effect of sotalol and flecainide on iCEB. Effect of sotalol (left) and flecainide (right) on index of cardio‐electrophysiological balance (iCEB) in patients with paroxysmal supraventricular arrhythmias: data indicating that iCEB was significantly increased after administration of sotalol (mean daily dose 160 mg; N = 20; P = 0.01) and decreased after administration of flecainide (mean daily dose 158 mg; N = 20; P = 0.03).
We included 20 patients started on sotalol and 20 patients started on flecainide. Demographic data are summarized in Table 2. Indication for flecainide administration was atrial fibrillation in 12, AVNRT in seven and atrial flutter in 1 while indication for sotalol administration was atrial fibrillation in 19 and atrial flutter in one. After administration of sotalol, iCEB significantly increased (mean Δ +0.23, P = 0.01) while it significantly decreased after administration of flecainide (mean Δ –0.21, P = 0.03).
LQTS‐BrS Group (Tables 3, 4 and Figs. 4 and 5)
Table 3.
Clinical Characteristics of Genotype Negative Controls and Genotype Positive LQTS and BrS Patients
| LQTS | BrS | ||||
|---|---|---|---|---|---|
| Controls | Value | P Value | Value | P Value | |
| N | 65 | 70 | 57 | ||
| Mean age | 38.3 ± 16 | 33.1 ± 16 | 0.06 | 36.5 ± 17 | 0.53 |
| Males | 33 (51%) | 37 (53%) | 0.81 | 26 (46%) | 0.15 |
| Beta‐blocker therapy | 10 (15%) | 27 (39%) | 0.025 | 9 (16%) | 0.70 |
| Symptomatic | 0 (0%) | 15 (21%) | 10 (18%) | ||
Data are represented as mean values ± SD for continuous variables and as number (percentage) for categorized variables.
Table 4.
ECG Results LQTS and BrS Group
| LQTS | BrS | ||||
|---|---|---|---|---|---|
| Controls | Mean | P Value | Mean | P Value | |
| RR (ms) | 900 ± 153 | 928 ± 165 | 0.31 | 980 ± 148 | 0.15 |
| QRS (ms) | 93 ± 10 | 87 ± 11 | 0.0004 | 117 ± 18 | <0.0001 |
| QT auto (ms) | 392 ± 30 | 448 ± 56 | <0.0001 | 407 ± 30 | 0.009 |
| iCEB (QT/QRS) | 4.24 ± 0.5 | 5.22 ± 0.93 | <0.0001 | 3.52 ± 0.43 | <0.0001 |
| QTcB auto (ms) | 416 ± 23 | 467 ± 45 | <0.0001 | 413 ± 33 | 0.59 |
| iCEBc (QTcB/QRS) | 4.51 ± 0.57 | 5.45 ± 0.86 | <0.0001 | 3.58 ± 0.49 | <0.0001 |
| JT auto (ms) | 299 ± 30 | 361 ± 57 | <0.0001 | 289 ± 23 | 0.051 |
| JTcB auto (ms) | 317 ± 23 | 376 ± 46 | <0.0001 | 294 ± 24 | <0.0001 |
| JTcB/QRS | 3.44 ± 0.53 | 4.4 ± 0.86 | <0.0001 | 2.56 ± 0.47 | <0.0001 |
| QTcB man (ms) | 402 ± 27 | 468 ± 51 | <0.0001 | 398 ± 40 | 0.61 |
| QTcF man (ms) | 393 ± 23 | 461 ± 53 | <0.0001 | 396 ± 37 | 0.62 |
Data are represented as mean values ± SD. Auto = automated measurement; B = corrected with Bazett's formula; c = rate corrected value; F = corrected with Fridericia's formula; iCEB = index of cardio‐electrophysiological balance; man = manual measurement
Figure 4.
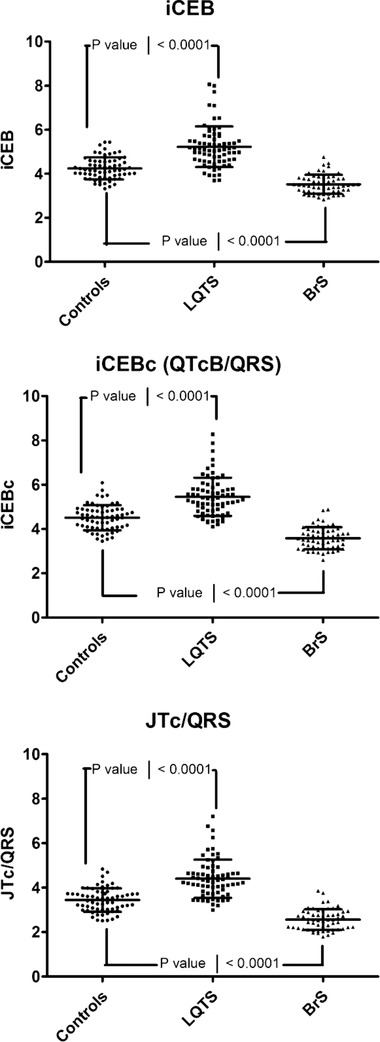
iCEB in long QT syndrome and Brugada syndrome. Index of cardio‐electrophysiological balance (iCEB; upper panel) and its rate‐corrected values (iCEBc (middle panel) and JTc/QRS (bottom panel)) in carriers of (putative) pathogenic mutations in patients with the congenital long QT syndrome (LQTS) and Brugada syndrome (BrS): Data indicating that iCEB or heart‐rate corrected iCEB (iCEBc or JTc/QRS with Bazett's correction) is significantly increased in LQTS (N = 70; all P < 0.0001) and significantly reduced in BrS (N = 57; all P < 0.0001) versus genotype negative family members (N = 65).
Figure 5.
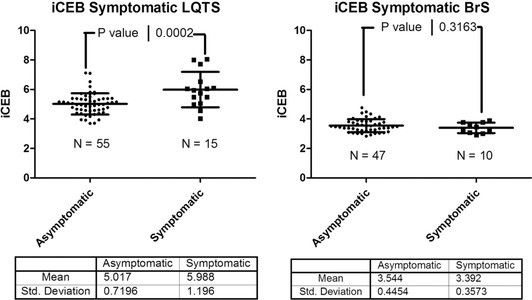
iCEB as risk stratifier in long QT syndrome and Brugada syndrome. Index of cardio‐electrophysiological balance (iCEB) in symptomatic and asymptomatic carriers of (putative) pathogenic long QT syndrome (LQTS) mutations (left panel) and in symptomatic and asymptomatic carriers of (putative) pathogenic Brugada syndrome (BrS) mutations (right panel). Data indicating that there is a significant difference between the symptomatic (N = 15) and asymptomatic LQTS patients (N = 55; P = 0.0002), but no significant difference between the symptomatic (N = 10) and asymptomatic (N = 47; P = 0.32) BrS patients.
The total population in this cohort consisted of 192 patients; 70 genotype positive LQTS patients (21 patients with LQT1, 47 with LQT2 and 2 with LQT3), 57 genotype positive BrS patients (all with mutations in SCN5A), and 65 genotype negative family members. Clinical and demographic characteristics are summarized in Table 3. 27 patients (47%) fulfilled the clinical criteria for Brugada syndrome as defined by the recent expert consensus document.13
Results of the ECG measurements are summarized in Table 4. iCEB is significantly altered in the opposite direction in LQTS and BrS patients, regardless of use of QT correction or JT instead of QT interval. In LQTS, the increase in iCEB is mainly attributed to the increase in QT interval, although QRS duration is also shortened accentuating the effect on iCEB. However, the decrease of 6 ± 2 ms in QRS duration is probably not clinically significant. On the contrary, although there was a modest prolongation of the QT interval in BrS patients, the significant decrease in iCEB is mainly driven by prolongation of the QRS interval. The prolongation of the QT interval was due to both QRS widening (JT interval was unchanged with even a trend towards shorter JT) and the decrease in heart rate (QTc was unchanged). In LQTS there was a trend towards higher values of iCEB in beta blocker treated patients (5.44 vs. 5.1; P = 0.13) due to a slight decrease in QRS duration and increase in QT interval. This probably reflects treatment with a beta blocker in higher risk patients with a longer QTc interval.
The 15 symptomatic LQTS patients (5 LQT1 and 10 LQT2) had a significantly prolonged QTc interval, independent of measurement and correction method (automatically measured QT corrected with Bazett's formula 509 ± 60 ms vs. 456 ± 30 ms, P < 0.0001), and increased iCEB (5.99 ± 1.2 vs. 5.02 ± 0.72, P = 00002), compared to asymptomatic genetically positive LQTS patients (Fig. 5). In BrS patients no significant results were obtained if symptomatic and asymptomatic patients were compared, probably due to the small sample size (only 10 symptomatic patients). Furthermore iCEB in patients with a spontaneous or drug induced Brugada type 1 ECG did not differ from SCN5A mutation carriers not fulfilling BrS diagnostic criteria (3.48 ± 0.45 vs. 3.55 ± 0.42; P = 0.51). Analysis of LQTS patients according to genotype (LQT1 versus LQT2) did not show any significant results.
Normal Values of iCEB According to Age and Gender
One of the main assumptions in the concept of iCEB is the existence of a certain optimal “normal” value for this parameter. The control group in the cohort of hereditary heart disease patients consisted of 65 genotype negative family members. In this group iCEB was normally distributed with a mean of 4.24 and standard deviation of 0.5, thus the reference range for this population sample was 3.24–5.24. The sotalol/flecainide group contained 40 patients with atrial arrhythmias without evidence for other heart disease and thus presumably having no major increased risk for ventricular arrhythmias. Their mean combined iCEB value pretreatment was 4.25 ± 0.63 and thus a reference range of 2.99–5.51. There was no significant difference in iCEB between these two control groups (P = 0.94). As such, these findings in two independent populations indeed suggest an optimal value for this parameter. Combining these two control populations resulted in a normally distributed spread with normal value of 4.24 and reference range of 3.14–5.35 (Fig. 6). Influences of sex and age on iCEB are shown in Figure 7. The higher iCEB values found in females were due to both higher QT intervals, probably related to the effect of sex hormones, and reduced QRS duration, most likely associated with smaller hearts in females.
Figure 6.
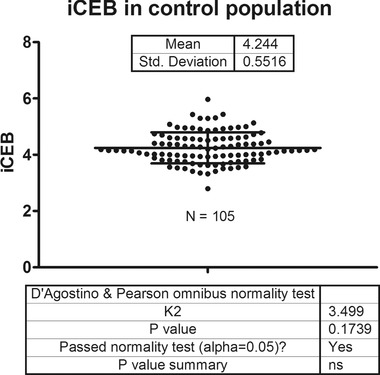
iCEB in controls. Index of cardio‐electrophysiological balance in a control population consisting of 65 genotype negative family members of long QT syndrome and Brugada syndrome probands and 40 patients with atrial arrhythmias prior to start of either flecainide or sotalol. Data demonstrating that iCEB is normally distributed in this control population with a reference range of 3.14–5.35.
Figure 7.
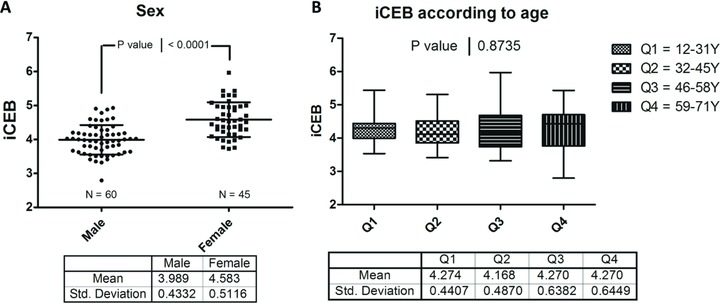
iCEB according to gender and age. (A) Index of cardio‐electrophysiological balance (iCEB) according to sex. Females have a significantly increased value of iCEB compared to males (P < 0.0001). (B) iCEB according to different age quartiles. Data demonstrating age has no major influence on iCEB. Bonferroni's posttest indicated that no single age group significantly differed from another age group.
DISCUSSION
We believe we are the first to present clinical data on a potential new noninvasive risk marker for ventricular arrhythmias called the index of cardio‐electrophysiological balance (iCEB). iCEB is measured as the QT interval divided by the QRS duration on the surface ECG. First, we demonstrated the correlation between the ERP measured during EPS and the uncorrected QT interval, thus supporting the concept of this new marker as an ECG surrogate for cardiac wavelength. We then showed that this biomarker was increased by a drug that predisposes towards TdP (sotalol) and was also elevated in LQTS mutation carriers. In contrast, iCEB decreased following administration of flecainide, a drug associated with an increased risk for non‐TdP mediated VT/VF, and was lower in patients carrying a putative pathogenic BrS mutation, a hereditary arrhythmia syndrome associated with sudden cardiac death due to non‐TdP mediated VT/VF.
Only limited in vitro data are available on cardiac wavelength as a risk stratifier, mainly due to the invasive nature to measure it.3, 4, 5 To address these limitations we hypothesized that QT/QRS might serve as a readily measurable local estimate of cardiac wavelength and called this parameter the “index of cardio‐electrophysiological balance.” It is generally accepted that QRS duration in the absence of a clear bundle branch block is inversely proportional to conduction velocity in the cardiac ventricle.6 Data on the relationship between QT interval and ERP date back to the 1970s. Guss and colleagues observed similar effects of QT and ERP on increased right ventricular pacing rates during EPS, however a formal association test was not performed.7 Similar results were obtained by Olsson et al. who showed in 14 humans what they called “a certain but poor relationship” by plotting QTc versus ERP, yet a formal association test was not performed.8 However, more recently Voss et al. could not demonstrate a statistically significant correlation between ERP and uncorrected or rate corrected QT interval in 19 healthy dogs.9 We evaluated the relationship between QT and ERP in a far bigger cohort (N = 40) compared to these previous studies. The study size might be one of the reasons why we did find a significant, although modest, correlation. Our findings demonstate the potential utility of QT/QRS as an ECG based derivative of cardiac wavelength.
Drug‐induced arrhythmia has been the main concern in drug development within the pharmaceutical industry over the last 20 years. Current guidelines recommend a thorough QT clinical study to evaluate the cardiac risk profile of new drugs. However, there is some concern regarding the use of QT interval as the sole risk marker for drug‐induced arrhythmias.14 It has been shown that not all drugs that prolong the QT interval are proarrhythmic, and absence of QT prolongation is no guarantee for lack of proarrhythmia.15 Therefore a search is ongoing for better or complementary risk markers. Recently iCEB was proposed as a new and noninvasive biomarker to predict the risk for both TdP and non‐TdP VT/VF.2 It was suggested that an optimal balance between depolarization (QRS duration) and repolarization (QT interval) is crucial to preserve the electrical stability of the ventricles: deviating too much from this delicate balance may indeed be proarrhythmic (Fig. 1). Administration of certain drugs (e.g., sotalol and flecainide) and harboring a (putative) pathogenic mutation in one of the LQTS or BrS susceptibility genes are recognized situations that increase the risk for either TdP or non‐TdP mediated VT/VF, respectively. iCEB, which is altered in opposite directions in these situations (sotalol and LQTS increase iCEB and flecainide and BrS decrease iCEB) seems to support the hypothesis of a delicate balance between depolarization and repolarization. Patients with LQTS appeared to have significantly elevated values of iCEB compared to control subjects, and even higher values in symptomatic patients, further suggesting that increased iCEB might indicate enhanced risk for TdP. Indeed iCEB is significantly higher in LQTS patients, independent of genotype, contrasting with other proposed risk markers like Te‐Tp that is only increased in LQT2.16 In contrast in BrS patients the iCEB value is significantly lower than in controls. Our BrS population was too small for a valid investigation of iCEB as risk marker for arrhythmias.
The question remains, however, why increased iCEB (or λ) preferentially could lead to TdP, as evident in LQTS and sotalol treated patients, and decreased iCEB (or λ) preferentially could lead to ventricular fibrillation, as observed in BrS and flecainide treated patients. A possible explanation might be the underlying cellular effects of these drugs and the underlying genetic cause of the specific hereditary heart disease. Sotalol is a drug with the combined effect of a beta‐blocker and a class III antiarrhythmic agent. The class III properties are due to blocking of the rapid component of the delayed rectifier potassium current (IKr) and subsequent prolongation of phase 3 of the action potential and ERP.17 The most common forms of congenital LQTS are either due to loss of function of the slow (LQT1; KCNQ1 gene; IKs) or rapid (LQT2; KCNH2 gene; IKr) component of the delayed rectifier potassium current or gain of function of the cardiac sodium channel encoded by the SCN5A gene (LQT3; SCN5A gene; INa). The underlying common mechanism of action potential duration lengthening might be resembled by an increase in iCEB. On the other hand flecainide is well known for its “bad” sodium channel blocking properties.18 The BrS group in this study consisted of patients with (putative) pathogenic mutations in SCN5A causing a loss of function of the cardiac sodium channel. So both treatment with flecainide and BrS, caused by SCN5A mutations, result in a reduced cardiac sodium channel function, reduced sodium current and thus a reduced upstroke velocity of phase 0 of the action potential.6 This is observed as an increase in QRS duration on the surface ECG recordings. This effect on the cardiac sodium channel and action potential most likely is the common mechanism for reduction in iCEB.
Limitations
The QT interval was confirmed as a noninvasive measure of ERP, where measurement of the QT interval was conducted at the beginning of the EPS procedure. One could argue that the QT measurement should have been done during the stimulation train, but since QT hysteresis19 (adaptation of QT interval to sudden change in heart rate) in men takes about 2 minutes we decided to measure QT interval at the beginning of the EPS in resting conditions with a stable isoelectric line facilitating measurement of the end of the T wave.
We evaluated iCEB in relation to LQTS or BrS genotype. Since LQTS and BrS also exhibit the phenomena of reduced penetrance and variable expression typical for monogenic diseases, one might state that the assumption that positive genotype is equal to increased arrhythmia risk is not entirely correct. However carriers of a pathogenic mutation without clear expression of the disease seem at increased risk of events.20
If multiple testing is taken into account in both the LQTS/BrS and flecainide/sotalol cohort, a Bonferroni correction would only classify P values below 0.003 as statistically significant (0.05/16 tests). Our observations in the LQTS/BrS cohort tolerate this stringent correction method, however the changes we detected in iCEB in the flecainide/sotalol group would no longer be significant. Since our work is mainly hypothesis generating, we felt that a very stringent correction for multiple testing was not indicated.
Currently, iCEB defined as QT/QRS is not a rate independent factor. However, some QRS rate dependence (QRS shortening at higher heart rates) is also present in healthy individuals.21 This effect partially eliminates the effect of heart rate changes on iCEB. Furthermore, the rate dependent effects of Class I antiarrhythmic drugs are well known.18 This is evidenced by the widening of the QRS‐duration in a rate‐dependent manner. Moreover, QT rate dependence is highly individual in general and it is especially disturbed in LQTS and BrS and therefore a general heart rate correction formula like Bazett's formula is less reliable in these patient populations.22, 23, 24 In our cohort, heart rate was comparable in the hereditary heart disease group and also in the patients treated with sotalol or flecaïnide. However, individual risk stratification based on this parameter might necessitate the use of a rate corrected iCEB. For example, an individual with a QT of 420 ms at a heart rate of 100 BPM and a QRS of 100 ms has a normal rate uncorrected iCEB value of 4.2, but a highly abnormal rate corrected iCEB of 5.42. Therefore the rate uncorrected iCEB will probably only be useful in a specific heart rate range. Future follow‐up studies will also address this issue.
Finally, iCEB was not evaluated just prior to onset of actual arrhythmic events. Instead we used a surrogate for increased arrhythmia susceptibility, specifically administration of two pro‐arrhythmic drugs and harboring mutations that predispose to two pro‐arrhythmic genetic diseases.
CONCLUSION
In conclusion, we propose iCEB as the best practical ECG surrogate for λ and report here, in this preliminary study, data of this parameter for the first time in man. Increased potential risk for TdP as observed with use of sotalol and in congenital LQTS is associated with an increase in iCEB. Increased potential risk for non TdP mediated VT/VF as evident with use of flecainide and in BrS is reflected by decreased iCEB. As such, the main potential benefit of iCEB is the detection of both increased risk to TdP and non‐TdP mediated VT/VF and therefore iCEB might be a universal marker for ventricular arrhythmias. Our findings need to be confirmed in future prospective and adequately powered studies.
Conflicts of interest: Dr. Lu and Dr. Gallacher are employees of Janssen Pharmaceutica NV. There are no further conflicts of interest.
Financial support: This study was funded by the O&O programme of the IWT (Agency for Innovation through Science and Technology ‐ Flanders).
REFERENCES
- 1. Postema PG, Wilde AA. The measurement of the QT interval. Curr Cardiol Rev 2014;10:287–294. [DOI] [PMC free article] [PubMed] [Google Scholar]
- 2. Lu HR, Yan GX, Gallacher DJ. A new biomarker–index of cardiac electrophysiological balance (iCEB)–plays an important role in drug‐induced cardiac arrhythmias: Beyond QT‐prolongation and torsades de pointes (TdPs). J Pharmacol Toxicol Methods 2013;68:250–259. [DOI] [PubMed] [Google Scholar]
- 3. Robert E, Aya AG, de la Coussaye JE, et al. Dispersion‐based reentry: Mechanism of initiation of ventricular tachycardia in isolated rabbit hearts. Am J Physiol 1999;276:H413–H423. [DOI] [PubMed] [Google Scholar]
- 4. Aidonidis I, Poyatzi A, Stamatiou G, et al. Dose‐related shortening of ventricular tachycardia cycle length after administration of the Katp channel opener bimakalim in a 4‐day‐old chronic infarct anesthetized pig model. J Cardiovasc Pharmacol Ther 2009;14:222–230. [DOI] [PubMed] [Google Scholar]
- 5. Lu HR, Hermans AN, Gallacher DJ. Does terfenadine‐induced ventricular tachycardia/fibrillation directly relate to its QT prolongation and torsades de pointes? Br J Pharmacol 2012;166:1490–1502. [DOI] [PMC free article] [PubMed] [Google Scholar]
- 6. King JH, Huang CL, Fraser JA. Determinants of myocardial conduction velocity: Implications for arrhythmogenesis. Front Physiol 2013;4:154. [DOI] [PMC free article] [PubMed] [Google Scholar]
- 7. Guss SB, Kastor JA, Josephson ME, et al. Human ventricular refractoriness. Effects of cycle length, pacing site and atropine. Circulation 1976;53:450–455. [DOI] [PubMed] [Google Scholar]
- 8. Olsson B, Brorson L, Harper R, et al. Estimation of ventricular refractoriness in man by the extra stimulus method. Cardiovasc Res 1977;11:31–38. [DOI] [PubMed] [Google Scholar]
- 9. Voss F, Becker R, Bauer A, et al. Are QT measurements on body surface ecg indicative of ventricular refractory patterns? Basic Res Cardiol 2005;100:22–27. [DOI] [PubMed] [Google Scholar]
- 10. Roden DM. Drug‐induced prolongation of the QT interval. N Engl J Med 2004;350:1013–1022. [DOI] [PubMed] [Google Scholar]
- 11. Osadchii OE. Flecainide‐induced proarrhythmia is attributed to abnormal changes in repolarization and refractoriness in perfused guinea‐pig heart. J Cardiovasc Pharmacol 2012;60:456–466. [DOI] [PubMed] [Google Scholar]
- 12. Osadchii OE. Effects of Na+ channel blockers on extrasystolic stimulation‐evoked changes in ventricular conduction and repolarization. J Cardiovasc Pharmacol 2014;63:240–251. [DOI] [PubMed] [Google Scholar]
- 13. Priori SG, Wilde AA, Horie M, et al. Executive summary: HRS/EHRA/APHRS expert consensus statement on the diagnosis and management of patients with inherited primary arrhythmia syndromes. Europace 2013;15:1389–1406. [DOI] [PubMed] [Google Scholar]
- 14. Shah RR, Morganroth J, Kleiman RB. Ich e14 q&a(r2) document: Commentary on the further updated recommendations on thorough QT studies. Br J Clin Pharmacol 2015;79:456–464. [DOI] [PMC free article] [PubMed] [Google Scholar]
- 15. Laverty H, Benson C, Cartwright E, et al. How can we improve our understanding of cardiovascular safety liabilities to develop safer medicines? Br J Pharmacol 2011;163:675–693. [DOI] [PMC free article] [PubMed] [Google Scholar]
- 16. Kanters JK, Haarmark C, Vedel‐Larsen E, et al. T(peak)T(end) interval in long QT syndrome. J Electrocardiol 2008;41:603–608. [DOI] [PubMed] [Google Scholar]
- 17. Anderson JL, Prystowsky EN. Sotalol: An important new antiarrhythmic. Am Heart J 1999;137:388–409. [DOI] [PubMed] [Google Scholar]
- 18. Lu HR, Rohrbacher J, Vlaminckx E, et al. Predicting drug‐induced slowing of conduction and pro‐arrhythmia: Identifying the ‘bad’ sodium current blockers. Br J Pharmacol 2010;160:60–76. [DOI] [PMC free article] [PubMed] [Google Scholar]
- 19. Malik M. QT/RR hysteresis. J Electrocardiol 2014;47:236–239. [DOI] [PubMed] [Google Scholar]
- 20. Horr S, Goldenberg I, Moss AJ, et al. Ion channel mechanisms related to sudden cardiac death in phenotype‐negative long‐QT syndrome genotype‐phenotype correlations of the KCNQ1(s349w) mutation. J Cardiovasc Electrophysiol 2011;22:193–200. [DOI] [PMC free article] [PubMed] [Google Scholar]
- 21. Chiladakis J, Kalogeropoulos A, Zagkli F, et al. Effect of heart rate on the intrinsic and the ventricular‐paced QRS duration. J Electrocardiol 2015. [DOI] [PubMed] [Google Scholar]
- 22. Nemec J, Buncová M, Bůlková V, et al. Heart rate dependence of the QT interval duration: Differences among congenital long QT syndrome subtypes. J Cardiovasc Electrophysiol 2004;15:550–556. [DOI] [PubMed] [Google Scholar]
- 23. Sangawa M, Morita H, Nakatsu T, et al. Abnormal transmural repolarization process in patients with Brugada syndrome. Heart Rhythm 2009;6:1163–1169. [DOI] [PubMed] [Google Scholar]
- 24. Malik M, Färbom P, Batchvarov V, et al. Relation between QT and RR intervals is highly individual among healthy subjects: Implications for heart rate correction of the QT interval. Heart 2002;87:220–228. [DOI] [PMC free article] [PubMed] [Google Scholar]


