

Abstract
Background
The cardiac electrical biomarker (CEB) is a novel electrocardiographic (ECG) marker quantifying the dipolar activity of the heart with higher levels indicating myocardial injury.
Methods
We prospectively enrolled 1097 patients presenting with suspected non‐ST‐elevation myocardial infarction (NSTEMI) to the emergency department (ED). Digital 12‐lead ECGs were recorded at presentation and the CEB values were calculated in a blinded fashion. The final diagnosis was adjudicated by two independent cardiologists. The prognostic endpoint was all‐cause mortality during 2 years of follow‐up.
Results
NSTEMI was the final diagnosis in 14% of patients. CEB levels were higher in patients with NSTEMI compared to other causes of chest pain (median 44 (IQR 21–98) vs. 30 (IQR 16–61), p < .001). A weak but significant correlation between levels of high‐sensitivity cardiac troponin T (hs‐cTnT) at admission to the ED and the CEB was found (r = .23, p < .001). The use of the CEB in addition to conventional ECG criteria improved the diagnostic accuracy for the diagnosis of NSTEMI as quantified by the area under the receiver operating characteristics curve from 0.66 to 0.71 (p < .001) and the sensitivity improved from 43% to 79% (p < .001).
Conclusion
In conclusion, the CEB, an ECG marker of myocardial injury, significantly improves the accuracy and sensitivity of the ECG for the diagnosis of NSTEMI.
Keywords: clinical, electrocardiography; epidemiology/clinical trials; myocardial infarction; noninvasive techniques
1. INTRODUCTION
Acute myocardial infarction (AMI) is a major cause of death and disability worldwide. As highly effective treatments are available, early and accurate detection of AMI is crucial (Nawar, Niska, & Xu, 2007; Anderson et al., 2013; Hamm et al., 2011; Kontos, Diercks, & Kirk, 2010; Thygesen et al., 2012). Clinical assessment, the 12‐lead electrocardiography (ECG), and cardiac troponin (cTn) form the pillars for the early diagnosis of AMI. While major advances have been achieved by the development of high‐sensitive (hs‐)cTn assays (Thygesen et al., 2012; Safford et al., 2013; Reichlin et al., 2009; Keller et al., 2009, 2011; Reichlin et al., 2012; Reiter et al., 2011; Gimenez et al., 2014; Reichlin et al., 2011; Haaf et al., 2012), progress in the analysis and interpretation of the 12‐lead ECG has been very limited over the past decade.
Nevertheless, the 12‐lead ECG has unique logistic advantages as compared to high‐sensitive (hs)‐cTn testing. First, the ECG allows a rapid identification of patients presenting with ST‐segment elevation myocardial infarction (STEMI) that derive a survival benefit from immediate coronary revascularization (Steg et al., 2012). Second, the ECG can be performed immediately at presentation to the emergency department (ED), or even earlier in prehospital environment (Al‐Zaiti, Martin‐Gill, Sejdic, Alrawashdeh, & Callaway, 2015). Turnaround time for hs‐cTn is often more than 60 minutes. In addition, the release of cTn is a time‐dependent phenomenon. Accordingly, two measurements are necessary in the vast majority of patients even with hs‐cTn (Roffi et al., 2016). Third, the ECG is universally available, while hs‐cTn assays are still not available in many institutions worldwide. Accordingly, novel 12‐lead ECG markers indicative of non‐ST‐elevation myocardial infarction (NSTEMI) could have an enormous potential to impact on the early diagnosis of NSTEMI.
The cardiac electrical biomarker (CEB) has been investigated as a novel ECG marker quantifying the multipolar versus dipolar activity of the heart with higher levels possibly indicating acute myocardial ischemic injury (Schreck & Fishberg, 2014). Multipolar activity rises from myocardial ischemic injury altered polarization behavior of affected myocardial cells. Two pilot studies showed a high diagnostic accuracy of the CEB for the detection of AMI when compared to standard ST‐segment analysis (Schreck & Fishberg, 2014, 2015). A third study found an association between increased CEB values and increased high‐sensitive cardiac troponin I (hs‐cTnI) levels (Tereshchenko, Gatz, Feeny, & Korley, 2014).
The incremental diagnostic value of the CEB on top of standard ECG signals for the early diagnosis of NSTEMI is unknown. We therefore performed a large prospective diagnostic cohort study to examine the diagnostic value of the CEB, alone and in conjunction with conventional ECG criteria, in unselected patients presenting to the ED with symptoms suggestive of NSTEMI.
2. METHODS
2.1. Study design and population
Advantageous Predictors of Acute Coronary Syndrome Evaluation (APACE) is an ongoing prospective international multicenter study designed to advance the early diagnosis of AMI (ClinicalTrials.gov registry, number NCT00470587) (Reichlin et al., 2009, 2012, 2011; Boeddinghaus et al., 2016, 2017). Unselected patients presenting to the ED with symptoms suggestive of AMI (such as acute chest discomfort and angina pectoris) with an onset or peak within the last 12 hr and an age >18 were recruited. Patients with terminal kidney failure requiring dialysis were excluded. Further details regarding the study design can be found in the appendix.
For this analysis, only patients enrolled at the University Hospital Basel, Switzerland, were included. From April 2006 to May 2013, a total of 2121 unselected patients were enrolled. Patients without a digital 12‐lead ECG (n = 350) or with insufficient ECG quality (n = 538) were excluded, as were patients with a QRS duration >120 ms (n = 103) on the presenting ECG. Furthermore, patients presenting with STEMI (n = 33) were excluded, because no additional ECG markers are needed in those patients. Patients with ST‐elevations for other conditions such as for example, perimyocarditis however were included. This left 1097 patients eligible for this analysis (Figure S1).
The study was carried out according to the principles of the Declaration of Helsinki and approved by the local ethics committees. Written informed consent was obtained from all patients. The authors designed the study, gathered, and analyzed the data according to the STARD guidelines for studies of diagnostic accuracy (Bossuyt, 2003).
2.2. Adjudication of final diagnoses
Details on the adjudication of AMI have been published previously (Reichlin et al., 2009, 2012, 2011, 2009) and are given in Appendix S1. In brief, AMI was defined and hs‐cTn levels interpreted as recommended in current guidelines (Thygesen et al., 2012, 2012, 2007; Apple, Jesse, Newby, Wu, & Christenson, 2007). AMI was diagnosed when there was evidence of myocardial necrosis with a significant rise and/or fall of hs‐cTn levels in a clinical setting consistent with myocardial ischemia (Thygesen et al., 2012, 2007).
2.3. Recording of ECGs for assessment of the CEB
At presentation to the ED, a digital 10 seconds, 12‐lead resting ECG was recorded using the standard ECG machine (AT 110, Schiller AG, Baar, Switzerland). The sampling frequency was 500 Hz (signal bandwidth 0.05–150 Hz) and the resolution 1 μV/bit.
2.4. Manual analysis of standard 12‐lead ECGs
All 12‐lead resting ECGs were manually interpreted in the ECG core‐lab at the University Hospital Basel by internal‐medicine specialists blinded to the clinical and biochemical patient's details. ECG manifestations indicative of NSTEMI (ST‐depressions and T‐wave inversions) during manual interpretation were defined as recommended in current guidelines (Thygesen et al., 2012). Given that STEMI patients were excluded and the focus of the analysis was on the ECG detection of NSTEMI, we did not consider neither ST‐elevations due to other conditions (such as perimyocarditis) nor hyperacute T waves as an indicator of NSTEMI.
2.5. CEB computation
CEB values were calculated by the manufacturer (VectraCor®, Totowa, NJ, USA) in a blinded fashion as previously described in reference 19. In brief, acute ischemia alters the polarization behavior of myocardial cells leading to a potential gradient between ischemic regions and surrounding cells. Figure 1a shows normal ventricular depolarization behavior, where the body surface potential is approximated by a dipole potential (arrow, top). The time‐dependent potential differences projected onto the leads (arrow, bottom) result in an ECG curve. Figure 1b shows additionally an ischemic region. The change in surface potential is approximated by extra dipoles (three arrows). The overall surface potential is of multipolar nature. CEB reflects the multipolar versus dipolar activity of the heart. The CEB is displayed as a numerical index with higher values representing a larger overall contribution of multipolar activity in the cardiac electrical field and hence a higher probability of acute myocardial ischemic injury, including AMI. Other than performing the CEB analyses, VectraCor® had no role in the design of the study, the analysis of the data, the preparation of the manuscript, or the decision to submit the manuscript for publication.
Figure 1.
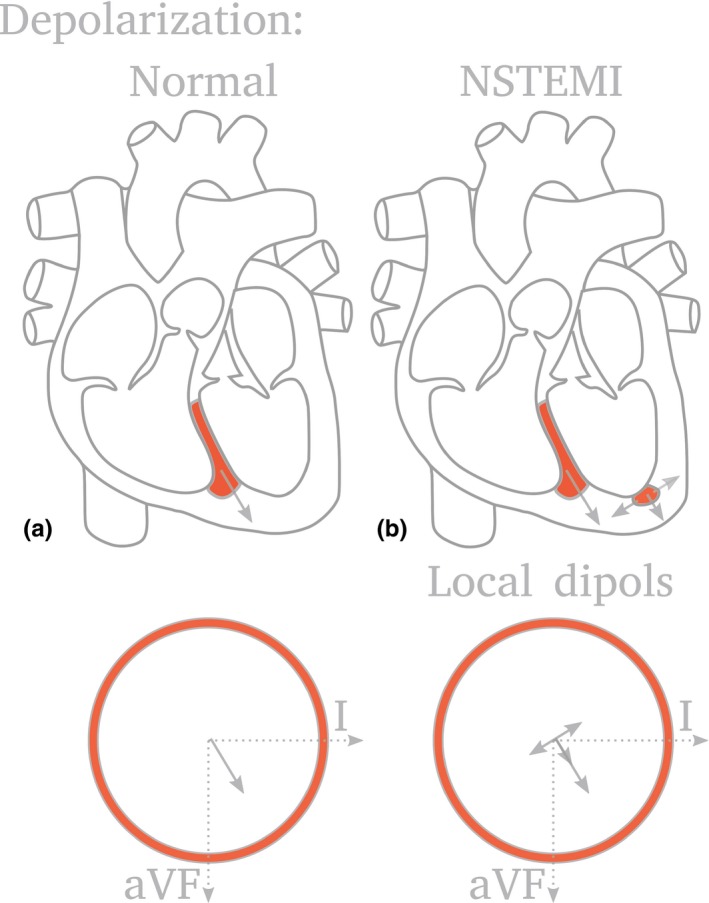
Cardiac electric biomarker (CEB) reflecting the multipolar versus dipolar activity of the heart. Acute ischemia alters the polarization behavior of myocardial cells leading to a potential gradient between ischemic regions and surrounding cells. (a) Normal ventricular depolarization behavior, where the body surface potential is approximated by a dipole potential (arrow, top). The time‐dependent potential differences projected onto the leads (arrow, bottom) result in an ECG curve. (b) Additionally an ischemic region. The change in surface potential is approximated by extra dipoles (three arrows). The overall surface potential is of multipolar nature
2.6. Blood sampling and laboratory methods
Blood samples for determination of hs‐cTnT (Elecsys 2010, Roche Diagnostics) and hs‐cTnI (Abbott Laboratories, IL) were collected in serum tubes at presentation to the ED. For the hs‐cTnT assays, the limit of blank and limit of detection were determined to be 3 and 5 ng/L, respectively. The 99th‐percentile of a healthy reference population was reported at 14 ng/L, with an imprecision corresponding to 10% CV at 13 ng/L (Giannitsis et al., 2010). The hs‐cTnI assay has a 99th percentile concentration of 26.2 ng/L with a corresponding coefficient of variation (CV) of <5% and a limit of detection (LoD) of 1.9 ng/L (Koerbin et al., 2012). The estimate of the glomerular filtration rate (GFR) was calculated with the chronic kidney disease epidemiology collaboration equation (CKD‐EPI) (Levey et al., 2009).
2.7. Follow‐up
After hospital discharge, patients were contacted after 3, 12, and 24 months by telephone calls or in written form. Information regarding death was furthermore obtained from the national registry on mortality, the hospital's diagnosis registry and the family physician's records.
2.8. Statistical analysis
Continuous variables are presented as mean (standard deviation) or median (interquartile range [IQR]); categorical variables as numbers and percentages. Differences in baseline characteristics between patients with and without NSTEMI were assessed using the Mann–Whitney U test for continuous variables and the Pearson chi‐square test for categorical variables. Correlations among continuous variables were assessed with the use of the Spearman rank‐correlation coefficient and for correlations including a binary variable the Kendall correlation rank was computed. The Fisher Z transformation and Fisher Z test were used for the comparison of correlations in independent groups. From the individual ECG changes a score was calculated, assigning 5 points for ST‐depression and 2 points for T‐wave inversion, to quantify conventional ECG changes (Abächerli et al., 2017). This score accounts for the various standard ECG changes in patients with symptoms suggestive of NSTEMI. Receiver operating characteristic (ROC) curves were constructed to assess the diagnostic accuracy for the diagnosis of NSTEMI for the CEB and the ECG score. Optimal cutoff values were selected based on the Youden index.
The CEB and the ECG score were combined using binary logistic regression analysis. Comparison of areas under the ROC curves (AUC) was performed as recommended by DeLong, DeLong, & Clarke‐Pearson, (1988). Sensitivities and specificities were compared using McNemar's test (Trajman & Luiz, 2008). Survival rates during 2 years of follow‐up according to CEB tertiles were calculated and the log‐rank test was used to assess differences in survival between groups. Multivariable Cox regression analysis was used to assess the prognostic value of the CEB after adjustment for age and cardiovascular risk factors including hypertension, diabetes, and coronary artery disease.
All hypothesis testing was two‐tailed and p‐values <.05 were considered statistically significant. All statistical analyses were performed using R 3.3.1 (R Core Team, 2016) with package Survival 2.39.5 (Therneau, 2015; Therneau & Grambsch, 2000).
3. RESULTS
3.1. Characteristics of patients
Baseline characteristics of the 1097 patients with acute chest pain are shown in Table 1. The adjudicated final diagnosis was NSTEMI in 150 patients (14%). Unstable angina (UA) was the diagnosis in 118 (11%), cardiac symptoms of origin other than coronary artery diseases (CAD) in 140 (13%), noncardiac symptoms in 639 (58%), and symptoms of unknown origin in 50 (4.6%). At presentation to the ED and recording of the ECG, 497 patients (45%) still had active symptoms, and 255 patients did not (23%). For 341 patients (31%), it was unknown whether they had active symptoms.
Table 1.
Baseline characteristics of the patients in the study cohort
| All patients (n = 1,097) | NSTEMI (n = 150) | Others (n = 947) | p value | |
|---|---|---|---|---|
| Age—year | 57 (46–71) | 68 (56–77) | 56 (44–69) | <.001 |
| Male gender—no. (%) | 751 (68) | 117 (78) | 634 (67) | .009 |
| Risk factors—no. (%) | ||||
| Hypertension | 603 (55) | 115 (77) | 488 (52) | <.001 |
| Hypercholesterolemia | 492 (45) | 96 (64) | 396 (42) | <.001 |
| Diabetes | 134 (12) | 33 (22) | 101 (11) | <.001 |
| Current smoking | 320 (29) | 40 (27) | 280 (30) | .529 |
| History of smoking | 366 (33) | 56 (37) | 310 (33) | .309 |
| History—no. (%) | ||||
| Coronary artery disease | 350 (32) | 79 (53) | 271 (29) | <.001 |
| Previous myocardial infarction | 247 (23) | 59 (39) | 188 (20) | <.001 |
| Previous revascularization | 301 (27) | 68 (45) | 233 (25) | <.001 |
| Creatinine clearance (CKD‐EPI)—(ml/min/1.73 m2) | 94 (78–106) | 85 (64–97) | 95 (81–107) | <.001 |
| ECG findings | ||||
| CEB | 31 (17–65) | 44 (21–98) | 30 (16–61) | <.001 |
| T‐inversion—no. (%) | 110 (10) | 41 (27) | 69 (7) | <.001 |
| ST‐depression—no. (%) | 99 (9) | 45 (30) | 54 (6) | <.001 |
| Heart rate (bpm) | 72 (63–82) | 71 (63–81) | 72 (63–82) | .582 |
| QRS duration (ms) | 96 (90–104) | 98 (90–104) | 96 (90–103) | .292 |
| QTc time (ms) | 426 (410–442) | 435 (416–455) | 424 (408–441) | <.001 |
| Biomarker | ||||
| hs‐cTnT (ng/L) | 7 (4–14) | 59 (23–157) | 6 (4–10) | <.001 |
| Treatment | ||||
| PCI/CABG—no. (%) | 158 (14) | 96 (64) | 62 (7) | <.001 |
3.2. Levels of the CEB
Overall, the median CEB was 31 (IQR 17–65). The distribution of several baseline characteristics across CEB tertiles are shown in Table 2. Patients in higher CEB tertiles were older and had more cardiovascular risk factors as well as more often a history of CAD, AMI, and revascularization. Patients in higher CEB tertiles underwent more often a percutaneous coronary intervention (PCI) or a coronary artery bypass surgery (CABG). With regard to standard ECG parameters, we found no relevant correlations between the CEB and QRS duration (r = .045, p = .13) or QTc interval (r = .11, p < .001). In patients with presence of either ST‐depressions or T‐wave inversion, CEB levels were significantly higher (p < .001) compared to those without ECG changes indicative of ischemia (median 45, IQR 20–102 vs. median 30, IQR 16–60). Results from linear regression analysis for the predictors of CEB are shown in Table 3. The strongest predictor of CEB was found to be age followed by other cardiovascular risk factors.
Table 2.
Baseline characteristics of patients in relation to CEB tertiles
| Tertile 1 (CEB < 20) (n = 368) | Tertile 2 (CEB 20–48) (n = 367) | Tertile 3 (CEB > 48) (n = 362) | p value | |
|---|---|---|---|---|
| Age—year | 50 (40–62) | 57 (47–69) | 64 (53–74) | <.001 |
| Male gender—no. (%) | 265 (72) | 251 (68) | 235 (65) | .119 |
| Risk factors—no. (%) | ||||
| Hypertension | 159 (43) | 206 (56) | 238 (66) | <.001 |
| Hypercholesterolemia | 133 (36) | 165 (45) | 194 (54) | <.001 |
| Diabetes | 35 (10) | 44 (12) | 55 (15) | .063 |
| Current smoking | 132 (36) | 109 (30) | 79 (22) | <.001 |
| History of smoking | 99 (27) | 130 (35) | 137 (38) | .004 |
| History—no. (%) | ||||
| Coronary artery disease | 76 (21) | 121 (33) | 153 (42) | <.001 |
| Previous myocardial infarction | 46 (12) | 85 (23) | 116 (32) | <.001 |
| Previous revascularization | 62 (17) | 104 (28) | 135 (37) | <.001 |
| Creatinine clearance (CKD‐EPI)—(ml/min/1.73 m2) | 101 (88–111) | 94 (78–105) | 87 (71–98) | <.001 |
| ECG findings | ||||
| CEB | 12 (8–17) | 32 (25–39) | 89 (65–140) | <.001 |
| T‐inversion—no. (%) | 26 (7) | 27 (7) | 57 (16) | <.001 |
| ST‐depression—no. (%) | 26 (7) | 28 (8) | 45 (12) | .021 |
| Heart rate (bpm) | 74 (63–87) | 70 (62–81) | 72 (63–79) | .014 |
| QRS duration (ms) | 96 (90–102) | 96 (88–102) | 98 (90–104) | .236 |
| Biomarker | ||||
| hs‐cTnT (ng/L) | 5 (3–10) | 6 (4–13) | 9 (5–18) | <.001 |
| Diagnosis | ||||
| NSTEMI (%) | 35 (10) | 44 (12) | 71 (20) | <.001 |
| Treatment | ||||
| PCI/CABG—no. (%) | 36 (10) | 52 (14) | 70 (19) | .001 |
ECG, electrocardiogram; hs‐cTnT, high‐sensitivity cardiac troponin; NSTEMI, non‐ST‐elevation myocardial infarction; PCI, percutaneous coronary intervention; CABG, coronary artery bypass surgery; numbers are presented as median (IQR) or numbers (%); CKD‐EPI, chronic kidney disease epidemiology collaboration equation.
Table 3.
Linear regression of predictors of CEB
| CEB ~ Variable | r | p |
|---|---|---|
| Age—year | .175 | <.001 |
| History of coronary artery disease | .129 | <.001 |
| Hypertension | .127 | <.001 |
| Hypercholesterolemia | .123 | <.001 |
| Standard ECG changes indicative of NSTEMI | .109 | <.001 |
r is the correlation coefficient. r 2 is the coefficient of determination.
Median hs‐cTnT levels at admission to the ED were 7 ng/L (IQR 4–14) in the overall cohort. In patients with NSTEMI, levels were significantly higher compared to patients with other causes of chest pain (59 ng/L (IQR 23–157) vs. 6 ng/L (IQR 4–10), p < .001). A weak but statistically significant correlation between levels of hs‐cTnT at admission to the ED and the CEB was found (r = .23, p < .001). For a subgroup of 864 patients (79%), hs‐cTnI levels were available at presentation. Similarly, a weak but statistically significant correlation between levels of hs‐cTnI at admission to the ED and the CEB was found (r = .24, p < .001). A significant difference in correlation between levels of hs‐TnT and CEB, or between levels of hs‐TnI and CEB, in the group of early presenters, patients presenting within 3 hr of onset of infarct symptoms, compared to late presenters, could not be found (p > .05).
3.3. Diagnostic value of CEB levels
Overall, CEB levels were higher in patients with NSTEMI as compared to patients with other causes of chest pain (median 44 (IQR 21–98) vs. median 30 (IQR 16–61), p < .001). Median CEB levels in patients with unstable angina and cardiac symptoms other than coronary artery disease were 40 (IQR 23–84) and 34 (IQR 16–60) (p = .48 and 0.006 for comparison with patients with NSTEMI).
The diagnostic accuracy of the CEB at presentation for the diagnosis of NSTEMI as quantified by the area under the receiver operating characteristic curve (AUC) was 0.62 (95 % CI 0.57–0.66, Figure 2). The diagnostic value of the CEB was similar regardless of the presence or absence of active symptoms (AUC 0.61 vs. 0.63, p = .75).
Figure 2.
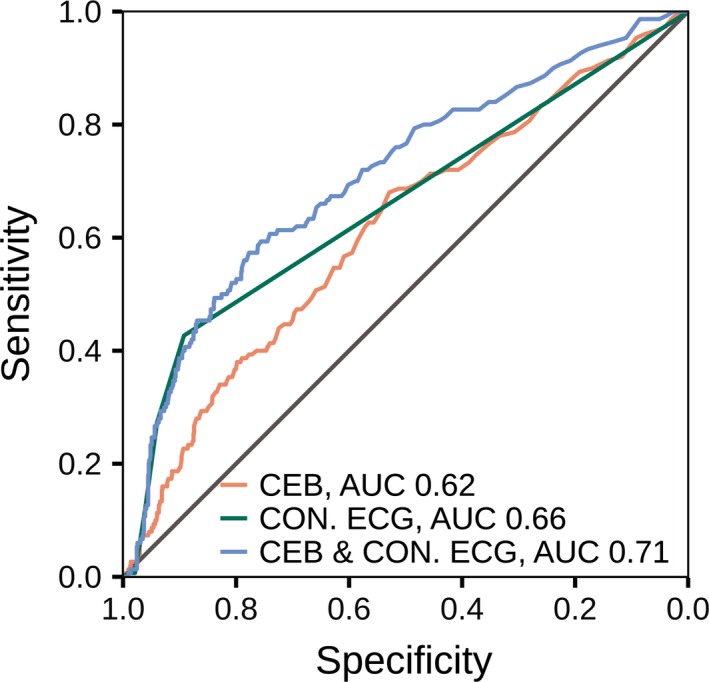
ROC curves at presentation for the diagnosis of NSTEMI. Area under the receiver operator characteristic (ROC) curves for a score incorporating conventional ECG criteria (CON ECG, green line) and the cardiac electrical biomarker (CEB, red line) at presentation, and the combination (blue line) of both in the diagnosis of non‐ST‐elevation myocardial infarction (NSTEMI)
Evaluating the value of the CEB as a diagnostic test for NSTEMI, ROC curve yielded an optimal cutoff value of 32. Using this cutoff value yielded sensitivity, specificity, negative predictive values (NPV), and positive predictive values (PPV) of 68%, 53%, 91%, and 19%. The diagnostic results of the previously published CEB thresholds of 65 and 95 are shown in Table 4 (Schreck & Fishberg, 2014).
Table 4.
(a) All patients, (b) patients without standard ECG changes indicative of NSTEMI, (c) patients with standard ECG changes indicative of NSTEMI
| n = 1,097, AUC = 0.62 | CEB diagnostic results | ||||
|---|---|---|---|---|---|
| CEB threshold | Sens | Spec | NPV | PPV | |
| (a) | |||||
| ROC‐optimized cutoff | 32 | 68 | 53 | 91 | 19 |
| Manufacturer threshold for AMI inclusion (Schreck & Fishberg, 2014) | 95 | 27 | 87 | 88 | 25 |
| Manufacturer threshold for AMI exclusion (Schreck & Fishberg, 2014) | 65 | 39 | 77 | 89 | 21 |
| n = 931, AUC = 0.60 | CEB diagnostic results | ||||
|---|---|---|---|---|---|
| CEB threshold | Sens | Spec | NPV | PPV | |
| (b) | |||||
| ROC‐optimized cutoff | 32 | 64 | 54 | 94 | 13 |
| Manufacturer threshold for AMI inclusion (Schreck & Fishberg, 2014) | 95 | 21 | 88 | 92 | 16 |
| Manufacturer threshold for AMI exclusion (Schreck & Fishberg, 2014) | 65 | 33 | 78 | 92 | 13 |
| n = 166, AUC = 0.57 | CEB diagnostic results | ||||
|---|---|---|---|---|---|
| CEB Threshold | Sens | Spec | NPV | PPV | |
| (c) | |||||
| ROC‐optimized cutoff | 32 | 73 | 41 | 71 | 44 |
| Manufacturer threshold for AMI inclusion (Schreck & Fishberg, 2014) | 95 | 34 | 78 | 66 | 50 |
| Manufacturer threshold for AMI exclusion (Schreck & Fishberg, 2014) | 65 | 48 | 67 | 67 | 48 |
AMI, acute myocardial infarction; Sens, sensitivity; Spec, specificity; NPV, negative predictive value; PPV, positive predictive value.
3.4. Incremental diagnostic value of the CEB in addition to conventional ECG interpretation for the diagnosis of NSTEMI
ECG changes indicative of NSTEMI, being ST‐depressions or T‐wave inversions, were found in 15% of the patients. NSTEMI was the final diagnosis in 39% of patients with ECG changes compared to 9% in those without (p < .001). The presence of any conventional ECG changes indicative of ischemia used as a binary variable reached a sensitivity of 43%, a specificity of 89%, a NPV of 91%, and a PPV of 39%.
A previously published score incorporating conventional ECG changes was calculated assigning 5 points for ST‐depressions and 2 points for T‐wave inversions (Abächerli et al., 2017). This score accounts for the various standard ECG changes in patients with symptoms suggestive of NSTEMI. The diagnostic accuracy of this conventional ECG score for the diagnosis of NSTEMI as quantified by the AUC was 0.66 (95% CI 0.62–0.70), which was similar compared to the AUC of the CEB (p = .16, Figure 2).
The combination of the two markers significantly improved the diagnostic accuracy provided by the conventional ECG marker score alone, with an AUC of 0.71 (95% CI 0.66–0.76, p < .001 for comparison, Figure 2).
The combination of the CEB as a binary marker at the ROC‐derived cutoff of 32 and the presence of conventional ECG changes improved the sensitivity of the ECG from 43% to 79% (p < .001 for comparison) and the NPV from 91% to 94%, while the specificity decreased from 78% to 48% and the PPV from 29% to 20%.
In the group of patients without ECG changes indicative of NSTEMI (85% of the overall cohort), the diagnostic accuracy of the CEB for the diagnosis of NSTEMI as quantified by the AUC was 0.60 (95% CI 0.54–0.66) as opposed to 0.57 (95% CI 0.47–0.66) in patients with ECG changes indicative of NSTEMI (p = .56 for comparison). The sensitivities, specificities, NPV, and PPV of the CEB in those important subgroups are shown in Table 4b,c.
3.5. Prognostic value of the CEB for the prediction of mortality during follow‐up
During 2 years of follow‐up, there were 41 deaths with a median time to death of 349 days. Median CEB levels in deceased patients were not significantly higher as compared to those in survivors (41 (IQR 18–82) vs. 31 (IQR 17–64), p = .23). Cumulative 2‐year survival rates were 98%, 99%, and 94% according to tertiles of the CEB (p = .14), with a trend toward a higher mortality in patients in the third tertile compared to those in the first two tertiles (p = .06, Figure 3). However, after adjustment for important baseline variables in multivariable analysis (including age and cardiovascular risk factors such as hypertension, diabetes and coronary artery disease), this association was no longer observed (p = .86).
Figure 3.
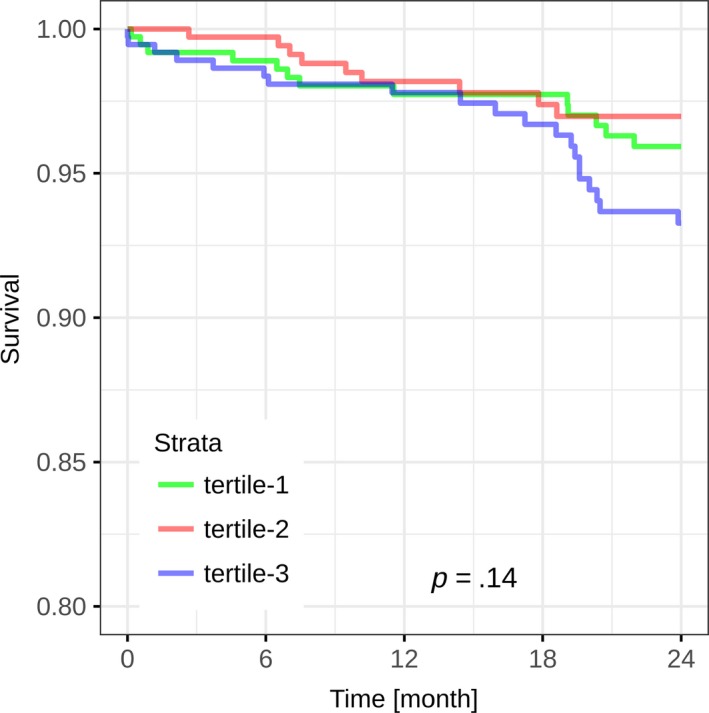
Kaplan–Meier curves for the cumulative survival according to CEB tertiles. Kaplan–Meier curves displaying survival during 24 months of follow‐up according to CEB tertiles. Differences in survival were assessed using the log‐rank test. p = .14 for the comparison of the CEB tertiles
4. DISCUSSION
This large observational study assessed the diagnostic and prognostic value of the CEB, a novel ECG marker quantifying the multipolar activity of the heart for the diagnosis of NSTEMI. We report five major findings:
First, higher CEB values were found in patients that were older, had more cardiovascular risk factors, had more often a history of CAD, and had more often an AMI and a revascularization. Second, we found a weak correlation between levels of the CEB and hs‐cTnT (r = .23, p < .001) as well as hs‐cTnI (r = .24, p < .001). Third, CEB levels were significantly higher in patients with NSTEMI as compared to patients with other diagnoses (median 44 (IQR 21–98) vs. median 30 (IQR 16–61), p < .001). The diagnostic accuracy of the CEB for the diagnosis of NSTEMI was moderate and similar to that of a score quantifying conventional ECG criteria (AUC 0.62 vs. 0.66, p = .16). Fourth, the combined use of the CEB and conventional ECG criteria increased the AUC from 0.66 to 0.71 (p < .001) and the sensitivity of the ECG for NSTEMI from 43% to 79% (p < .001). And fifth, there was a trend toward a higher mortality during 2‐year follow‐up in patients in the third tertile compared to those in the first two tertiles in univariate analysis. After adjustment for important baseline characteristics including age and cardiovascular risk factors, this association however was no longer observed.
Our findings have clinical implications. The ECG is the cornerstone of the diagnosis of STEMI patients. In NSTEMI patients, however, the conventionally recommended ECG markers of ischemia (Thygesen et al., 2012) such as ST‐segment depression and T‐wave inversion have an acceptable specificity (89% in our study), but suffer from a low sensitivity (43% in our study). ECG markers with improved sensitivity for NSTEMI that are simple, readily available, and interpretable by a wide range of healthcare professionals, are a major unmet clinical need. The proposed CEB is a fully automated ECG marker representing multipolar versus dipolar activity in the cardiac electrical field, higher levels indicate a higher probability of NSTEMI. It is immediately and automatically calculated and reported by the ECG machine as a number, similar to the results of a blood test. Accordingly, its interpretation is simple and does not require additional training in ECG reading, which makes it suitable for use in the ED.
The findings of this large diagnostic study extend and corroborate previous pilot studies on the possible clinical utility of the CEB for the diagnosis of AMI (Schreck & Fishberg, 2014, 2015). In the largest published series to date, Schreck and Fishberg used 508 ECG obtained from various ECG databases and reported a sensitivity of 85%–94% and a specificity of 93% for the CEB to automatically detect standard ECG changes suggestive of myocardial ischemia (Schreck & Fishberg, 2014). These results however must not be confounded with the diagnostic accuracy of the CEB for AMI: given that the gold standard was the presence of standard ECG changes suggestive of AMI during manual ECG interpretation, a NSTEMI patient without ECG changes (which is the case in more than half of all NSTEMI patients) was classified as a non‐AMI patient in that study. Furthermore, 70% of the AMI patients included were STEMIs. Therefore, this study assessed the ability of the CEB to automatically detect standard ECG changes particularly in STEMI patients.
Our study extends the previous CEB‐data by assessing the diagnostic value of the CEB for the first time in NSTEMI patients. Using a gold standard diagnosis incorporating a composite of hs‐cTn levels, 12‐lead ECG and all other available information as suggested in current guidelines (Thygesen et al., 2012) we found significantly higher CEB values in NSTEMI patients compared to patients with other causes of chest pain. When used in addition to conventional ECG changes, the CEB allowed for a remarkable improvement of the ECG sensitivity for NSTEMI from 43% to 79%. The optimal cutoff found in our study (CEB 32) is remarkably lower compared to what has been found in the study by Schreck (CEB 95 for rule‐in, CEB 65 for rule‐out) (Schreck & Fishberg, 2014) and reflects the important difference in the gold standard used as well as the exclusion of STEMI patients in our study that accounted for 70% in the Schreck study (Schreck & Fishberg, 2014).
Tereshchenko et al., (2014) assessed the correlation of hs‐cTnI and the CEB in patients with suspected AMI. While they did not find a correlation between the CEB levels and baseline hs‐cTnI levels, they did find a correlation with hs‐cTnI levels after 3 h. In contrast, we did find a weak but statistically significant correlation in our cohort between CEB levels and both hs‐cTnT and hs‐cTnI levels already at presentation. The only weak or even missing correlation is probably mainly explained by the fact that the CEB mainly reflects myocardial ischemia rather than necrosis such as the cardiac troponins. However, the diagnostic value of the CEB was not different in patients with active symptoms at the time of the ECG compared to those painfree. Our findings suggest that the CEB reflects a summary of the underlying cardiovascular risk factors rather than merely indicating myocardial ischemia.
It is important to highlight that as with any other novel diagnostic marker, the CEB should always be used in conjunction with (and certainly not replace) all other available information from clinical assessment, blood tests and also from the standard ECG. The particular added value of the CEB would be to assist in the very early identification of NSTEMI patients without standard ECG changes but typical symptoms even before the troponin results become available. However, even though the use of the CEB in addition to conventional ECG criteria improved the diagnostic accuracy for NSTEMI (increase in AUC from 0.66 to 0.71 p < .001), NSTEMI was diagnosed in only 20% of patients in the third CEB tertile, indicating a lot of false positive cases. Despite the increase in ECG sensitivity from 43% to 79% (p < .001), NSTEMI was still diagnosed in 10% of patients in the lowest CEB tertile. Accordingly, the diagnostic performance is clearly inferior compared to diagnostic algorithms based on high‐sensitive troponins (Reichlin et al., 2012; Boeddinghaus et al., 2016), and the search for other, better ECG markers of NSTEMI must go on in order to increase the clinical significance of novel automated ECG markers indicative of NSTEMI.
4.1. Limitations
Potential limitations of the present study merit consideration. First, we cannot comment on the value of the CEB in patients with a wide QRS complex >120 ms, because those patients were excluded from analysis. Given that bundle branch blocks result in remarkable changes of both depolarization as well as repolarization, we assume that the resulting changes to the cardiac electrical field make diagnostic value of the CEB in those patients unlikely. Second, there were no imaging data available to assess the association of left ventricular hypertrophy or old scars with CEB levels. Third, we did not record serial ECGs in our patients. Therefore, we cannot asses dynamic CEB changes nor CEB changes after resolution of ischemia. Serial ECGs could have increased the diagnostic value, as well as the pathophysiological understanding of the CEB Marker. Fourth, this is a single center study, and our results require validation in independent cohorts. Fifth, we have assessed the value of the CEB in patients at rest in the ED. Whether or not the marker would be helpful to detect myocardial ischemia in patients undergoing ECG stress testing cannot be answered from our data.
5. CONCLUSION
In conclusion, the CEB, an ECG marker quantifying the multipolar versus dipolar activity of the heart, significantly improves the diagnostic accuracy of the ECG for the diagnosis of NSTEMI and increases the ECG sensitivity from 43% to 79% when used in addition to conventional ECG changes. However, the search for other, better ECG markers of NSTEMI must go on in order to increase the clinical significance of novel automated ECG markers indicative of NSTEMI.
DISCLOSURES
The study was supported by research grants from the Swiss National Science Foundation, the Swiss Heart Foundation, the Cardiovascular Research Foundation Basel, Abbott, Beckman Coulter, BRAHMS, Roche, Siemens, and the University Hospital Basel. Dr. Boeddinghaus has received speaker honoraria from Siemens. Dr. Rubini has received research grants from the Swiss Heart Foundation and speakers honoraria from Abbott. All other authors declare that they have no conflict of interest with this study. Dr. Müller has received research support from the Swiss National Science Foundation, the Swiss Heart Foundation, the Cardiovascular Research Foundation Basel, Abbott, Beckman Coulter, BRAHMS, Roche, Siemens, and the University Hospital Basel, as well as speaker honoraria from Abbott, ALERE, Astra Zeneca, BG Medicine, Biomérieux, Brahms, Cardiorentis, Lilly, Novartis, Roche, and Siemens. Dr. Reichlin has received research grants from the Goldschmidt‐Jacobson Foundation, the Swiss National Science Foundation (PASMP3‐136995), the Swiss Heart Foundation, the Professor Max Cloëtta Foundation, the University of Basel and the University Hospital Basel as well as speaker honoraria from Brahms, Roche, Abbott, St. Jude Medical/Abbott, Biosense Webster and Medtronic.
Supporting information
ACKNOWLEDGMENTS
We are indebted to the patients who participated in the study and to the emergency department staff as well as the laboratory technicians of all participating sites for their most valuable efforts. In addition, we thank Fausta Chiaverio, RN, Sabine Hartwiger, MD, Kathrin Meissner, RN (all University Hospital Basel, Switzerland).
Strebel I, Twerenbold R, Boeddinghaus J, et al. Diagnostic value of the cardiac electrical biomarker, a novel ECG marker indicating myocardial injury, in patients with symptoms suggestive of non‐ST‐elevation myocardial infarction. Ann Noninvasive Electrocardiol. 2018;23:e12538 10.1111/anec.12538
REFERENCES
- Abächerli, R. , Twerenbold, R. , Boeddinghaus, J. , Nestelberger, T. , Mächler, P. , Sassi, R. , … Reichlin, T. (2017). Diagnostic and prognostic values of the V‐index, a novel ECG marker quantifying spatial heterogeneity of ventricular repolarization, in patients with symptoms suggestive of non‐ST‐elevation myocardial infarction. International Journal of Cardiology, 1(236), 23–29. 10.1016/j.ijcard.2017.01.151 [DOI] [PubMed] [Google Scholar]
- Al‐Zaiti, S. S. , Martin‐Gill, C. , Sejdic, E. , Alrawashdeh, M. , & Callaway, C. (2015). Rationale, development, and implementation of the Electrocardiographic Methods for the Prehospital Identification of Non‐ST Elevation Myocardial Infarction Events (EMPIRE). Journal of Electrocardiology, 48(6), 921–926. 10.1016/j.jelectrocard.2015.08.014 [DOI] [PubMed] [Google Scholar]
- Anderson, J. L. , Adams, C. D. , Antman, E. M. , Bridges, C. R. , Califf, R. M. , Casey, D. E. , … Zidar, J. P. (2013). 2012 ACCF/AHA focused update incorporated into the ACCF/AHA 2007 guidelines for the management of patients with unstable angina/non‐ST‐elevation myocardial infarction: A report of the American College of Cardiology Foundation/American Heart Association Task Force on Practice Guidelines. Circulation, 127(23), e663–e828. [DOI] [PubMed] [Google Scholar]
- Apple, F. S. , Jesse, R. L. , Newby, L. K. , Wu, A. H. , & Christenson, R. H. (2007). National academy of clinical biochemistry and IFCC committee for standardization of markers of cardiac damage laboratory medicine practice guidelines: Analytical issues for biochemical markers of acute coronary syndromes. Circulation, 115(13), e352–e355. [DOI] [PubMed] [Google Scholar]
- Boeddinghaus, J. , Reichlin, T. , Cullen, L. , Greenslade, J. H. , Parsonage, W. A. , Hammett, C. , … Mueller, C. (2016). Two‐hour algorithm for triage toward rule‐out and rule‐in of acute myocardial infarction by use of high‐sensitivity cardiac troponin I. Clinical Chemistry, 62(3), 494–504. 10.1373/clinchem.2015.249508 [DOI] [PubMed] [Google Scholar]
- Boeddinghaus, J. , Reichlin, T. , Nestelberger, T. , Twerenbold, R. , Meili, Y. , Wildi, K. , … Mueller, C. (2017). Early diagnosis of acute myocardial infarction in patients with mild elevations of cardiac troponin. Clinical Research in Cardiology, 1, 1–11. [DOI] [PubMed] [Google Scholar]
- Bossuyt, P. M. (2003). The STARD statement for reporting studies of diagnostic accuracy: Explanation and elaboration. Annals of Internal Medicine, 138(1), W1 10.7326/0003-4819-138-1-200301070-00012-w1 [DOI] [PubMed] [Google Scholar]
- DeLong, E. R. , DeLong, D. M. , & Clarke‐Pearson, D. L. (1988). Comparing the areas under two or more correlated receiver operating characteristic curves: A nonparametric approach. Biometrics, 44(3), 837–845. 10.2307/2531595 [DOI] [PubMed] [Google Scholar]
- Giannitsis, E. , Kurz, K. , Hallermayer, K. , Jarausch, J. , Jaffe, A. S. , & Katus, H. A. (2010). Analytical validation of a high‐sensitivity cardiac troponin T assay. Clinical Chemistry, 56(2), 254–261. 10.1373/clinchem.2009.132654 [DOI] [PubMed] [Google Scholar]
- Gimenez, M. R. , Twerenbold, R. , Reichlin, T. , Wildi, K. , Haaf, P. , Schaefer, M. , … Mueller, C. (2014). Direct comparison of high‐sensitivity‐cardiac troponin I vs. T for the early diagnosis of acute myocardial infarction. European Heart Journal, 35(34), 2303–2311. 10.1093/eurheartj/ehu188 [DOI] [PubMed] [Google Scholar]
- Haaf, P. , Drexler, B. , Reichlin, T. , Twerenbold, R. , Reiter, M. , Meissner, J. , … Mueller, C. (2012). High‐sensitivity cardiac troponin in the distinction of acute myocardial infarction from acute cardiac noncoronary artery disease. Circulation, 126(1), 31–40. 10.1161/CIRCULATIONAHA.112.100867 [DOI] [PubMed] [Google Scholar]
- Hamm, C. W. , Bassand, J. P. , Agewall, S. , Bax, J. , Boersma, E. , Bueno, H. , … Widimsky, P. (2011). ESC Guidelines for the management of acute coronary syndromes in patients presenting without persistent ST‐segment elevation: The Task Force for the management of acute coronary syndromes (ACS) in patients presenting without persistent ST‐segment elevation of the European Society of Cardiology (ESC). European Heart Journal, 32(23), 2999–3054. [DOI] [PubMed] [Google Scholar]
- Keller, T. , Zeller, T. , Ojeda, F. , Tzikas, S. , Lillpopp, L. , Sinning, C. , … Blankenberg, S. (2011). Serial changes in highly sensitive troponin I assay and early diagnosis of myocardial infarction. JAMA, 306(24), 2684–2693. 10.1001/jama.2011.1896 [DOI] [PubMed] [Google Scholar]
- Keller, T. , Zeller, T. , Peetz, D. , Tzikas, S. , Roth, A. , Czyz, E. , … Blankenberg, S. (2009). Sensitive troponin I assay in early diagnosis of acute myocardial infarction. New England Journal of Medicine, 361(9), 868–877. 10.1056/NEJMoa0903515 [DOI] [PubMed] [Google Scholar]
- Koerbin, G. , Tate, J. , Potter, J. M. , Cavanaugh, J. , Glasgow, N. , & Hickman, P. E. (2012). Characterisation of a highly sensitive troponin I assay and its application to a cardio‐healthy population. Clinical Chemistry and Laboratory Medicine, 50(5), 871–878. [DOI] [PubMed] [Google Scholar]
- Kontos, M. C. , Diercks, D. B. , & Kirk, J. D. (2010). Emergency department and office‐based evaluation of patients with chest pain. Mayo Clinic Proceedings, 85(3), 284–299. 10.4065/mcp.2009.0560 [DOI] [PMC free article] [PubMed] [Google Scholar]
- Levey, A. S. , Stevens, L. A. , Schmid, C. H. , Zhang, Y. L. , Castro, A. F. , Feldman, H. I. , … Coresh, J. (2009). A new equation to estimate glomerular filtration rate. Annals of Internal Medicine, 150(9), 604–612. 10.7326/0003-4819-150-9-200905050-00006 [DOI] [PMC free article] [PubMed] [Google Scholar]
- Nawar, E. W. , Niska, R. W. , & Xu, J. (2007). National hospital ambulatory medical care survey: 2005 emergency department summary. Advanced Data, 386, 1–32. [PubMed] [Google Scholar]
- R Core Team . (2016). R: A Language and Environment for Statistical Computing [Internet]. Vienna, Austria: R Foundation for Statistical Computing; 2016. Retrieved from https://www.R-project.org/
- Reichlin, T. , Hochholzer, W. , Bassetti, S. , Steuer, S. , Stelzig, C. , Hartwiger, S. , … Mueller, C. (2009). Early diagnosis of myocardial infarction with sensitive cardiac troponin assays. New England Journal of Medicine, 361(9), 858–867. 10.1056/NEJMoa0900428 [DOI] [PubMed] [Google Scholar]
- Reichlin, T. , Hochholzer, W. , Stelzig, C. , Laule, K. , Freidank, H. , Morgenthaler, N. G. , … Mueller, C. (2009). Incremental value of copeptin for rapid rule out of acute myocardial infarction. Journal of the American College of Cardiology, 54(1), 60–68. 10.1016/j.jacc.2009.01.076 [DOI] [PubMed] [Google Scholar]
- Reichlin, T. , Irfan, A. , Twerenbold, R. , Reiter, M. , Hochholzer, W. , Burkhalter, H. , … Mueller, C. (2011). Utility of absolute and relative changes in cardiac troponin concentrations in the early diagnosis of acute myocardial infarction. Circulation, 124(2), 136–145. 10.1161/CIRCULATIONAHA.111.023937 [DOI] [PubMed] [Google Scholar]
- Reichlin, T. , Schindler, C. , Drexler, B. , Twerenbold, R. , Reiter, M. , Zellweger, C. , … Mueller, C. (2012). One‐hour rule‐out and rule‐in of acute myocardial infarction using high‐sensitivity cardiac troponin T. Archives of Internal Medicine, 172(16), 1211–1218. 10.1001/archinternmed.2012.3698 [DOI] [PubMed] [Google Scholar]
- Reiter, M. , Twerenbold, R. , Reichlin, T. , Haaf, P. , Peter, F. , Meissner, J. , … Mueller, C. (2011). Early diagnosis of acute myocardial infarction in the elderly using more sensitive cardiac troponin assays. European Heart Journal, 32(11), 1379–1389. 10.1093/eurheartj/ehr033 [DOI] [PubMed] [Google Scholar]
- Roffi, M. , Patrono, C. , Collet, J. P. , Mueller, C. , Valgimigli, M. , Andreotti, F. , … Windecker, S. (2016). 2015 ESC Guidelines for the management of acute coronary syndromes in patients presenting without persistent ST‐segment elevation: Task Force for the Management of Acute Coronary Syndromes in Patients Presenting without Persistent ST‐Segment Elevation of the European Society of Cardiology (ESC). European Heart Journal, 37(3), 267–315. 10.1093/eurheartj/ehv320 [DOI] [PubMed] [Google Scholar]
- Safford, M. M. , Parmar, G. , Barasch, C. S. , Halanych, J. H. , Glasser, S. P. , Goff, D. C. , … Brown, T. M. (2013). Hospital laboratory reporting may be a barrier to detection of ‘microsize’ myocardial infarction in the US: An observational study. BMC Health Services Research, 13, 162 10.1186/1472-6963-13-162 [DOI] [PMC free article] [PubMed] [Google Scholar]
- Schreck, D. M. , & Fishberg, R. D. (2014). Diagnostic accuracy of a new cardiac electrical biomarker for detection of electrocardiogram changes suggestive of acute myocardial ischemic injury. Annals of Noninvasive Electrocardiology, 19(2), 129–144. 10.1111/anec.12109 [DOI] [PMC free article] [PubMed] [Google Scholar]
- Schreck, D. M. , & Fishberg, R. D. (2015). Detection of acute myocardial ischemic injury by gender using a novel cardiac electrical biomarker. American Journal of Emergency Medicine, 33(3), 383–390. 10.1016/j.ajem.2014.12.029 [DOI] [PubMed] [Google Scholar]
- Steg, P. G. , James, S. K. , Atar, D. , Badano, L. P. , Blomstrom‐Lundqvist, C. , Borger, M. A. , … Zahger, D. (2012). ESC Guidelines for the management of acute myocardial infarction in patients presenting with ST‐segment elevation. European Heart Journal, 33(20), 2569–2619. [DOI] [PubMed] [Google Scholar]
- Tereshchenko, L. G. , Gatz, D. , Feeny, A. , & Korley, F. K. (2014). Automated analysis of the 12‐lead ECG in the emergency department: Association between high‐sensitivity cardiac troponin I and the cardiac electrical biomarker. Critical Pathways in Cardiology, 13(1), 25–28. 10.1097/HPC.0000000000000006 [DOI] [PubMed] [Google Scholar]
- Therneau, T. M. (2015). A Package for Survival Analysis in S [Internet]. 2015. Retrieved from http://CRAN.R-project.org/package=survival
- Therneau, T. M. , & Grambsch, P. M. (2000). Modeling survival data: Extending the Cox model. New York: Springer; 10.1007/978-1-4757-3294-8 [DOI] [Google Scholar]
- Thygesen, K. , Alpert, J. S. , Jaffe, A. S. , Simoons, M. L. , Chaitman, B. R. , White, H. D. , … Mendis, S. (2012). Third universal definition of myocardial infarction. Circulation, 126(16), 2020–2035. 10.1161/CIR.0b013e31826e1058 [DOI] [PubMed] [Google Scholar]
- Thygesen, K. , Alpert, J. S. , White, H. D. , Jaffe, A. S. , Apple, F. S. , Galvani, M. , … Mendis, S. (2007). Universal definition of myocardial infarction. Circulation, 116(22), 2634–2653. 10.1161/CIRCULATIONAHA.107.187397 [DOI] [PubMed] [Google Scholar]
- Thygesen, K. , Mair, J. , Giannitsis, E. , Mueller, C. , Lindahl, B. , Blankenberg, S. , Collinson, P. (2012). How to use high‐sensitivity cardiac troponins in acute cardiac care. European Heart Journal, 33(18), 2252–2257. 10.1093/eurheartj/ehs154 [DOI] [PubMed] [Google Scholar]
- Trajman, A. , & Luiz, R. R. (2008). McNemar chi2 test revisited: Comparing sensitivity and specificity of diagnostic examinations. Scandinavian Journal of Clinical and Laboratory Investigation, 68(1), 77–80. 10.1080/00365510701666031 [DOI] [PubMed] [Google Scholar]
Associated Data
This section collects any data citations, data availability statements, or supplementary materials included in this article.
Supplementary Materials