

Abstract
Background
Sudden cardiac death (SCD) results from a complex interplay of abnormalities in autonomic function, myocardial substrate and vulnerability. We studied whether a combination of noninvasive risk stratification tests reflecting these key players could improve risk stratification.
Methods
Patients implanted with an ICD in whom 24‐hr holter recordings were available prior to implant were included. QRS fragmentation (fQRS) was selected as measure of myocardial substrate and a high ventricular premature beat count (VPB >10/hr) for arrhythmic vulnerability. From receiver operating characteristics analysis, detrended fluctuation analysis (DFA), turbulence slope, and deceleration capacity were selected for autonomic function. Adjusted Cox regression analysis with comparison of C‐statistics was performed to predict first appropriate shock (AS) and total mortality.
Results
A total of 220 patients were included in the analysis with an overall follow‐up of 4.3 ± 3.1 years. A model including VPB >10/hr, inferior fQRS, and abnormal nonedited DFA was the best for prediction of AS after 1 year of follow‐up with a trends toward improvement of the C‐statistics compared to baseline (p = 0.055). The risk increased significantly with every abnormal test (HR 1.793, 95%CI 1.255–2.564). A model including fQRS in any region and abnormal edited DFA was the best for prediction of mortality after 3 years of follow‐up with significant improvement of the C‐statistics (p = 0.023). Each abnormal test was associated with a significant increase in mortality (HR 5.069, 95%CI 1.978–12.994).
Conclusion
Combining noninvasive risk stratification tests according to their physiological background can improve the risk prediction of SCD and mortality.
Keywords: heart rate variability, implantable cardioverter‐defibrillator, sudden cardiac death
1. INTRODUCTION
Sudden cardiac death (SCD) remains an important cause of death with an estimated yearly incidence in Europe of 400 000 deaths and an important socio‐economic burden (Goldberger et al., 2011). It is estimated that 50%–70% of cases are due to ventricular tachyarrhythmia's (Goldberger et al., 2011). The implantation of an implantable cardioverter‐defibrillator (ICD) in patients with a severely reduced left ventricular ejection fraction (LVEF) has shown to reduce the incidence of SCD (Moss et al., 2002). However, current patient selection for primary prevention of SCD in ischemic (ICM) and nonischemic cardiomyopathy (NICM) is based on LVEF while most cases of SCD occur in patients with normal LVEF and many patients with a severely reduced LVEF are at low risk of SCD (Deyell, Krahn, & Goldberger, 2015; Exner, 2009). The ultimate goal is to identify only those patients who will experience SCD in the nearby future with a bare minimum of false positives.
SCD results from a complex interplay of numerous factors. Ventricular arrhythmia, potentially leading to SCD, is linked to preceding abnormalities in the autonomic control of the cardiovascular system (Deyell et al., 2015). Alterations in autonomic function are not likely to cause events without the presence of myocardial abnormalities called the myocardial substrate. Myocardial vulnerability is the final trigger for ventricular arrhythmia. Current noninvasive risk stratification tools focus on the pathophysiological mechanisms underlying ventricular arrhythmia: slow conduction, extent of myocardial damage, disturbances in autonomic tone, ventricular ectopy and dispersion of ventricular repolarization (Exner, 2009). Due to the complex interplay, risk stratification based on a single parameter is likely not successful (Exner, 2009). Therefore, the objective of this study was to determine whether a combination of noninvasive risk stratification tools based on this pathophysiological triad of SCD could improve the prediction of ventricular arrhythmia and mortality in ICD recipients.
2. METHODS
2.1. Patient population
All patients implanted with an ICD at the University Hospitals of Leuven until December 31, 2013, and a minimum follow‐up of 1 year were included in a retrospective registry. The main design and findings of this registry have been published earlier (Vandenberk et al., 2016). Briefly, patients with ICM or NICM and indication for an ICD in primary or secondary prevention of SCD conforming to current guidelines were selected for further analysis. Single chamber, dual chamber, and cardiac resynchronization devices with defibrillators (CRT‐D) were included. Device programming and pharmacological treatment were adapted according to the guidelines at that moment. Demographic, clinical, and electrocardiographic data before first implantation were collected by review of the electronic medical record. For this analysis, we focused on patients with stored 24‐hr holter recording acquired before first ICD implant. Patients were excluded if no 24‐hr holter recording was available, either not performed or only after ICD implant, if the recording registered atrial fibrillation (AF) or if pacemaker activity was present. The study was approved by the ethical committee of the University Hospitals of Leuven.
2.2. Endpoints
The primary endpoint of the study was first appropriate shock (AS) by the defibrillator independently of preceding anti‐tachycardia pacing. The date and cause of AS were collected and verified using source documents. ICD programming was collected both at implant and at time of first AS. The secondary endpoint was total mortality. Mortality was collected with date and cause of death. In case of heart transplant, the date of transplantation was considered last follow‐up. Endpoints were collected until December 31, 2014. Because a single baseline measurement might not predict long‐term events and the patients general health status changes over time, analysis was performed with short‐term follow‐up after 1 year and 3 years follow‐up.
2.3. QRS fragmentation
Resting 12‐lead electrocardiograms (25 mm/s paper speed, 10 mm/mV, filter range 0.05–150 Hz with notch filter at 50/60 Hz) before ICD implantation were collected and analyzed for the presence of QRS fragmentation (fQRS). Since all patients received a routine preoperative 12‐lead ECG, a good quality tracing was present in all 12 leads. Analysis was performed blinded for endpoints and without digital magnification of the traces. fQRS criteria differ depending on QRS‐duration and morphology. ECGs were separated in subgroups: QRS‐duration ≤120 ms and QRS‐duration >120 ms based on automated analysis by the “GE Marquette 12SLTM ECG Analysis Program” (GE Medical Systems, Menomonee Falls, WI). In patients with QRS‐duration ≤120 ms, fQRS was defined as the presence of any RSR’ pattern, ≥1 R prime or notching of R or S wave (Das, Khan, Jacob, Kumar, & Mahenthiran, 2006). In case of QRS‐duration >120 ms, fQRS was defined as various RSR’ patterns with or without a Q wave, with >2 R waves (R’) or >2 notches in the R wave, or >2 notches in the downstroke or upstroke of the S wave (Das et al., 2008). fQRS was considered to be present when recorded in ≥2 contiguous leads as divided by major coronary artery territory: anterior as V1 to V5; lateral as I, aVL, and V6; and inferior as II, III, and aVF (Das et al., 2006).
2.4. Holter recordings and analysis
Twenty‐four hour ambulatory two‐ or three‐channel ECG recordings were analyzed by means of Synescope Holter software (LivaNova). The following noninvasive risk stratification tests were calculated: heart rate variability (HRV) including detrended fluctuation analysis (DFA), heart rate turbulence (HRT) with turbulence onset (TO) and turbulence slope (TS), deceleration capacity (DC), and 24‐hr QTe/RR analysis. A detailed list of risk stratification tests, parameters, and their respective methodologies are available in Supporting information Supplement S1.
2.5. Statistical analysis
Continuous variables are presented as mean ± standard deviation and categorical variables as number and percentages. Parameters were compared between groups using unpaired Student's t test and chi‐square test when appropriate. First, the predictive value of all noninvasive risk stratification tests performed on 24‐hr holter recordings was investigated by receiver operating characteristics (ROC) analysis for the primary and secondary endpoint. As different tests assessing autonomic function could represent different autonomic behavior and therefore may yield different prognostic information, multiple tests for autonomic function were studied in separate models. For both the primary and secondary endpoints, the tests with the highest AUC after 3 years follow‐up were selected for further analysis. Cox proportional‐hazards regression modeling was used to evaluate the contribution of different parameters to endpoints. Adjusted multivariate Cox regression analysis was performed with a baseline model including: age, sex, etiology of cardiac disease, ICD indication, NYHA class, left ventricular ejection fraction, renal function, use of amiodarone, and the mean heart rate over 24 hr. Then, the selected tests were added separately to the baseline model and their predictive value was assessed using C‐statistics and compared to the baseline model by means of a Z‐test. In the final step, parameters were added together to the baseline model and C‐statistics were calculated for comparison to the baseline model. Bootstrapping to 1,000 samples was performed to assess the reliability of the adjusted regression models, and regression coefficients (B) and 95% confidence intervals were added as supplement. Finally, Kaplan–Meier analysis with log‐rank testing was used to compare endpoint rates between patients according to the number of abnormal parameters expressed as a risk score. A p‐value <0.050 was considered significant. All statistical analyses were performed using SPSS (IBM Statistics, version 23).
3. RESULTS
3.1. Patient population
In 268 patients, a 24‐hr holter recording was available prior to first ICD implant. Of these, 36 were excluded because of the presence of AF and 12 because of pacemaker activity. Further analysis was performed based on 220 patients fulfilling the in‐ and exclusion criteria. Patient characteristics are shown in Table 1 and ICD programming in Supporting information Supplement S2. After 1 year follow‐up, 29 (13.2%) patients received a first AS, 20 (69.0%) for ventricular tachycardia, and 9 (31.0%) for ventricular fibrillation. After 3 years of follow‐up, 42 (19.1%) patients received a first AS, 28 shocks (66.7%) for ventricular tachycardia and 14 (33.3%) for ventricular fibrillation, and 15 (6.8%) died of the latter 10 cases were cardiac‐related death. As only 7 (3.2%) patients died within 1 year of follow‐up, no further analysis was performed for mortality after 1 year of follow‐up. There were no significant differences in endpoints between ICM and NICM patients.
Table 1.
Patient characteristics
| Parameters | Number |
|---|---|
| Total | 220 (100%) |
| Follow‐up (year) | 4.3 ± 3.1 |
| Age (year) | 59.0 ± 13.3 |
| Female gender | 41 (18.6%) |
| Primary prevention | 175 (79.5%) |
| ICM | 128 (58.2%) |
| LVEF (%) | 28.9 ± 10.6 |
| BMI (kg/m2) | 25.9 ± 4.3 |
| NYHA class | |
| I | 58 (26.4%) |
| II | 77 (35.0%) |
| III | 85 (38.6%) |
| Device | |
| VVI | 89 (40.5%) |
| DDD | 51 (23.2%) |
| CRT‐D | 80 (36.4%) |
| Medical history | |
| Stroke | 22 (10.0%) |
| Diabetes | 39 (17.7%) |
| AF | 49 (23.3%) |
| Medication | |
| Beta‐blocker | 189 (85.9%) |
| ACE‐I/ARB | 203 (92.3%) |
| Loop diuretic | 141 (64.1%) |
| Aspirin | 129 (58.6%) |
| Amiodarone | 74 (33.6%) |
| Digitalis | 24 (10.9%) |
| Statin | 140 (63.6%) |
| eGFR (mL/kg/min) | 63.6 ± 21.5 |
| ECG | |
| Heart rate (bpm) | 65.0 ± 13.1 |
| AF | 8 (3.6%) |
| QRS (ms) | 131.2 ± 32.5 |
| LBBB | 71 (32.3%) |
3.2. Holter results
In 3 patients, additional analysis of the Holter recordings was not possible, either due to high number of ventricular premature beats (VPB) (n = 2) or technical failure (n = 1). The ROC analysis for AS showed the highest AUC for DC and nonedited DFA α1 (Supporting information Supplement S3). Abnormal DC was present in 88 patients (40.6%). The nonedited DFA α1 cutoff was set on ≤0.42 and 53 (25.4%) patients had abnormal values. In total, 48 (21.8%) patients had both a high‐risk DC and abnormal nonedited DFA α1 values. Both measures were significant predictors of AS after 1 and 3 years of follow‐up in univariate Cox regression analysis (Table 2).
Table 2.
Univariate Cox regression analysis
| (A) Appropriate shocks | ||||
|---|---|---|---|---|
| AS 1y | AS 3y | |||
| p‐value | HR (95% CI) | p‐value | HR (95% CI) | |
| VPB >10/hr | 0.013 | 3.374 (1.287–8.843) | 0.044 | 2.025 (1.018–4.029) |
| Presence of fQRS inferior | 0.063 | 2.110 (0.961–4.635) | 0.097 | 1.674 (0.912–3.075) |
| DC ≤2.5 ms | 0.005 | 3.174 (1.426–7.065) | 0.013 | 2.212 (1.182–4.142) |
| Nonedited DFA α1 ≤0.42 | 0.004 | 3.055 (1.435–6.500) | 0.001 | 2.805 (1.504–5.232) |
| (B) Mortality | ||
|---|---|---|
| Mortality 3y | ||
| p‐value | HR (95% CI) | |
| VPB >10/hr | 0.611 | 1.322 (0.452–3.866) |
| Presence of fQRS | 0.012 | 13.409 (1.763–101.976) |
| TS ≤2.5 ms/RRI | 0.028 | 3.328 (1.137–9.737) |
| Edited DFA α1 ≤0.90 | 0.007 | 4.850 (1.539–15.284) |
For mortality, ROC analysis identified TS and edited DFA α1 as the parameters with the highest predictive value (Supporting information Supplement S3). TS was dichotomized as previously described at ≤2.5 ms/RRI, and 83 (38.2%) patients were classified as abnormal. Edited DFA α1 was dichotomized at ≤0.90, and 40 (23.3%) patients were considered abnormal. A total of 29 (13.2%) had both abnormal TS and Edited DFA α1 values. Both measures were significant predictors of mortality in univariate Cox regression analysis.
3.3. QRS fragmentation
fQRS was present in 115 (52.3%) patients, most frequently in the inferior region (34.1% of patients) followed by anterior (23.2%) and lateral (13.6%) regions. There was no significant difference between ICM and NICM patients for the presence of fQRS overall (54.7% vs. 48.9%, p = 0.398), nor for the regions separately. There was a significant association between the presence of fQRS overall and mortality in univariate Cox regression analysis, whereas AS was associated with the presence of fQRS in the inferior region.
3.4. Ventricular premature beats
A total of 133 (60.5%) patients had a VPB count >10/hr on 24‐hr holter recording, which was most prevalent in patients with NICM compared to ICM (69.6% vs. 53.9%, p = 0.019). A VPB count >10/hr was significantly associated with AS, but not with mortality in univariate Cox regression analysis.
3.5. Endpoint prediction
3.5.1. Appropriate shocks
The adjusted Cox regression models for prediction of AS are shown in Table 3 (Supporting information Supplement S4). For AS within 1 year follow‐up, all selected parameters were significant predictors when added to the baseline model. Combining fQRS in the inferior leads, abnormal nonedited DFA α1, and a high VPB count with the baseline model showed a clear trend for amelioration of the C‐statistics for AS at 1 year follow‐up, but not at 3 years follow‐up.
Table 3.
Adjusted Cox regression modeling and C‐statistics for AS
| AS within 1 year of follow‐up | ||||
|---|---|---|---|---|
| AS 1 year | Adjusted Cox regression | C‐statistics | ||
| p‐value | Hazard Ratio (95% CI) | C (95% CI) | p‐value versus baseline | |
| Baseline model | 0.701 (0.615–0.787) | |||
| Baseline model +VPB >10/hr | 0.010 | 3.705 (1.369–10.028) | 0.762 (0.668–0.856) | 0.174 |
| Baseline model +fQRS inferior | 0.079 | 2.009 (0.923–4.370) | 0.740 (0.646–0.834) | 0.275 |
| Baseline model +DC ≤2.5 ms | 0.007 | 3.060 (1.352–6.927) | 0.750 (0.654–0.846) | 0.228 |
| Baseline model +Nonedited DFA α1 ≤0.42 | 0.020 | 2.554 (1.162–5.615) | 0.775 (0.689–0.861) | 0.118 |
| Baseline model | 0.790 (0.704–0.876) | 0.076 | ||
| +VPB >10/hr | 0.162 | 2.178 (0.732–6.477) | ||
| +fQRS inferior | 0.032 | 2.429 (1.081–5.461) | ||
| +DC ≤2.5 ms | 0.039 | 2.567 (1.049–6.279) | ||
| Baseline model | 0.798 (0.716–0.880) | 0.055 | ||
| +VPB >10/hr | 0.086 | 2.530 (0.878–7.290) | ||
| +fQRS inferior | 0.246 | 1.623 (0.717–3.677) | ||
| +Nonedited DFA α1 ≤0.42 | 0.128 | 1.913 (0.829–4.416) | ||
| B. AS within 3 years of follow‐up | ||||
|---|---|---|---|---|
| AS 3 year | Adjusted Cox regression | C‐statistics | ||
| p‐value | Hazard Ratio (95% CI) | C (95% CI) | p‐value versus baseline | |
| Baseline model | 0.633 (0.543–0.723) | |||
| Baseline model +VPB >10/hr | 0.033 | 2.170 (1.063–4.428) | 0.666 (0.568–0.764) | 0.313 |
| Baseline model +fQRS inferior | 0.060 | 1.875 (0.974–3.609) | 0.653 (0.557–0.749) | 0.383 |
| Baseline model +DC ≤2.5 ms | 0.012 | 2.265 (1.193–4.302) | 0.671 (0.575–0.767) | 0.286 |
| Baseline model +Nonedited DFA α1 ≤0.42 | 0.004 | 2.578 (1.360–4.889) | 0.709 (0.619–0.799) | 0.121 |
| Baseline model | 0.704 (0.606–0.802) | 0.148 | ||
| +VPB >10/hr | 0.432 | 1.371 (0.624–3.014) | ||
| +fQRS inferior | 0.030 | 2.118 (1.073–4.180) | ||
| +DC ≤2.5 ms | 0.032 | 2.171 (1.071–4.400) | ||
| Baseline model | 0.711 (0.625–0.797) | 0.110 | ||
| +VPB >10/hr | 0.386 | 1.405 (0.651–3.033) | ||
| +fQRS inferior | 0.202 | 1.561 (0.788–3.094) | ||
| +Nonedited DFA α1 ≤0.42 | 0.019 | 2.264 (1.146–4.470) | ||
Kaplan–Meier analysis for AS according to the score assigned by the number of abnormal tests is shown in Figure 1a. In adjusted Cox regression analysis after 3 years follow‐up, each increase in score was associated with a 1.8 times increased risk of AS (HR 1.793, 95% CI 1.255–2.564).
Figure 1.
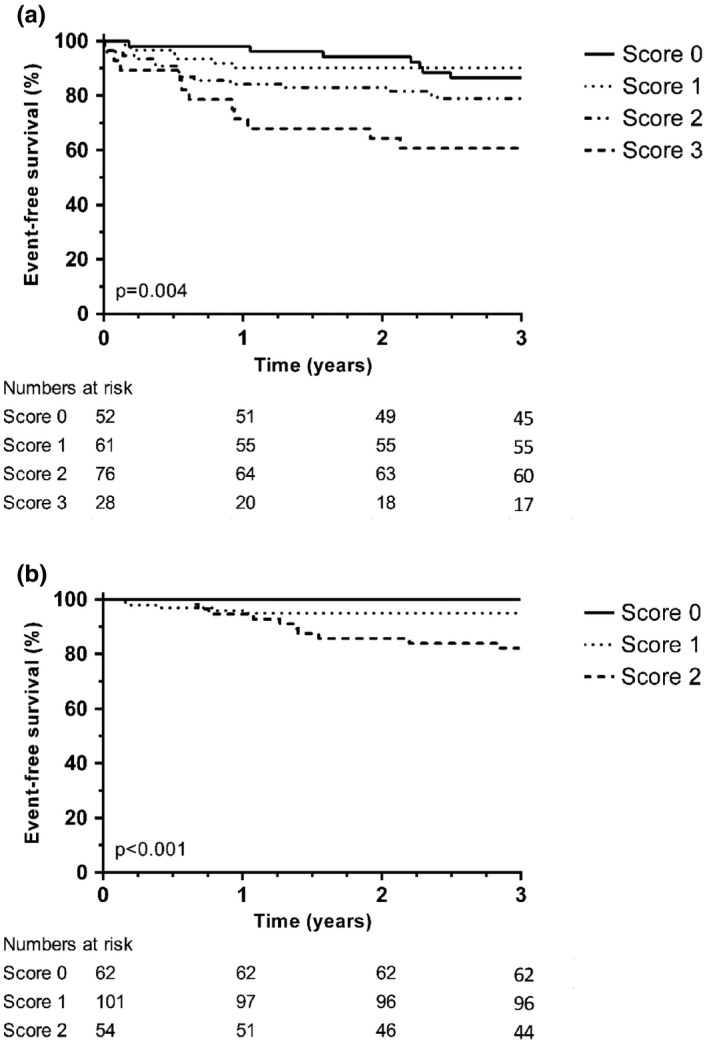
Kaplan–Meier analysis for the difference in endpoints according to the number of abnormal tests. (a) Appropriate shocks; (b) Mortality
3.5.2. Total mortality
In adjusted Cox regression analysis, the presence of fQRS in any region and abnormal autonomic function assessed by TS or edited DFA α1 were associated with mortality (Table 4, Supporting information Supplement S4). When combining these tests with the baseline model, the model including edited DFA α1 and fQRS in any region showed a significant increase in C‐statistics. Kaplan–Meier analysis for mortality according to the score assigned by the number of abnormal tests is shown in Figure 1b. Amongst patients with a score of 0, no deaths occurred, whereas each point increase in score was associated with a five times increased risk of dying (HR 5.069, 95% CI 1.978–12.994).
Table 4.
Adjusted Cox regression modeling and C‐statistics for mortality after 3 years of follow‐up
| Mortality 3 year | Adjusted Cox regression | C‐statistics | ||
|---|---|---|---|---|
| p‐value | Hazard Ratio (95% CI) | C (95% CI) | p‐value versus baseline | |
| Baseline model | 0.714 (0.545–0.883) | |||
| Baseline model +fQRS | 0.010 | 15.850 (1.933–129.958) | 0.832 (0.736–0.928) | 0.117 |
| Baseline model +TS ≤2.5 ms/RRI | 0.026 | 3.768 (1.174–12.092) | 0.779 (0.638–0.920) | 0.281 |
| Baseline model +Edited DFA α1 ≤0.90 | 0.020 | 5.088 (1.295–19.987) | 0.844 (0.742–0.946) | 0.098 |
| Baseline model | 0.872 (0.796–0.948) | 0.047 | ||
| +fQRS | 0.013 | 17.958 (1.837–175.527) | ||
| +TS ≤2.5 ms/RRI | 0.032 | 4.104 (1.127–14.940) | ||
| Baseline model | 0.901 (0.829–0.972) | 0.023 | ||
| +fQRS | 0.028 | 14.146 (1.332–150.229) | ||
| +Edited DFA α1 ≤0.90 | 0.037 | 4.679 (1.095–19.999) | ||
4. DISCUSSION
In this retrospective analysis, a combination of measures of autonomic tone, myocardial substrate, and myocardial vulnerability was shown to improve noninvasive risk stratification of appropriate ICD shocks, whereas an alternative model including autonomic tone and myocardial substrate was shown to improve prediction of mortality.
4.1. Selected parameters
Several measures of myocardial vulnerability have been extensively studied. VPBs are indispensable as trigger of ventricular arrhythmias (Ataklte, Erqou, Laukkanen, & Kaptoge, 2013). Patients with frequent VPBs, defined as ≥1 on a 10‐s ECG or ≥30 over a 1‐hr recording, were at a 2.64 (95% CI 1.93–3.63) times higher risk for SCD and a 2.07 (95% CI 1.71–2.50) times higher risk for cardiac mortality.
There are different methods available to assess the presence of myocardial damage, ranging from simple visual scoring of fQRS to complex mathematical approaches of T‐wave morphology (Zabel et al., 2000). The association between fQRS on a routine clinical ECG, SCD and total mortality has been shown in a recent meta‐analysis (Rosengarten, Scott, & Morgan, 2015). Further, regional presence of fQRS has been linked to discriminate AS (inferior region) and total mortality (anterior and lateral region) (Vandenberk et al., 2017). The latter could explain the different prognostic value of fQRS in the model for mortality and AS.
For autonomic function, parameters of the time‐ and frequency‐domain of HRV are simple mathematical expressions of RR‐interval variability, whereas other markers are correlated to a specific physiological background. HRT has been correlated to baroreflex sensitivity in which TO quantifies the amount of sinus acceleration after a VPB and TS the rate of deceleration after this acceleration. In a recent systematic review, HRT showed a consistent predictive value for cardiac death and arrhythmic events (Disertori, Mase, Rigoni, Nollo, & Ravelli, 2016). However, TS has shown superiority over TO to predict total and heart failure‐related mortality (Cygankiewicz et al., 2008). DC can be interpreted as a global measure of heart rate deceleration as it is an integral measure of all deceleration‐related periodic components of the heart rate over a 24‐hr period (Bauer et al., 2009). DC has been shown to be an independent predictor of both SCD and total mortality (Arsenos et al., 2016). However, as ventricular arrhythmias can be considered a coincidence of circumstances, we hypothesize that a global measure of autonomic function, as DC, could yield a higher predictive value than a rather specific measure related to VPBs, as HRT. DFA reflects the fractal correlation properties of heart rate dynamics and is determined by the delicate interplay between sympathetic and vagal activity (Tulppo et al., 2005). The observed difference in prognostic power between edited and unedited DFA values may be one of its strengths. In the SCD‐HeFT population, unedited DFA showed a strong predictive value for ventricular arrhythmia and was shown to be more predictive than traditional HRV parameters (Au‐Yeung et al., 2015).
4.2. Combination of risk factors
In 1991, it was described that combining LVEF with HRV, signal‐averaged ECG, VPB count, and resting heart rate significantly improved risk stratification of ventricular arrhythmias in ICM patients when compared to LVEF alone (Odemuyiwa et al., 1991). In the ABCD trial, noninvasive risk stratification by combining LVEF with microvolt T‐wave alternans (MTWA) was shown to be noninferior to invasive risk stratification with an electrophysiological study (Costantini et al., 2009). Further, MTWA and invasive electrophysiological study were complementary and further improved risk stratification. The REFINE study assessed a battery of tests including baroreceptor sensitivity, signal‐averaged ECG, HRV, HRT, and MTWA (Exner et al., 2007). In patients post myocardial infarction with a LVEF <50%, a combination of MTWA and HRT, hence combining myocardial damage, vulnerability, and abnormal autonomic function, respectively, improved prediction of cardiac mortality and resuscitated cardiac arrest. In a SCD‐HeFT substudy, combining DFA and number of PVBs/hr was amongst the best models to predict ventricular arrhythmias and SCD (Au‐Yeung et al., 2015).
4.3. Clinical value and future perspectives
The ultimate goal of noninvasive risk stratification is to identify patients at high risk of SCD which can benefit from an ICD implant, minimizing futile ICD implants. Further, patients at increased risk could benefit from increased vigilance, lifestyle modification, physical rehabilitation to improve their autonomic function, pursuing optimal medical therapy or an upgrade to CRT therapy. A first clinical lesson is that with current noninvasive risk stratification strategies mortality is better predicted than ventricular arrhythmias, as reflected by the C‐statistics. Second, the C‐statistics for AS were clearly higher after 1 year when compared to 3 years. This can be explained by at least two reasons. Tests for autonomic function and myocardial vulnerability are influenced by drugs as beta‐blockers and angiotensin converting enzyme inhibitors, and little is known about the evolution of the substrate (Bauer et al., 2009). Further, it remains unclear whether repeated testing can improve risk stratification. Current methods provide a risk estimation at a single time point, whereas the risk of SCD is a continuous and fluctuating risk. The optimal interval between two tests has not been studied before, but as the predictive value of our model decreased after 1 year of follow‐up this could be a first time point to repeat noninvasive testing. Large prospective studies assessing all possible parameters are needed to proceed to a universal model improving risk stratification.
To identify and predict the future electrical risk with discrimination of the competing risk on mortality, a prospective multicenter study is needed. Besides a combination of noninvasive risk stratification test, evaluation of the autonomic nervous system, genetics, and myocardial imaging should be included.
5. LIMITATIONS
The main limitations of our study are its retrospective design and limited sample size. The mechanisms leading to arrhythmia and death might differ between ICM and NICM; however, the key players resulting in sudden cardiac death remain the same. Subgroup analysis was not deemed reliable and hence not performed. Instead, we adjusted the analysis for major clinical differences such as the underlying cardiomyopathy and the ICD indication. Similarly, the arrhythmic substrate of ventricular tachycardia and ventricular fibrillation is different but numbers were too low to perform reliable subgroup analysis. Previously described cutoff values for noninvasive risk stratification tests were used when available. However, for nonedited DFA α1, no cutoff value in a comparable population studying ventricular arrhythmia has been published before and a population‐specific cutoff was determined based on ROC analysis. Several noninvasive risk stratification tests, for example further information on VPB timing and morphology, were not included in the analysis as these were not available but could be of major interest in further studies. Besides electrocardiographic analysis, imaging techniques have evolved and are being studied for noninvasive risk stratification purposes.
6. CONCLUSION
Noninvasive risk stratification of SCD remains challenging, and current risk stratification tests should be combined in order to optimize their potential. Combining parameters reflecting autonomic function, myocardial substrate, and vulnerability may ameliorate the current approach. HRT, DC, fQRS, and DFA yielded the highest potential in our study.
CONFLICT OF INTERESTS
RW/JE/CG research funding: Biotronik, Boston Scientific, Medtronic. Speakers and consultancy fees: Medtronic, Boston Scientific, Biotronik, St Jude Medical, Sorin. RW/JE are supported as postdoctoral clinical researcher and CG as predoctoral clinical researcher by the Fund for Scientific Research Flanders. This work was supported by the European Community's Seventh Framework Program FP7: EU‐CERT‐ICD (grant agreement no. HEALTH‐F2‐2013‐602299).
Supporting information
Vandenberk B, Junttila MJ, Robyns T, et al. Combining noninvasive risk stratification parameters improves the prediction of mortality and appropriate ICD shocks. Ann Noninvasive Electrocardiol. 2019;24:e12604 10.1111/anec.12604
REFERENCES
- Arsenos, P. , Manis, G. , Gatzoulis, K. A. , Dilaveris, P. , Gialernios, T. , Angelis, A. , Tousoulis, D. (2016). Deceleration capacity of heart rate predicts arrhythmic and total mortality in heart failure patients. Annals of Noninvasive Electrocardiology, 21(5), 508–518. 10.1111/anec.12343 [DOI] [PMC free article] [PubMed] [Google Scholar]
- Ataklte, F. , Erqou, S. , Laukkanen, J. , & Kaptoge, S. (2013). Meta‐analysis of ventricular premature complexes and their relation to cardiac mortality in general populations. American Journal of Cardiology, 112(8), 1263–1270. 10.1016/j.amjcard.2013.05.065 [DOI] [PubMed] [Google Scholar]
- Au‐Yeung, W. T. , Reinhall, P. G. , Poole, J. E. , Anderson, J. , Johnson, G. , Fletcher, R. D. , Bardy, G. H. (2015). SCD‐HeFT: Use of R‐R interval statistics for long‐term risk stratification for arrhythmic sudden cardiac death. Heart Rhythm: the Official Journal of the Heart Rhythm Society, 12(10), 2058–2066. 10.1016/j.hrthm.2015.06.030 [DOI] [PMC free article] [PubMed] [Google Scholar]
- Bauer, A. , Barthel, P. , Muller, A. , Ulm, K. , Huikuri, H. , Malik, M. , & Schmidt, G. (2009). Risk prediction by heart rate turbulence and deceleration capacity in postinfarction patients with preserved left ventricular function retrospective analysis of 4 independent trials. Journal of Electrocardiology, 42(6), 597–601. 10.1016/j.jelectrocard.2009.07.013 [DOI] [PubMed] [Google Scholar]
- Costantini, O. , Hohnloser, S. H. , Kirk, M. M. , Lerman, B. B. , Baker, J. H. 2nd , Sethuraman, B. , Investigators, A. T. (2009). The ABCD (Alternans Before Cardioverter Defibrillator) Trial: Strategies using T‐wave alternans to improve efficiency of sudden cardiac death prevention. Journal of the American College of Cardiology, 53(6), 471–479. 10.1016/j.jacc.2008.08.077 [DOI] [PubMed] [Google Scholar]
- Cygankiewicz, I. , Zareba, W. , Vazquez, R. , Vallverdu, M. , Gonzalez‐Juanatey, J. R. , Valdes, M. , … de Luna, A. B. (2008). Heart rate turbulence predicts all‐cause mortality and sudden death in congestive heart failure patients. Heart Rhythm: the Official Journal of the Heart Rhythm Society, 5(8), 1095–1102. 10.1016/j.hrthm.2008.04.017 [DOI] [PubMed] [Google Scholar]
- Das, M. K. , Khan, B. , Jacob, S. , Kumar, A. , & Mahenthiran, J. (2006). Significance of a fragmented QRS complex versus a Q wave in patients with coronary artery disease. Circulation, 113(21), 2495–2501. 10.1161/CIRCULATIONAHA.105.595892 [DOI] [PubMed] [Google Scholar]
- Das, M. K. , Suradi, H. , Maskoun, W. , Michael, M. A. , Shen, C. , Peng, J. , Mahenthiran, J. (2008). Fragmented wide QRS on a 12‐lead ECG: A sign of myocardial scar and poor prognosis. Circ Arrhythm Electrophysiol, 1(4), 258–268. 10.1161/CIRCEP.107.763284 [DOI] [PubMed] [Google Scholar]
- Deyell, M. W. , Krahn, A. D. , & Goldberger, J. J. (2015). Sudden cardiac death risk stratification. Circulation Research, 116(12), 1907–1918. 10.1161/CIRCRESAHA.116.304493 [DOI] [PMC free article] [PubMed] [Google Scholar]
- Disertori, M. , Mase, M. , Rigoni, M. , Nollo, G. , & Ravelli, F. (2016). Heart rate turbulence is a powerful predictor of cardiac death and ventricular arrhythmias in postmyocardial infarction and heart failure patients: A systematic review and meta‐analysis. Circulation: Arrhythmia and Electrophysiology, 9(12), 10.1161/CIRCEP.116.004610 [DOI] [PubMed] [Google Scholar]
- Exner, D. (2009). Noninvasive risk stratification after myocardial infarction: Rationale, current evidence and the need for definitive trials. Canadian Journal of Cardiology, 25, 21A–27A. 10.1016/S0828-282X(09)71050-5 [DOI] [PMC free article] [PubMed] [Google Scholar]
- Exner, D. V. , Kavanagh, K. M. , Slawnych, M. P. , Mitchell, L. B. , Ramadan, D. , Aggarwal, S. G. , Investigators, R. (2007). Noninvasive risk assessment early after a myocardial infarction the REFINE study. Journal of the American College of Cardiology, 50(24), 2275–2284. 10.1016/j.jacc.2007.08.042 [DOI] [PubMed] [Google Scholar]
- Goldberger, J. J. , Buxton, A. E. , Cain, M. , Costantini, O. , Exner, D. V. , Knight, B. P. , Zipes, D. P. (2011). Risk stratification for arrhythmic sudden cardiac death: Identifying the roadblocks. Circulation, 123(21), 2423–2430. 10.1161/CIRCULATIONAHA.110.95973 [DOI] [PubMed] [Google Scholar]
- Moss, A. J. , Zareba, W. , Hall, W. J. , Klein, H. , Wilber, D. J. , Cannom, D. S. , … Andrews, M. L. (2002). Prophylactic implantation of a defibrillator in patients with myocardial infarction and reduced ejection fraction. New England Journal of Medicine, 346(12), 877–883. 10.1056/NEJMoa013474 [DOI] [PubMed] [Google Scholar]
- Odemuyiwa, O. , Malik, M. , Farrell, T. , Bashir, Y. , Staunton, A. , Poloniecki, J. , & Camm, A. J. (1991). Multifactorial prediction of arrhythmic events after myocardial infarction. Combination of heart rate variability and left ventricular ejection fraction with other variables. Pacing and Clinical Electrophysiology, 14(11 Pt 2), 1986–1991. [DOI] [PubMed] [Google Scholar]
- Rosengarten, J. A. , Scott, P. A. , & Morgan, J. M. (2015). Fragmented QRS for the prediction of sudden cardiac death: A meta‐analysis. Europace, 17(6), 969–977. 10.1093/europace/euu279 [DOI] [PubMed] [Google Scholar]
- Tulppo, M. P. , Kiviniemi, A. M. , Hautala, A. J. , Kallio, M. , Seppanen, T. , Makikallio, T. H. , & Huikuri, H. V. (2005). Physiological background of the loss of fractal heart rate dynamics. Circulation, 112(3), 314–319. 10.1161/CIRCULATIONAHA.104.523712 [DOI] [PubMed] [Google Scholar]
- Vandenberk, B. , Garweg, C. , Voros, G. , Flore, V. , Marynissen, T. , Sticherling, C. , Willems, R. (2016). Changes in implantation patterns and therapy rates of implantable cardioverter defibrillators over time in ischemic and dilated cardiomyopathy patients. Pacing and Clinical Electrophysiology, 39(8), 848–857. 10.1111/pace.12891 [DOI] [PubMed] [Google Scholar]
- Vandenberk, B. , Robyns, T. , Goovaerts, G. , Van Soest, S. , Floré, V. , Garweg, C. , … Willems, R. (2017). Inferior and anterior QRS fragmentation have different prognostic value in patients who received an implantable defibrillator in primary prevention of sudden cardiac death. International Journal of Cardiology, 243, 223–228. 10.1016/j.ijcard.2017.02.131 [DOI] [PubMed] [Google Scholar]
- Zabel, M. , Acar, B. , Klingenheben, T. , Franz, M. R. , Hohnloser, S. H. , & Malik, M. (2000). Analysis of 12‐lead T‐wave morphology for risk stratification after myocardial infarction. Circulation, 102(11), 1252–1257. 10.1161/01.CIR.102.11.1252 [DOI] [PubMed] [Google Scholar]
Associated Data
This section collects any data citations, data availability statements, or supplementary materials included in this article.
Supplementary Materials