

Abstract
Background
Regular exercise promotes functional and structural changes in the central and peripheral mechanisms of the cardiovascular system. Heart rate variability (HRV) measurement provides a sensitive indicator of the autonomic balance. However, because of the diversity of methods and variables used, the results are difficult to compare in the sports sciences. Since the protocol (supine, sitting, or standing position) and measure (time or frequency domain) are not well defined, the aim of this study is to investigate the HRV measures that better indicates the chronic adaptations of physical exercise in athletes.
Method
PubMed (MEDLINE), Web of Science, SciELO (Scientific Electronic Library), and Scopus databases were consulted. Original complete articles in English with short‐term signals evaluating young and adult athletes, between 17 and 40 years old, with a control group, published up to 2013 were included.
Results
Selected 19 of 1369 studies, for a total sample pool of 333 male and female athletes who practice different sports. The main protocols observed were the supine or standing positions in free or controlled breathing conditions. The main statistical results found in this study were the higher mean RR, standard deviation of RR intervals, and high frequency in athletes group. In addition, the analyses of Cohen's effect size showed that factors as modality of sport, protocol used and unit of measure selected could influence this expected results.
Conclusion
Our findings indicate that time domain measures are more consistent than frequency domain to describe the chronic cardiovascular autonomic adaptations in athletes.
Keywords: electrocardiogram, sports, physical exercises, autonomic nervous system, resistance training
Regular exercise promotes functional and structural changes in the central and peripheral mechanisms of the cardiovascular system.1, 2 The resting bradycardia observed in athletes is a marker of the effect of exercise training,3 that is related to cardiac autonomic and nonautonomic adaptations.4 The autonomic sympathovagal balance in athletes is characterized by the predominance of parasympathetic activity on sympathetic activity.5
The cardiac autonomic control can be assessed by monitoring the heart rate variability (HRV), a noninvasive technique used to evaluate the instantaneous variation of the intervals between R waves (RR interval) of the electrocardiogram.6, 7, 8 The changes in the HRV indices indicate the ability of the autonomic nervous system to respond to multiple physiological and environmental stimuli, such as breathing, physical exercise, mental stress, hemodynamic and metabolic changes, and sleep and posture changes, as well as compensating for disorders resulting from illness.9, 10 Factors such as fitness level, experience, intensity, training schedule, and the athlete's daily routine can influence physiological and emotional aspects related to changes in the autonomic responses during training, and consequently the HRV indices.4
The number of publications about HRV related to training or physical exercise is increasing. In sports, the HRV is supposed to be used as a tool for adjustment of the training load, diagnosis and prevention of tiredness, evaluation of overtraining and aerobic capacity, and characterized by emotional aspects such as anxiety and precompetitive stress.11, 12, 13, 14 However, because of the diversity of protocols and variables used, the results are not consistent and are difficult to compare in the sports sciences.4 Although the HRV measurement is a potential method for better understanding the regulation and control of the cardiovascular system,4 it remains unclear if it could be used as a predictor of athletic condition.
The high frequency (HF) band is a marker of vagal activity. Aubert et al.4 showed that athletes have higher HF component than the sedentary control group. However, the time domain measures seems to be better than frequency domain to describe the autonomic adaptations of chronic physical training.15 Sandercock et al.15 observed that in physical training interventions longer than 12 weeks the effect size (ES) change in RR interval was greater than that for HF.
In spite of the recommended use of long‐ and short‐term HRV recordings, 7 there are few data using long‐term record in sport. The two studies presented in Aubert et al.4 showed controversial results.16, 17 This systematic review selected cross‐transversal studies using short‐term HRV, due to the short‐term records tend to give more significant results than the long‐term ones.15
Considering HRV as a useful tool in sports medicine to monitor the individual athlete achievements, it is fundamental to determine the advisable protocol and more sound measure. Since the protocol (supine, sitting, or standing position) and measure (time or frequency domain) are not well defined, the aim of this study is to investigate the HRV measure that better indicates the chronic adaptations to physical training in athletes.
METHODS
Information Sources
The following databases were used for the search: PubMed (MEDLINE), Web of Science, SciELO (Scientific Electronic Library), and Scopus. Studies published up to 2013 were included.
Search
The search was performed according to the strategies suggested by the MEDLINE database, using a combination of the following keywords: “autonomic control AND sports”; “autonomic control AND athletes”; “HRV AND sports”; “HRV AND athletes.” The details of the search were: (“autonomic nervous system”[MeSH Terms]) OR (“autonomic” [All Fields] AND “nervous”[All Fields] AND “system”[All Fields]) OR “autonomic nervous system”[All Fields] OR “autonomic”[All Fields]) AND (“prevention and control” [Subheading] OR (“prevention” [All Fields] AND “control” [All Fields]) OR “prevention and control” [All Fields] OR “control” [All Fields] OR “control groups” [MeSH Terms] OR (“control” [All Fields] AND “groups” [All Fields]) OR “control groups”[All Fields]) AND (“sports”[MeSH Terms] OR “sports” [All Fields]) AND (“heart rate [HR]”[MeSH Terms] OR (“heart”[All Fields] AND “rate” [All Fields]) OR “HR” [All Fields]) AND variability [All Fields] AND (“athletes”[MeSH Terms] OR “athletes” [All Fields]) AND (“humans”[MeSH Terms] AND English[lang]).
The guidelines of Prisma were adopted to develop the systematic review. 18 The search was performed by two evaluators independently. A third evaluator was requested for diverging cases.
Study Selection
Complete original articles in English that evaluated young and adult athletes between 17 and 40 years old, with a sedentary control group were included. Studies that included variables for short‐term recording in the time and frequency domains were selected: the mean of RR intervals (mean RR), standard deviation of RR intervals (SDRR), root mean square deviations of RR intervals, frequency bands of the spectral analysis Very Low Frequency, Low Frequency (LF), and HF, as well as the LF/HF ratio. Studies in elders or adolescents with a combination of physical exercise and pharmaceutical intervention, long‐term analysis, illness, overtraining, experiments with high altitude or diving, para‐athletes, and review studies were excluded.
Data Collection Process
The following criteria were analyzed for the sample selection: age group, sex, type of sport, experience, training routine, fitness level, physiological characteristics (anaerobic threshold, maximum oxygen uptakeand HR). The procedures and methods used to analyze the HRV included: time, fitness (free or controlled breathing), position (standing, sitting, or lying down), recording time, interval time, sampling frequency, heartbeat, the technique used for spectral analysis and the variables (in the time and frequency domains).
Statistical Analyses
The Cohen's d ES calculation was performed to offer more robust information regarding the studies included in the present analysis. The formula applied on the data was:
in which and are the mean HRV of the athletes and nonathletes, respectively, and s is the pooled standard deviation.
The HRV data were provided by articles3, 19, 20, 21, 22, 23, 24, 25, 26, 27, 28 or by e‐mail29, 30, 31 through contact with the authors. Missing values are due to graphic representations in the articles and mismatched data received by e‐mail.32, 33, 34, 35, 36, 37 According to Cohen's d, the ES is used as a parameter based on the magnitude of the statistical effect (small 0.2 < d < 0.3; moderate 0.5 < d < 0.8; large d ≥ 0.8).38
RESULTS
The search found 1369 nonduplicate titles. The great majority, 1345 publications, were excluded based on their titles and abstracts, leaving 24 relevant studies for this review. Five additional studies were excluded because they used younger subjects than the cutoff age for this study, were not the original complete article, or did not use the traditional HRV measurement. For this review, 19 complete articles were selected based on the inclusion criteria. Figure 1 describes the selection process for the studies included.
Figure 1.
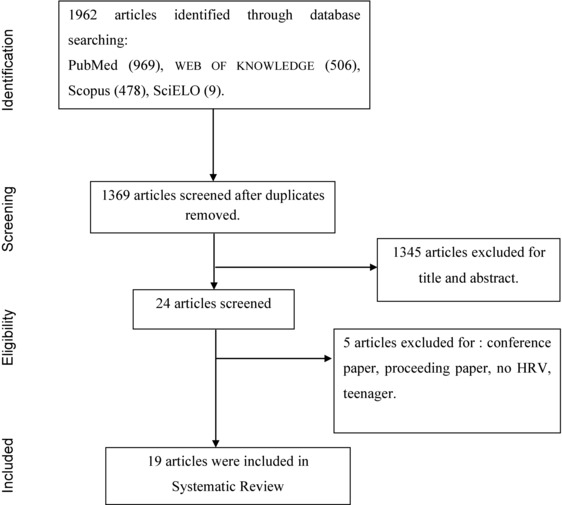
Flow chart of search and selection for the articles included in the Systematic Review.
The descriptive analyses of the studies are summarized in Table 1.3, 19, 20, 21, 23, 24, 25, 26, 27, 28, 29, 30, 31, 32, 33, 34, 35, 36, 37
Table 1.
Descriptive Results in Athletes and Nonathletes
| Domain | Main Results | ||||||
|---|---|---|---|---|---|---|---|
| Author | Age | Group | Time | Frequency | Protocol | Time | Frequency |
| Dixon et al. | Ath: 28.4 (3.5) Con: 27.4 (2.6) | Athletes × Control | HF; LF (beats/minutes)2; LF/HF | SPN; STD; FB | >HFc | ||
| Janssen et al. | Ath: 24 (19–32)g Con: 27 (23–33)g | Athletes × Control | meanRR (ms); SDRR (ms) | LF (n.u) | SPN; STD; FB | >meanRRc,d | < LFc |
| Puig et al. | Ath: 23.4 (5.5) Con: 24.3 (7.6) | Athletes × Control | meanRR (ms); SDRR (ms) | LF; HF (ms2 and percentage); LF/HF | SPN; CB | > LF > HF | |
| Sacknoff et al. | Ath: 26 (1.6) Con: 30 (0.3) | Athletes × Control | meanRR (ms); SDRR (ms) | Log (LF); Log (HF) | SPN; FB | >SDRR | < HF < LF |
| Shin et al. | Ath: 18 (2) Con: 27 (7) | Athletes × Control | LF; HF (n.u); LF/HF | SPN; FB | |||
| Shin et al. | Ath: 21.5 (1.2) Con: 22.13 (2.03) | Athletes × Control | LF; HF (n.u) | SPN; CB | < LF > HF | ||
| Aubert et al. | Ath: 23.2 (2.5) Con: 23.1 (2.8) | Athletes × Control | SDRR (ms) | SPN; CB | >SDRR | ||
| Macor et al. | Ath: 27 (7) Con: 25 (4) | Athletes × Control | HF; LF (ms2, percentage and n.u); LF/HF | SPN; FB | > HF | ||
| Shin et al. | Ath: 21.53 (1.25) Con: 22.13 (2.03) | Athletes × Control | LF; HF(n.u) | SPN; FB | > HF | ||
| Aubert et al. | Ath: 18–34g Con: 18–34g | Aerobic Ath × Control Anaer Ath × Control Rugby Ath × Control | meanRR (ms); SDRR (ms); RMSSD (ms) | LF; HF (ms2); LF/HF | SPN; STD; FB | > meanRRe,c > SDRRe,c > RMSSDe,c > meanRRe,d > RMSSDe,d | > LFe,c,d > HFe,c,d > LF/HFf,c |
| Aubert et al. | Ath: 18–34g Con: 18–34g | Aerobic Ath × Control Anaer Ath × Control Rugby Ath × Control | LF; HF (ms2); LF/HF | SPN; FB | > LF | ||
| Middleton and De Vito | Ath: 22.4 (3.2) Con: 21.0 (1) | Athletes × Control | meanRR (ms); SDRR (ms) | LF; HF (n.u) | SPN; FB; CB | > meanRRa | > LF(n.u)b > LF/HFb |
| Martinelli et al. | Ath: 20.8(3.3) Con: 21.82(2.18) | Athletes × Control | SDRR (ms); meanRR (ms) | LF; HF (n.u); LF/HF | SPN; FB | > meanRR > SDRR | |
| Kawaguchi et al. | Ath: 20–35g Con:20—35g | Athletes × Control | meanRR (ms) | SPN; FB | |||
| Marocolo et al. | Ath: 25(6) Con: 28.5(5.2) | Athletes × Control | meanRR (ms); RMSSD (ms) | SPN; FB | > meanRR > RMSDRR | ||
| Chinea et al. | Ath: 18–32g Con: 18–32g | Athletes × Control | meanRR (ms); SDRR (ms); RMSSD (ms) | LF; HF (ms2) | SPN; FB | > meanRR | > LF |
| Toufan et al. | Ath: 27.8 (10.6) Con: 27.8 (10.6) | Athletes × Control | SDRR (ms); RMSSD (ms) | VLF; LF; HF (ms2) | SPN; FB | ns | |
| Lakin et al. | Ath: 23 (1) Con: 23 (1) | Athletes × Control | ΔmeanRR; ΔSDRR | ΔLF (n.u); ΔHF (n.u); ΔLF/HF | SPN; FB | ns | |
| Molina et al. | Ath: 26 (24, 31)h Con: 25 (5.2)h | Athletes × Control | meanRR (ms); SDRR (ms); RMSSD (ms) | LF (ms2); HF (ms2); LF (n.u); HF (n.u); LF/HF | SPN; STD; FB | >meanRRc,d | |
afree breathing;bcontrolled breathing; csupine position; dstanding position.eaerobic athletes; frugby athletes; gMinimum‐Maximum; hmedian(25, 75 percentile); (>)larger in athletes; (<)smaller in athletes; (ns)no significance difference between groups; Ath: athletes; Con: control; Anaer: Anaerobic. meanRR: mean of RR interval; SDRR: standard deviation of mean RR interval; RMSSD: root mean squared standard deviation; VLF: power in very low frequency; LF: power in low frequency; HF: power in high frequency; LF/HF: ratio between low and high power frequency; Log(LF): power in low frequency in logarithmic scale; Log(HF): power in high frequency in logarithmic scale; ΔmeanRR: variation of mean of RR interval; ΔSDRR: variation of standard deviation of mean RR interval; ΔLF: low power frequency variation; ΔHF: high power frequency variation; ΔLF/HF: variation of ratio between low and high power frequency; SPN: supine position; STD: standing position; FB: free breathing; CB: controlled breathing; ms: miliseconds; n.u: normalized units.
The total number of athletes was about 333 males and females, aged between 17 and 40 years, who practiced different sports (running, cycling, swimming, canoeing, athletics, skating, volleyball, football, basketball, rugby, and triathlon). For the sample characterization, seven studies used the VO2 as a physiological measure20, 23, 26, 30, 31, 35, 37, seven studies reported the length of time that the athletes had practiced the sport (over 2 years),3, 20, 21, 23, 25, 26, 37 and eight studies selected athletes participating in national, regional, or international competitions.23, 25, 27, 29, 31, 34, 35, 37 No study reported the athlete's training phase during the course of the experiment. Of the studies with female subjects, only one reported the phase of menstrual cycle of the subjects.37
Of the studies that reported preevaluation recommendations, eight requested the participants to avoid exercising before the day of the experiment, for periods of 12–48 h before the experiment.23, 26, 28, 31, 34, 35, 36, 37 The schedules for the evaluations varied from 08:00 to 12:00 in the morning, and from 13:00 to 16:00 in the afternoon.3, 20, 23, 28, 30, 31, 33, 34 Breathing control was used in three studies19, 20, 24 and only one of them used free and controlled breathing.26 The recording time varied from 2 to 15 minutes.
Analyses in the time domain were performed in 13 studies. The main variables used were the mean RR and the SDRR. The main techniques of spectral analysis were the periodogram and the autoregressive model. The LF and HF were assessed in 16 studies; however the selected frequency bands varied among the studies. For LF the minimum varied from 0.02 to 0.07 Hz and the maximum from 0.14 to 0.15 Hz. In addition, the limits of the HF remained from 0.14 and 0.15 Hz to 0.4 and 0.8 Hz. In spite of the diverse methods applied the main statistical results found in literature were the higher mean RR, SDRR, and HF in athlete's group (Table 1).
The provided mean and standard deviation values from 14 articles were included in the quantitative analyses of the Cohen's ES,3, 19, 20, 21, 22, 23, 24, 25, 26, 27, 28, 29, 30, 31 whose large and moderate values were showed in time (Table 2) and frequency domain (Table 3).
Table 2.
Cohen's d Effect Size of Time Domain Measures
| Athletes | Control | ||||||
|---|---|---|---|---|---|---|---|
| Measure | Author | Protocol | N | Mean (SD) | N | Mean (SD) | Cohen's d Effect Size |
| MeanRR (ms) | Puig et al. | SPN; CB | 33 | 989.7 (168.8) | 33 | 762.7 (125.3) | 1.52 |
| Aubert et al. (aerobic athletes) | SPN; FB | 10 | 947.7 (108.8) | 10 | 749.7 (165.6) | 1.41 | |
| Middleton and De Vito | SPN; FB | 9 | 1089.1 (113.7) | 9 | 865 (100.3) | 2.09 | |
| Kawaguchi et al. | SPN; FB | 10 | 1189.18 (6.9) | 10 | 826.58 (5.3) | 58.93 | |
| Marocolo et al. | SPN; FB | 18 | 1351 (241) | 18 | 1034 (160) | 1.54 | |
| Molina et al. | SPN; FB | 12 | 1176.2 (131.6) | 11 | 996 (155.5) | 1.25 | |
| STD; FB | 12 | 900 (157.9) | 11 | 761.2 (104.3) | 1.03 | ||
| SDRR (ms) | Puig et al. | SPN; CB | 33 | 70.2 (22.4) | 33 | 57.6 (22.4) | 0.56 |
| Aubert et al. (18–34) | SPN; CB | 14 | 91 (22) | 14 | 62 (15) | 1.5 | |
| Aubert et al (aerobic athletes) | SPN; FB | 10 | 97.9 (15.7) | 10 | 69.7 (37) | 0.99 | |
| STD; FB | 10 | 92.9 (30.9) | 10 | 65.4 (38.9) | 0.78 | ||
| Aubert et al. (rugby athletes) | SPN; FB | 7 | 55.0 (24.2) | 10 | 69.7 (37) | ‐0.47 | |
| Aubert et al. (anaerobic athletes) | STD; FB | 7 | 50.4 (8.8) | 10 | 65.4 (38.9) | ‐0.53 | |
| Middleton and De Vito | SPN; FB | 9 | 120.4 (39.6) | 9 | 98.6 (30.3) | 0.61 | |
| RMSSD (ms) | Aubert et al. (aerobic athletes) | SPN; FB | 10 | 73.5 (23.7) | 10 | 45.5 (26.8) | 1.10 |
| STD; FB | 10 | 47.2 (11.1) | 10 | 30.6 (16.9) | 1.16 | ||
| Marocolo et al. | SPN; FB | 18 | 74.10 (36.6) | 18 | 39.70 (16.0) | 1.21 | |
| Toufan et al. (dynamic athletes) | SPN; FB | 30 | 65.79 (40.51) | 50 | 46.88 (31.24) | 0.52 | |
| Molina et al. | STD; FB | 12 | 36.5 (19.3) | 11 | 29 (12.2) | 0.46 | |
meanRR: mean of RR interval; SDRR: standard deviation of mean RR interval; RMSSD: root mean squared standard deviation; SPN: supine position; STD: standing position; FB: free breathing; CB: controlled breathing; effect size 0.4 < d < 0.8 (moderate), d > 0.8 (large).
Table 3.
Cohen's d Effect Size of Frequency Domain Measures
| Athletes | Control | |||||||
|---|---|---|---|---|---|---|---|---|
| Measure | Unit | Author | Protocol | N | Mean (SD) | N | Mean (SD) | Cohen's d Effect Size |
| LF | (beats/minutes)2 | Dixon et al. | SPN; FB | 10 | 53.6 (9.9) | 14 | 69.6 (19.5) | ‐1.03 |
| STD; FB | 10 | 94.7 (19.3) | 14 | 82.9 (17.6) | 0.63 | |||
| ms2 | Puig et al. | SPN; CB | 33 | 925 (920) | 33 | 442 (446) | 0.66 | |
| n.u | Shin et al. | SPN; FB | 5 | 15.0 (1.2) | 8 | 16.8 (2.5) | ‐0.91 | |
| Shin et al. | SPN; CB | 15 | 14.31 (14.89) | 15 | 27.22 (13.34) | ‐0.91 | ||
| Shin et al. | SPN; FB | 15 | 17.44 (8.48) | 15 | 26.03 (15.53) | ‐0.68 | ||
| Middleton and De Vito | SPN; CB | 9 | 44.2 (8.5) | 9 | 29.5 (6.8) | 1.9 | ||
| Ln (ms2) | Aubert et al. (aerobic athletes) | SPN; FB | 10 | 7.73 (0.49) | 10 | 6.88 (0.6) | 1.55 | |
| STD; FB | 10 | 7.78 (0.65) | 10 | 7.03 (0.86) | 0.98 | |||
| Aubert et al. (aerobic athletes) | SPN; FB | 10 | 7.73 (0.49) | 10 | 6.88 (0.6) | 1.55 | ||
| Middleton and De Vito | SPN; FB | 9 | 3.5 (0.33) | 9 | 3.2 (0.3) | 0.95 | ||
| SPN; CB | 9 | 3.2 (0.4) | 9 | 2.96 (0.33) | 0.65 | |||
| HF | (beats/minutes)2 | Dixon et al. | SPN; FB | 10 | 62.2 (10.7) | 14 | 43.7 (22.4) | 1.05 |
| ms2 | Puig et al. | SPN; CB | 33 | 2258(2349) | 33 | 1179 (1542) | 0.54 | |
| n.u | Shin et al. | SPN; FB | 5 | 15.3 (3.9) | 8 | 10.5 (2.1) | 1.53 | |
| Shin et al. | SPN; CB | 15 | 65.48 (10.85) | 15 | 39.41 (11.77) | 2.3 | ||
| Shin et al. | SPN; FB | 15 | 67.36 (15.72) | 15 | 42.26 (13.50) | 1.73 | ||
| Middleton and De Vito | SPN; CB | 9 | 55.8 (8.5) | 9 | 69.9 (7.7) | ‐1.73 | ||
| Molina et al. | SPN; FB | 12 | 0.19 (0.13) | 11 | 0.14 (0.05) | 0.50 | ||
| Ln (ms2) | Aubert et al. (aerobic athletes) | SPN; FB | 10 | 7.08 (0.68) | 10 | 6.18 (1.01) | 1.04 | |
| STD; FB | 10 | 6.35 (0.49) | 10 | 5.54 (0.92) | 1.09 | |||
| Aubert et al. (rugby athletes) | SPN; FB | 7 | 5.38 (1.63) | 10 | 6.18 (1.01) | ‐0.59 | ||
| Aubert et al. (aerobic athletes) | SPN; FB | 10 | 7.08 (0.68) | 10 | 6.18 (1.01) | 1.04 | ||
| Aubert et al. (rugby athletes) | SPN; FB | 7 | 5.38 (1.63) | 10 | 6.18 (1.01) | ‐0.59 | ||
| Middleton and De Vito | SPN; FB | 9 | 3.5 (0.36) | 9 | 3.3 (0.24) | 0.65 | ||
| LF/HF | Dixon et al. | SPN; FB | 10 | 0.86 (0.16) | 14 | 1.6 (0.85) | ‐1.21 | |
| Shin et al. | SPN; FB | 5 | 1.0 (0.2) | 8 | 1.8 (0.8) | ‐1.37 | ||
| Aubert et al. (rugby athletes) | SPN; FB | 10 | 5.0 (3.2) | 10 | 2.4 (1.5) | 1.04 | ||
| STD; FB | 10 | 6.7 (2.4) | 10 | 5.5 (3.2) | 0.42 | |||
| Aubert et al. (rugby athletes) | SPN; FB | 7 | 5.0 (3.2) | 10 | 2.4 (1.5) | 1.04 | ||
| Middleton and De Vito | SPN; CB | 9 | 0.83 (0.3) | 9 | 0.47 (0.1) | 1.6 | ||
LF: power in low frequency; HF: power in high frequency; LF/HF: ratio between low and high power frequency; ms: miliseconds; n.u: normalized units; Ln(ms2): natural log transformed unit. SPN: supine position; STD: standing position; FB: free breathing; CB: controlled breathing; effect size 0.4 < d < 0.8 (moderate), d > 0.8 (large).
The analysis showed significant results from articles in time and frequency domains presented large or moderate ES. All time domain measure observed in aerobic athletes showed a pos‐itive ES (Table 2). Negative ES was showed in time domain for SDRR only in rugby and anaerobic athletes.29 The most performed protocol was the free breathing in supine position, which did not show different ES in standing position. The frequency domain results were showed as peak frequency (beats/minutes)2, absolute power (ms2), normalized units (n.u), and logarithmic transformation of absolute powers (Ln[ms2];Table 3). From seven protocols using the low and high absolute spectral power, only one showed a moderate positive ES (Table 3).19 Contrarily, five protocols using the logarithmic transformation to calculate the power in LF showed large positive ES (Table 3).25, 26, 29 Considering normalized LF, two protocols with free breathing found a consistent negative ES,20, 21, 22, 23 whilst two protocols with controlled breathing showed ESs with opposite signals (Table 3).20, 26
Only one protocol with controlled breathing showed a negative ES for the normalized HF, which was inconsistent with the same condition in the other study (Table 3).20, 26 Both studies with rugby athletes showed a negative ES for HF in logarithmic scale.25, 29 The ES showed that the protocol, the modalities of sport and the unit of measure both appeared to contribute for the controversial results found in the literature, especially in the frequency domain analyses.
DISCUSSION
Considering that calculated indexes from HRV are sensitive markers of autonomic control, the objective of this study was to investigate the soundest measures of HRV that better ind‐icate the chronic adaptations of physical training in athletes. We also emphasized certain aspects of the performed methodologies to determine an advisable protocol. The global results showed a higher mean RR, SDRR, and HF in athletes. 4, 39 These are due to the physical exercise adaptations in cardiovascular system, mainly due to improved control by nucleus tractus solitarii, rostral ventrolateral medulla, and paraventricular nucleus of the hypothalamus.1 These adaptations promote an increase capacity of the parasympathetic component, thereby increasing HRV.
In spite of the expected founds, the Cohen's ES showed that factors such as modalities of sport, breathing condition, and unit of measure would confound this results. The unexpected negative ESs observed in time domain and HF measure were found only in anaerobic and rugby athletes.25, 29 According to the current literature, the autonomic cardiovascular adaptations are mainly related to the aerobic exercise. Contrarily, the adaptations of strength training are related to the nonautonomic cardiovascular mechanisms such as the decrease of intrinsic HR. 40 From this point of view, it can be supposed that anaerobic and rugby athletes had not a reasonable aerobic training.
Breath condition could emphasize the autonomic modulation due to the cardiorespiratory synch‐ronization that occurs by the activation of the parasympathetic branch originating in the nucleus ambiguous, which increases the vagal tone.41 Furthermore, during breathing control the vagal tone increases and subsequently may improve the total power,7 and this could explain the enhancement of HF and LF observed in some studies.19, 26 Consequently, it is suitable the use of normalized units to better understand the mechanisms related to electrocardiology signal.
Although Middleton and De Vito26 have shown a negative ES– for HF during controlled breathing and indicates that athletes have lower vagal tone than control group, such a controversial result could be explained by the intense training programs these athletes were engaged at the time of testing.26 Iellamo et al.42 also reported this enhanced sympathetic modulation during an intensive training program, which suggests that this sympathovagal balance changes prior competition as a neural adaptation that enabled the cardiovascular system to prepare for demanding competition, enhancing athletic performance.
Moreover, the HRV is a sensitive measurement of adaptation to physical and psychological stress,43, 44, 45 and also established a relationship between behavioral aspects such as attention and emotion.43, 46, 47 In competitive sports, the HRV is sensitive in detecting the autonomic changes caused by precompetitive anxiety.13, 48, 49 It is appropriate for studies with elite athletes to observe the subject's training stage and routine. Generally, the low vagal tone is related to poor system adaptation,50 and it can be related to overtraining.11
In addition, Middleton et al.26 selected a sample composed only by females, but did not control the menstrual cycle stage, which could also contribute to the unexpected results of normalized HF. On the luteal stage, there is an increase in progesterone release and the HRV is characterized by enhancing the LF and the LF/HF ratio. However, the follicular stage shows an increase in the HF and decreases in the LF and the LF/HF ratio.51
In a methodological point of view, factors related to sample characterization and data analyses also influence the measures in time and frequency domain. The differences in genders and ages are well established in the literature,39, 52, 53 women show slightly lower HRV values and higher parasympathetic activity.39, 52 Nevertheless, as observed in three studies included in this review,28, 30, 33 the use of heterogeneous groups as part of the same sample did not appear to influence the results.
The literature recommends for short‐term recording the use of frequency domain measurements.7 However, Sandercock et al.15 showed that in long‐term physical training the ES for change in mean RR interval was greater than HF. This study suggests that higher vagal modulation is responsible for initial increases in RR interval, but that other factors such as changes in heart geometry may be responsible for further adaptation. Considering the ES, the present review points that the time domain measure efficiently represents the athlete's cardiovascular autonomic adaptations.19, 24, 26, 27, 28, 29, 30, 31
As the selected time domain measures in this review are statistical, the duration of the signal and the total number of heartbeats could change the results, but only three studies reported the signal processing.3, 25, 28 It is recommended to record between 3‐ and 5‐minute windows, and between 256 and 300 heartbeats.7, 54, 55 Furthermore, a wide variation in the frequency bands determination of HF and LF were also observed in the studies analyzed. For healthy young athletes, measurements below 0.12 Hz for LF and greater than 0.12 Hz for HF are recommended.56
In summary, the range of performed protocols seems to contribute to the diversity of results found in the literature. Some conflicting results might have been influenced by signal processing and the sample characterization (gender, fitness level, and training routine). According to present results, the time domain measures are suitable to describe the athlete's autonomic profile at rest. Since short‐term HRV recording is a physiological, noninvasive, and low‐cost measurement that provides sensitive markers of the autonomic balance, it is suggested to compound the use of HRV analysis with other physiological and psychological measurement to better understand the athlete's conditioning and health.
CONCLUSION
The present findings indicate that time domain measures of short‐term HRV are less controversial than frequency domain to describe the chronic cardiovascular autonomic adaptations to physical training. The mean RR and SDRR were the most consistent measures with higher ES to assess the autonomic cardiovascular profile in athletes. It was not found any difference between supine or standing position. However, the breath condition had an impact in the frequency domain measures. The controlled breathing caused inconsistent results of LF and HF contrarily to free breathing.
Acknowledgment
This work was supported by the Fundação de Amparo à Pesquisa do Estado do Rio de Janeiro (FAPERJ), grant numbers E26/102.174/2013 and E26/190.226/2013, Rio de Janeiro, Brazil.
REFERENCES
- 1. Michelini LC, Stern JE. Exercise‐induced neuronal plasticity in central autonomic networks: Role in cardiovascular control. Exp Physiol 2009;94:947–960. [DOI] [PMC free article] [PubMed] [Google Scholar]
- 2. Martins‐Pinge MC. Cardiovascular and autonomic modulation by the central nervous system after aerobic exercise training. Braz J Med Biol Res. 2011;44:848–854. [DOI] [PubMed] [Google Scholar]
- 3. Dixon EM, Kamath MV, McCartney N, et al. Neural regulation of heart rate variability in endurance athletes and sedentary controls. Cardiovasc Res 1992;26:713–719. [DOI] [PubMed] [Google Scholar]
- 4. Aubert AE, Seps B, Beckers F. Heart rate variability in athletes. Sports Med 2003;33:889–919. [DOI] [PubMed] [Google Scholar]
- 5. de Abreu SB, Lenhard A, Mehanna A, et al. Role of paraventricular nucleus in exercise training‐induced autonomic modulation in conscious rats. Auton Neurosci 2009;148:28–35. [DOI] [PubMed] [Google Scholar]
- 6. Vanderlei LCM, Pastre CM, Hoshi RA, et al. Noções básicas de variabilidade da frequência cardíaca e sua aplicabilidade clínica. Rev Bras Cir Cardiovasc 2009;24:205–217. [DOI] [PubMed] [Google Scholar]
- 7. Heart rate variability; standards of measurement, physiological interpretation and clinical use . Task Force of the European Society of Cardiology and the North American Society of Pacing and Electrophysiology. Circulation 1996;93:1043–1065. [PubMed] [Google Scholar]
- 8. Berntson GG, Bigger JT, Eckberg DL, et al. Heart rate variability: Origins, methods, and interpretive caveats. Psychophysiology 1997;34:623–648. [DOI] [PubMed] [Google Scholar]
- 9. Thayer JF, Sternberg E. Beyond heart rate variability: Vagal regulation of allostatic systems. Ann N Y Acad Sci 2006;1088:361–372. [DOI] [PubMed] [Google Scholar]
- 10. Thayer JF, Ahs F, Fredrikson M, et al. A meta‐analysis of heart rate variability and neuroimaging studies: implications for heart rate variability as a marker of stress and health. Neurosci Biobehav Rev 2012;36:747–756. [DOI] [PubMed] [Google Scholar]
- 11. Bosquet L, Merkari S, Arvisais D, et al. Is heart rate a convenient tool to monitor over‐reaching? A systematic review of the literature. Br J Sports Med 2008;42:709–714. [DOI] [PubMed] [Google Scholar]
- 12. Alonso DeO, Forjaz CL, Rezende LO, et al. Heart rate response and its variability during different phases of maximal graded exercise. Arq Bras Cardiol 1998;71:787–792. [DOI] [PubMed] [Google Scholar]
- 13. Cervantes Blásquez JC, Rodas Font G, Capdevila Ortís L. Heart‐rate variability and precompetitive anxiety in swimmers. Psicothema 2009;21:531–536. [PubMed] [Google Scholar]
- 14. Mourot L, Bouhaddi M, Perrey S, et al. Decrease in heart rate variability with overtraining: Assessment by the Poincaré plot analysis. Clin Physiol Funct Imaging 2004;24:10–18. [DOI] [PubMed] [Google Scholar]
- 15. Sandercock GR, Bromley PD, Brodie DA. Effects of exercise on heart rate variability: Inferences from meta‐analysis. Med Sci Sports Exerc 2005;37:433–439. [DOI] [PubMed] [Google Scholar]
- 16. Goldsmith RL, Bigger JT, Steinman RC, et al. Comparison of 24‐hour parasympathetic activity in endurance‐trained and untrained young men. J Am Coll Cardiol 1992;20:552–528. [DOI] [PubMed] [Google Scholar]
- 17. Tonkins P, William. Analysis of the Relationship between Exercise Capacity and Heart Rate Variability in Trained and Untrained Individuals. Eugene (OR): University of Oregon, Microform Publications, 1999, p. 30. [Google Scholar]
- 18. Liberati A, Altman DG, Tetzlaff J, et al. The PRISMA statement for reporting systematic reviews and meta‐analyses of studies that evaluate healthcare interventions: Explanation and elaboration. Ann Intern Med 2009;151:W65–94. [DOI] [PubMed] [Google Scholar]
- 19. Puig J, Freitas J, Carvalho MJ, et al. Spectral analysis of heart rate variability in athletes. J Sports Med Phys Fitness 1993;33:44–48. [PubMed] [Google Scholar]
- 20. Shin K, Minamitani H, Onishi S, et al. Assessment of training‐induced autonomic adaptations in athletes with spectral analysis of cardiovascular variability signals. Jpn J Physiol 1995a;45:1053–1069. [DOI] [PubMed] [Google Scholar]
- 21. Shin K, Minamitani H, Onishi S, et al. The power spectral analysis of heart rate variability in athletes during dynamic exercise–Part I. Clin Cardiol 1995b;18:583–586. [DOI] [PubMed] [Google Scholar]
- 22. Shin K, Minamitani H, Onishi S, et al. The power spectral analysis of heart rate variability in athletes during dynamic exercise–Part II. Clin Cardiol 1995c;18:664–668. [DOI] [PubMed] [Google Scholar]
- 23. Shin K, Minamitani H, Onishi S, et al. Autonomic differences between athletes and nonathletes: spectral analysis approach. Med Sci Sports Exerc 1997;29:1482–490. [DOI] [PubMed] [Google Scholar]
- 24. Aubert A, Ramaekers D, Cuche Y, et al. Effect of long term physical training on heart rate variability. Computers in Cardiology 1996;17–20. [Google Scholar]
- 25. Aubert A, Beckers F, Seps B, et al. Non‐linear dynamics of heart rate variability in athletes: Effect of training. Computers in Cardiology 2002;29:441–444. [PubMed] [Google Scholar]
- 26. Middleton N, De Vito G. Cardiovascular autonomic control in endurance‐trained and sedentary young women. Clin Physiol Funct Imaging 2005;25:83–89. [DOI] [PubMed] [Google Scholar]
- 27. Kawaguchi LYA, Nascimento ACP, Lima MS, et al. Caracterização da variabilidade de freqüência cardíaca e sensibilidade do barorreflexo em indivíduos sedentários e atletas do sexo masculino. Rev Bras Med Esporte 2007;13:231–236. [Google Scholar]
- 28. Toufan M, Kazemi B, Akbarzadeh F, et al. Assessment of electrocardiography, echocardiography, and heart rate variability in dynamic and static type athletes. Int J Gen Med 2012;5:655–660. [DOI] [PMC free article] [PubMed] [Google Scholar]
- 29. Aubert AE, Beckers F, Ramaekers D. Short‐term heart rate variability in young athletes. J Cardiol 2001;37(Suppl 1):85–88. [PubMed] [Google Scholar]
- 30. Marocolo M, Nadal J, Benchimol Barbosa PR. The effect of an aerobic training program on the electrical remodeling of heart high‐frequency components of the signal‐averaged electrocardiogram is a predictor of the maximal aerobic power. Braz J Med Biol Res 2007;40:199–208. [DOI] [PubMed] [Google Scholar]
- 31. Molina GE, Porto LG, Fontana KE, et al. Unaltered R‐R interval variability and bradycardia in cyclists as compared with non‐athletes. Clin Auton Res 2013;23:141–148. [DOI] [PubMed] [Google Scholar]
- 32. Janssen MJ, de Bie J, Swenne CA, et al. Supine and standing sympathovagal balance in athletes and controls. Eur J Appl Physiol Occup Physiol 1993;67:164–167. [DOI] [PubMed] [Google Scholar]
- 33. Sacknoff DM, Gleim GW, Stachenfeld N, et al. Effect of athletic training on heart rate variability. Am Heart J 1994;127:1275–1278. [DOI] [PubMed] [Google Scholar]
- 34. Macor F, Fagard R, Amery A. Power spectral analysis of RR interval and blood pressure short‐term variability at rest and during dynamic exercise: Comparison between cyclists and controls. Int J Sports Med 1996;17:175–181. [DOI] [PubMed] [Google Scholar]
- 35. Martinelli FS, Chacon‐Mikahil MP, Martins LE, et al. Heart rate variability in athletes and nonathletes at rest and during head‐up tilt. Braz J Med Biol Res 2005;38:639–647. [DOI] [PubMed] [Google Scholar]
- 36. Chinea AM, Lollett C, Herrera H, et al. Protocol for cardiac assessment of recreational athletes. Conf Proc IEEE Eng Med Biol Soc 2012;2132–2135. [DOI] [PubMed] [Google Scholar]
- 37. Lakin R, Notarius C, Thomas S, et al. Effects of moderate‐intensity aerobic cycling and swim exercise on post‐exertional blood pressure in healthy young untrained and triathlon‐trained men and women. Clin Sci (Lond) 2013;125:543–553. [DOI] [PubMed] [Google Scholar]
- 38. Cohen, Jacob . Statistical Power Analysis for the Behavioral Sciences. New Jersey, Lawrence Erlbaum Associates, 1988. [Google Scholar]
- 39. Carter JB, Banister EW, Blaber AP. Effect of endurance exercise on autonomic control of heart rate. Sports Med 2003;33:33–46. [DOI] [PubMed] [Google Scholar]
- 40. Cooke WH, Carter JR. Strength training does not affect vagal‐cardiac control or cardiovagal baroreflex sensitivity in young healthy subjects. Eur J Appl Physiol 2005;93:719–725. [DOI] [PubMed] [Google Scholar]
- 41. Galletly DC, Larsen PD. Relationship between cardioventilatory coupling and respiratory sinus arrhythmia. Br J Anaesth 1998;80:164–168. [DOI] [PubMed] [Google Scholar]
- 42. Iellamo F, Legramante JM, Pigozzi F, et al. Conversion from vagal to sympathetic predominance with strenuous training in high‐performance world class athletes. Circulation 2002;105:2719–2724. [DOI] [PubMed] [Google Scholar]
- 43. Thayer JF, Lane RD. A model of neurovisceral integration in emotion regulation and dysregulation. J Affect Disord 2000;61:201–216. [DOI] [PubMed] [Google Scholar]
- 44. Lane RD, McRae K, Reiman EM, et al. Neural correlates of heart rate variability during emotion. Neuroimage 2009;44:213–222. [DOI] [PubMed] [Google Scholar]
- 45. Allen JJ, Chambers AS, Towers DN. The many metrics of cardiac chronotropy: A pragmatic primer and a brief comparison of metrics. Biol Psychol 2007;74:243–262. [DOI] [PubMed] [Google Scholar]
- 46. Porges SW. The polyvagal theory: Phylogenetic substrates of a social nervous system. Int J Psychophysiol 2001;42:123–146. [DOI] [PubMed] [Google Scholar]
- 47. Friedman BH. An autonomic flexibility‐neurovisceral integration model of anxiety and cardiac vagal tone. Biol Psychol 2007;74:185–199. [DOI] [PubMed] [Google Scholar]
- 48. Morales J, Garcia V, García‐Massó X, et al. The use of heart rate variability in assessing precompetitive stress in high‐standard judo athletes. Int J Sports Med 2013;34:144–151. [DOI] [PubMed] [Google Scholar]
- 49. Mateo M, Blasco‐Lafarga C, Martínez‐Navarro I, et al. Heart rate variability and pre‐competitive anxiety in BMX discipline. Eur J Appl Physiol 2012;112:113–123. [DOI] [PubMed] [Google Scholar]
- 50. Porges SW. Teoria Polivagal: Fundamentos Neurofisiológicos das Emoções, Apego, Comunicação e Auto‐Regulação. Rio de Janeiro: Senses Neurociências e Aprendizagem; 2012. [Google Scholar]
- 51. Sato N, Miyake S, Akatsu J, et al. Power spectral analysis of heart rate variability in healthy young women during the normal menstrual cycle. Psychosom Med 1995 1995;57:331–335. [DOI] [PubMed] [Google Scholar]
- 52. Bonnemeier H, Wiegand U, Brandes A, et al. Circadian profile of cardiac autonomic nervous modulation in healthy subjects: Differing effects of aging and gender on heart rate variability. J Cardiovasc Electrophysiol 2003;14:791–799. [DOI] [PubMed] [Google Scholar]
- 53. Verlinde D, Beckers F, Ramaekers D, et al. Wavelet decomposition analysis of heart rate variability in aerobic athletes. Auton Neurosci 2001;90:138–141. [DOI] [PubMed] [Google Scholar]
- 54. Sandercock GR, Brodie DA. The use of heart rate variability measures to assess autonomic control during exercise. Scand J Med Sci Sports 2006;16:302–313. [DOI] [PubMed] [Google Scholar]
- 55. Nunan D, Sandercock GR, Brodie DA. A quantitative systematic review of normal values for short‐term heart rate variability in healthy adults. Pacing Clin Electrophysiol 2010;33:1407–1417. [DOI] [PubMed] [Google Scholar]
- 56. McMullen MK, Whitehouse JM, Shine G, et al. Respiratory and non‐respiratory sinus arrhythmia: Implications for heart rate variability. J Clin Monit Comput 2012;26:21–28. [DOI] [PubMed] [Google Scholar]