

Abstract
The electrocardiogram (ECG) interpretation in patients with implantable cardioverter defibrillator (ICD) is often a puzzling problem. The difficulty of the device function evaluation further increases in the presence of unfamiliar timing cycles and additional functions. Authors present a special function of a Biotronik ICD devices called the thoracic impedance monitoring, and demonstrate its behavior in a patient with sinus rhythm, ventricular ectopic beats, and ventricular tachycardia episode. This report shows unexceptional occurrence of tricky ECG finding in patient with Biotronik ICD.
Keywords: electrocardiogram, implantable cardioverter defibrillator, thoracic impedance
1. INTRODUCTION
The analysis of 24‐hr electrocardiogram (ECG) monitoring in patients with cardiac implantable electronic devices might be difficult as it requires a thorough understanding of a variety of mode‐switching algorithms, complex timing cycles, and their interrelationships. An interpretation is particularly complicated in the presence of unfamiliar algorithms and additional functions. The ECG recordings we present in this paper were obtained from a patient with the Biotronik ICD device in which thoracic impedance function was turned on.
2. CASE PRESENTATION
A 55‐year‐old male patient had a single‐chamber implantable cardioverter defibrillator (ICD) implanted on the right side of the chest 3 years ago due to primary prevention of sudden cardiac death. The ventricular dual coil Biotronik Linox Smart SD active fixation lead were implanted in the right ventricular apex (RVA) and connected with Biotronik Lumax 540 VR‐T ICD generator. The parameters were as follows: mode VVI, basic rate = 50 beats per minute (bpm), night rate: OFF, rate hysteresis: −10 bpm (40 bpm), thoracic impedance: ON. Tachycardia detection: VT1/VT2/VF: 167/OFF/214 bpm.
Due to heart palpitations and ventricular arrhythmia present in 12‐lead ECG tracing after antiarrhythmic treatment escalation the 24‐hr ECG monitoring has been performed. Selected ECG fragments are presented in Figures 1, 2, 3, 4. Figure 1 shows sinus bradycardia approximately 48 bpm, which inhibits ventricular pacing. Figure 2 demonstrates ventricular pacing 50 bpm, which starts when sinus rhythm slowed down to the rate of hysteresis after ventricular ectopic beat. The pacemaker function is correct in abovementioned ECG tracings. Figures 3 and 4 show pacing spikes following QRS complexes both in sinus rhythm and during ventricular tachyarrhythmia (ventricular bigeminy and episodes of nonsustained ventricular tachycardia).
Figure 1.
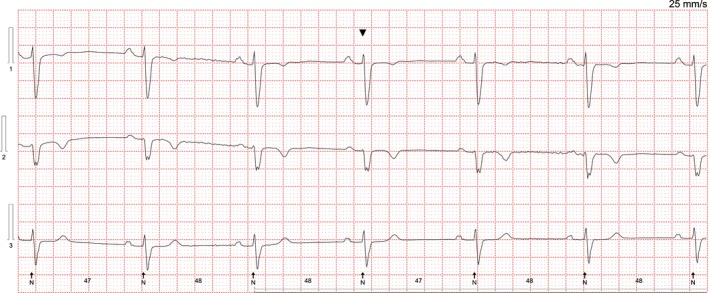
Holter ECG. Sinus rhythm at approximately 48 bpm. There are no pacing abnormalities
Figure 2.

Holter ECG tracing. After third QRS complex (ectopic ventricular beat) sinus rhythm slowes down to 40 bpm and ventricular pacing at 50 bpm commences, there is atrioventricular dissociation (P waves superimposed on paced QRS complexes)
Figure 3.

Hoter ECG tracing. Ventricular bigeminy. Pacing spikes occur approximately 100 ms after each QRS complex
Figure 4.

Holter ECG tracing. The first four evolutions represent sinus rhythm, next three evolutions represent nonsustained ventricular tachycardia, then two sinus rhythm beats, after which starts ventricular ectopic beat. After 100 ms following each QRS, there is pacing spike. Due to ventricular tachycardia being below detection threshold device performs TI monitoring
Implantable cardioverter defibrillator interrogation revealed normal function of the device and of the lead. What is the mechanism of this phenomenon?
3. DISCUSSION
Pacing spikes occurring after 100 ms following the sensed ventricular beats represent the thoracic impedance measurement in Biotronik ICD. If the thoracic impedance measurement (TI) is turned on, it is possible to observe in the standard ECG or Holter ECG additional spikes approximately 100 ms after the native (Vs) or paced (Vp) QRS complex (Lumax Technical Manual, 2011; Squara & Alonso, 2014). The thoracic impedance measurement is based on sub‐threshold pain‐free pacing pulses delivered between RV‐coil and ICD can. This configuration vector is comparable to unipolar pacing. This is the reason why the test pulses are visible in the standard ECG leads. These test pulses do not have any negative effects on the patient for two reasons:
The energy of the test pulses is very small therefore cannot capture the heart (approx. 1V @ 0.03 ms),
The test stimulus falls into total refractory period as it is coupled 100 ms after Vs or Vp.
The Biotronik ICD starts measurement sequence every hour with 1,024 test pulses. When ICD detects ventricular tachycardia (VT) transthoracic impedance measurement is withheld until VT terminates. However, TI measurement is performed when VT rate is below VT detection threshold. Hence, the upper rate of TI measurement is determined by the slowest VT detection window. Figure 4 shows VT episode consisting of three ventricular beats which rate is below VT detection, therefore, the spikes of TI are present 100 ms after each sensed QRS. In the patient with ventricular rate of 60 bpm, a unipolar spike within or shortly after the QRS may be present in 12‐lead ECG and 24‐hr ECG up to 28% of the time (1,024 out of 3,600 cycles per hour).
Cardiologists should be familiar with this feature of Biotronik ICDs to avoid unnecessary suspicion of ICD dysfunction.
Ząbek A, Małecka B, Nowosielska‐Ząbek E, Dębski M, Boczar K, Lelakowski J. Pacing spikes following QRS complexes: What is the mechanism? Ann Noninvasive Electrocardiol. 2019;24:e12545 10.1111/anec.12545
REFERENCES
- Lumax Technical Manual (2011). Lumax family of ICDs and CRT‐Ds technical manual. Retrieved from https://manuals.biotronik.com
- Squara, F. , & Alonso, C. (2014). Unexceptional occurrence of tricky ECG findings in patients having new Biotronik ICDs. International Journal of Cardiology, 176, 262–263. 10.1016/j.ijcard.2014.06.053 [DOI] [PubMed] [Google Scholar]