

Abstract
Background
In the human electrocardiogram, there is a lag of adaptation of the QT interval to heart rate changes, usually termed QT/RR hysteresis (QT‐hys). Subject‐specific quantifiers of QT‐hys have been proposed as potential biomarkers, but there is no consensus on the choice of the quantifier.
Methods
A comprehensive literature search was conducted to identify original articles reporting quantifiers of repolarization hysteresis from the surface ECG in humans.
Results
Sixty articles fulfilled our inclusion criteria. Reported biomarkers were grouped under four categories. A simple mathematical model of QT/RR loop was used to illustrate differences between the methods. Category I quantifiers use direct measurement of QT time course of adaptation. They are limited to conditions where RR intervals are under strict control. Category IIa and IIb quantifiers compare QT responses during consecutive heart rate acceleration and deceleration. They are relevant when a QT/RR loop is observed, typically during exercise and recovery, but are not robust to protocol variations. Category III quantifiers evaluate the optimum RR memory in dynamic QT/RR relationship modeling. They estimate an intrinsic memory parameter independent from the nature of RR changes, but their reliability remains to be confirmed when multiple memory parameters are estimated. Promising approaches include the differentiation of short‐term and long‐term memory and adaptive estimation of memory parameters.
Conclusion
Model‐based approaches to QT‐hys assessment appear to be the most versatile, as they allow separate quantification of QT/RR dependency and QT‐hys, and can be applied to a wide range of experimental settings.
Keywords: QT adaptation, QT hysteresis, quantitative ECG, repolarization
1. INTRODUCTION
The QT interval on the human electrocardiogram (ECG) depends on heart rate. The simplest forms of rate correction of the QT interval assume a universal static relationship between QT and the immediately preceding RR interval (Bazett, 1920; Fridericia, 1920). It has been demonstrated more recently that the steady‐state relationship between QT and RR intervals differs among healthy individuals (Malik et al., 2002). In addition, there is a lag of adaptation of QT to sudden changes in heart rate (Attwell, Cohen, & Eisner, 1981), meaning that the QT interval is influenced by the history of preceding RR intervals. As a result, QT intervals measured shortly after a sudden heart rate increase are longer than QT intervals measured at a similar heart rate while it is decreasing. This well‐documented phenomenon, referred to as QT/RR hysteresis (QT‐hys) (Sarma et al., 1987), is observable both on the surface ECG and at the cellular level: The lag of adaptation of action potential duration (APD) to sustained changes in pacing rate was observed several decades ago in animal studies (Carmeliet, 1955) and properly described in the intact human heart (Franz et al., 1988).
While universal formulas accounting for RR history in QT/RR modeling have been proposed (Razak et al., 2011), it has been suggested that the profiles of QT‐hys were highly individual (Malik, Hnatkova, Novotny, et al., 2008). The dynamic QT/RR relationship thus could be divided into two distinct processes, both appearing to be subject‐specific: QT/RR dependency, that is, how much the steady‐state QT interval varies through the range of physiological RR intervals; and QT/RR hysteresis (more precisely termed “hysteresis lag”), that is, how fast the QT interval attains its steady state following a sustained variation of RR intervals. While studies of the QT/RR relationship in humans have often merged these two processes, recent studies have suggested that QT/RR dependency and QT‐hys are uncorrelated and likely represent distinct physiological mechanisms (Malik, Hnatkova, Novotny, et al., 2008; Malik et al., 2013).
Several methods of quantification of QT‐hys have been proposed. Given the widespread use of rate‐corrected QT interval measurement (QTc), notably in the evaluation of potentially QT prolonging drugs, individual QT‐hys modeling has been used to increase the robustness of QT correction (Malik et al., 2009a). A recent study challenges this concept, suggesting that despite the wide variability of QT‐hys profiles among humans, individual optimization of rate correction for hysteresis has little impact on QTc measurement (Malik et al., 2016). However, multiple studies have proposed that QT‐hys descriptors may hold prognostic value, independent of QTc. Among other things, QT‐hys has been suggested as a risk marker of arrhythmic death in survivors of myocardial infarction (Pueyo et al., 2004) and as a predictor of exercise‐induced myocardial ischemia (Lauer et al., 2006; Zhang et al., 2014). QT‐hys have also been shown to increase with age (Malik et al., 2013) and to differ between men and women (Malik et al., 2016). In continuity with an editorial pointing out multiple issues regarding QT‐hys evaluation (Malik, 2014), the aim of this review was to comprehensively identify, categorize, and compare published quantifiers of QT‐hys.
2. SYSTEMATIC REVIEW
This review was conducted following the PRISMA statement (Moher et al., 2009). A systematic literature search was operated using the following search engines and databases: Web of Science (all databases), PubMed (MEDLINE), OvidSP (EMBASE), and EBSCOhost (CINAHL and SPORTDiscus). Journal articles written in English or French from inception to September 23, 2016, were searched in all database fields using the following query:
[qt OR “q‐t” OR repolarization] AND [rr OR “r‐r” OR rate OR “cycle length”] AND [hysteresis OR dynamic* OR lag OR memory OR adaptation] AND [heart OR cardiac OR ventricular OR ECG]
After removal of duplicates, articles were screened for inclusion based on title, on abstract and, if needed, on full text. References cited in included articles were systematically screened for inclusion. To be included, articles had to comply with the three following criteria:
Report original data acquired in human subjects.
Address the relationship between ventricular repolarization time and cardiac cycle length, measured from the surface ECG.
Report at least one quantifier of the lag in the aforementioned relationship.
Search results are summarized in Figure 1. A total of 65 articles were initially included in the review. Five articles were preliminary versions (published in conference proceedings) of more substantial studies published later by the same research groups and were excluded, leading to a final count of 60 articles.
Figure 1.
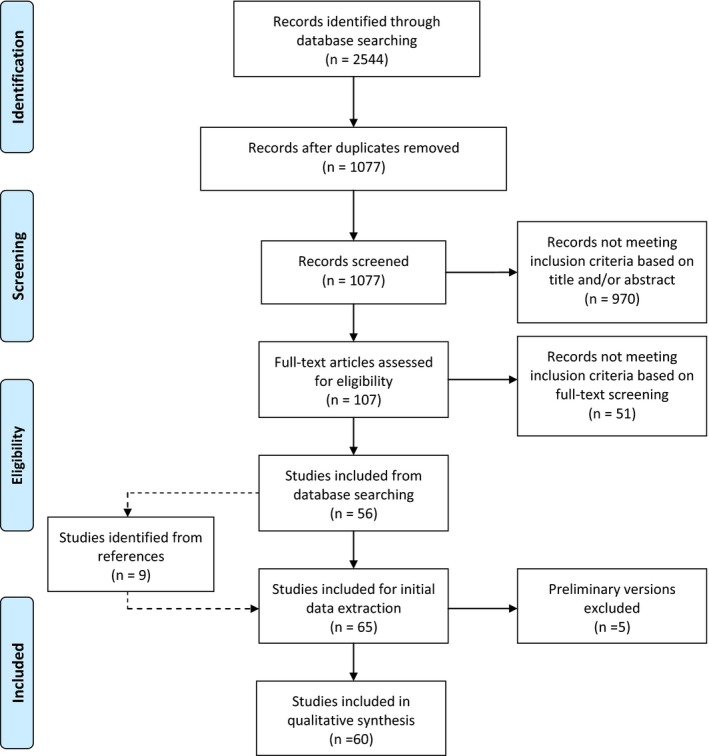
Flowchart of searching and filtering of articles
The following data were extracted from the selected articles: cause of RR variation during ECG acquisition, description of the quantifier of QT‐hys, subject demographics (sample size, age, sex, and medical condition), and descriptive statistics of QT‐hys. The nature of the review was descriptive and did not allow pooled analysis of the extracted data.
3. CATEGORIZATION OF REVIEWED METHODS
A wide variety of stressors have been used to provoke and measure QT‐hys: atrial or ventricular pacing, gradual or burst exercise protocols, postural changes, tilt test, controlled breathing, face immersion in cold water, and selection of Holter segments with significant RR variation due to normal daily activity or occurrence of supraventricular tachycardia. Therefore, it appeared more relevant to categorize QT‐hys descriptors according to the quantification techniques rather than the stressors. We defined four categories of QT‐hys quantification methods based on their conceptual approach and experimental design:
Category I (six articles): QT‐hys is computed without accounting for the concurrent RR sequence which is assumed to be experimentally controlled.
Category IIa (10 articles): QT‐hys is computed from QT intervals measured at a predetermined RR interval observed during sequential rate increase and decrease through provocative testing.
Category IIb (seven articles): QT‐hys is computed from QT intervals measured over a predetermined RR interval range observed during sequential rate increase and decrease through provocative testing.
Category III (34 articles): The QT interval is predicted by a parametric function of the effective RR interval expressed as a weighted sum of the history of preceding RR intervals. After parameter optimization, QT‐hys is computed from the decay rate of these weights along time.
QT‐hys quantifiers are accordingly listed in four tables and discussed hereafter. Three articles not fitting any of these categories are discussed separately. When available, summary descriptive statistics of the individually assessed QT‐hys are reported in the last column of Tables 1, 2, 3, 4. Studies reporting strict application of a previously described method are listed together with the original article in the tables.
Table 1.
Category I quantifiers: direct measurement of QT time course of adaptation
| Reference | Method of RR variation | Description of QT‐hys indexes | Range of QT‐hys values |
|---|---|---|---|
| Attwell et al. (1981) | Right atrial pacing | Time to QT steady state after cessation of pacing at 180 bpm | ~3 min |
| Seed et al. (1987) |
Right atrial or right ventricular pacing (n = 4) |
Time to QpTp steady state after rate change | >3 min |
| Lau et al. (1988) |
Right ventricular pacing (n = 7) |
|
|
| Vainer et al. (1994) |
Recovery from 1 min of rapid knee bending (n = 10) Atrial pacing (n = 3) |
|
|
| Grom et al. (2005) |
Selected Holter segments surrounding episodes of AFib (n = 32) Atrial pacing (n = 20) |
Time to restoration of baseline QTc after AFib conversion or rate change | 1–5 min |
| Seethala et al. (2011) |
Atrial pacing before and during dobutamine infusion (n = 10) |
|
|
AFib, atrial fibrillation; QpTp, interval from peak of Q wave to peak of T wave; QTc, QT interval corrected for heart rate using Bazett's formula.
Table 2.
Category IIa quantifiers: difference between QT intervals observed at similar heart rates during RR shortening vs lengthening
| Reference | Method of RR variation | Description of QT‐hys indexes | Range of QT‐hys values |
|---|---|---|---|
| Krahn et al. (1997) |
Modified Bruce treadmill test (n = 63, including 14 LQTS patients) |
|
|
|
applied in: Wong et al. (2010) | |||
| Swan, Toivonen, and Viitasalo (1998) |
Graded cycle ergometer test (n = 38) |
Tests within group differences of QT, QTp, and TpTe at predetermined heart rates during exercise and recovery | Significant QT and QTp hysteresis |
|
applied in: Swan et al. (1999) | |||
| Krahn et al. (2002) |
Modified Bruce treadmill test (14 LQTS patients and 10 controls) |
Difference between QTp measured at 30 s, 1, 2, 3, 4, and 5 min into recovery from peak exercise and QTp at identical heart rate during gradual exercise |
1 min into recovery: 46 ± 19 ms (LQTS off beta‐blockers) 25 ± 35 ms (LQTS on beta‐blockers) 19 ± 11 ms (controls) |
| Chauhan et al. (2002) |
Graded cycle ergometer test (n = 20) |
Difference between exercise and recovery QTp/heart rate curves (quadratic fitting) computed for heart rates observed at 1 and 2 min into recovery from peak exercise |
1 min into recovery: 20 ± 20 ms |
| Lewis and Short (2006) |
Graded cycle ergometer test (n = 12) |
Difference between QTp averaged in 10 consecutive windows of 1 min following peak exercise and QTp at corresponding RR interval during exercise |
Maximal QT‐hys among the 10 windows: 10–30 ms |
| Gao et al. (2007) |
Modified Bruce treadmill test (17 LQTS patients, 16 with uncertain LQTS, 18 controls) |
Difference between QT measured at 1, 2, 4, and 6 min into recovery from peak exercise and QT at identical heart rate during gradual exercise |
1 min into recovery: 45 ± 11 ms (LQTS) 23 ± 9 ms (uncertain LQTS) 19 ± 10 ms (controls) |
| Chattha et al. (2010) |
Burst exercise and graded cycle ergometer test (25 LQT1 patients, 25 LQT2, and 25 controls) |
Difference between QT measured at 100 bpm during exercise and QT at same heart rate during recovery |
10 ± 9 ms (LQT1) 34 ± 7 ms (LQT2) 9 ± 4 ms (controls) |
| Padfield et al. (2016) |
Graded cycle ergometer test (n = 106) |
Difference between QTc measured at 100 bpm during exercise and at similar heart rate during recovery | No evidence of significant QT‐hys |
LQTS, long QT syndrome; LQT1/LQT2, long QT syndrome of type 1/type 2; QTc, QT interval corrected for heart rate using Bazett's formula; QTp, interval from Q onset to peak of T wave; RpTp, interval from peak of R wave to peak of T wave; TpTe, interval from peak to end of T wave.
Table 3.
Category IIb quantifiers: area between QT/RR curves observed during RR shortening vs lengthening
| Reference | Method of RR variation | Description of QT‐hys indexes | Range of QT‐hys values |
|---|---|---|---|
| Sarma et al. (1987) |
Bruce treadmill test (n = 14) |
QT/RR and QTp/RR loop areas measured between minimum RR and minimum RR + 150 ms |
3709 ± 1676 ms2 (QT) 3642 ± 1176 ms2 (QTp) |
| Yamada et al. (1993) |
Head‐up tilt test (n = 14) |
QT/RR loop area measured between points of intersection | 7190 ± 4930 ms2 |
| Ng et al. (1998) |
Bruce treadmill test (n = 42) |
QT/RR loop area (unspecified method) | Significant QT‐hys |
| Chauhan et al. (2004) |
Burst exercise and graded cycle ergometer test (n = 21 LQTS patients on and 5 off beta‐blockers, 20 controls) |
QTp/RR loop area measured between points of intersection or for comparable RR |
9371 ± 7859 ms2 (LQTS on beta‐blockers) 8921 ± 9074 ms2 (LQTS off beta‐blockers) 3176 ± 2994 ms2 (controls) |
| Lauer et al. (2006) |
Cornell treadmill test (n = 260) |
QT/RR loop area measured between minimum RR and RR plateau at the end of recovery minus 10%, normalized for exercise performance and the extent of exercise‐induced QT/RR total variation | 253–375 (no unit) |
| Pelchovitz et al. (2012) |
Graded submaximal cycle ergometer test (16 type‐2 diabetes, 71 CAD with preserved LVEF, 17 with depressed LVEF, 20 controls) |
|
|
| Zhang et al. (2014) |
Modified Bruce treadmill test (61 patients with negative and 77 with positive angiography) |
|
|
CAD, coronary artery disease; LVEF, left ventricular ejection fraction; LQTS, long QT syndrome; QTp, interval from Q onset to the T peak of T wave.
Table 4.
Category III quantifiers: optimum RR memory in QT/RR dynamic modeling
| Reference | Method of RR variation | Description of QT/RR model | QT‐hys quantifiers derived from the model | Range of QT‐hys values |
|---|---|---|---|---|
| Raeder et al. (1995) |
Controlled irregular breathing (n = 14) |
RT is a linear combination of the history of RR | Duration of RT impulse response to RR change as observed on the cross‐correlogram between RR and RT |
2.9–4.7 s (supine) 1.3–1.6 s (standing) 4.8–8.1 s (standing with beta‐blockade) |
| Dajani et al. (2003) |
Selected segments of 24‐h Holter (n = 6) |
QT is predicted from the M preceding RR intervals using an artificial neural network | Optimal time delay in the model | 4 min (estimated in one patient) |
| Pueyo et al. (2003, 2004) | 24‐h Holter (462 MI survivors with depressed LVEF on amiodarone treatment and 404 on placebo) | QT/RR dependency: Best individual fit among 10 a priori selected regression models (two parameters) |
|
|
|
applied in: Baumert et al. (2008, 2010), Bolea et al. (2013), Malik, Hnatkova, Schmidt, et al. (2008), Malik et al. (2009a,b), Minchole et al. (2011, 2014, 2015), Ramirez et al. (2012), Smetana et al. (2004) | ||||
RR memory: two models
| ||||
| Halamek et al. (2007a) |
Supine rest/tilt test/constant load cycling (n = 19) |
QT/RR dependency: linear | Number of beats to reach 90% of QT variation following RR change |
86 ± 28 beats (supine rest) 91 ± 31 beats (tilt test, breathing at 0,1 Hz) 78 ± 20 beats (tilt test, breathing at 0,33 Hz) 142 ± 35 beats (cycling) 104 ± 40 beats (combined measurements) |
|
applied in: | ||||
| RR memory: two parameters describing the fast and slow components of QT response | ||||
| Pueyo et al. (2008) | Controlled postural maneuvering (n = 33) | QT/RR dependency: polynomial | Equivalent to 1 in Pueyo et al., 2004) (described above), computable at each instant of the recording, and expressed in beat counts |
Time varying (approximate range: 30–100 beats) |
| RR memory: adaptive estimation of the transfer function describing hysteresis | ||||
| Trost (2008) |
24‐hour Holter (six patients with documented TdP, 36 controls) |
QT/RR dependency: two parameters describing the static relation between 1/QT and 1/RR | Number of beats to reach 99,5% of QT variation following RR change |
415 ± 21 beats (controls) 1001 ± 41 beats (patients with TdP) |
| RR memory: Autoregressive moving‐average transfer function | ||||
| Malik, Hnatkova, Novotny et al. (2008) |
Daytime ECG ≥13 h (n = 40) |
QT/RR dependency: Best individual fit among 10 a priori selected regression models (two parameters) |
|
|
|
applied in: Malik et al. (2013, 2016), Malik, Hnatkova, et al. (2012), Malik, van Gelderen (2012), Hnatkova et al. (2010, 2014), Jacquemet et al (2014), Ramirez et al. (2014) | ||||
| RR memory: one parameter (exponential model). The weights of the RR intervals are separately plotted against continuous time (time‐based approach) and discrete time (interval‐based approach) | ||||
| Hadley et al. (2011) |
Treadmill test: (n = 1959 for model development, n = 5 for validation) |
QT/RR dependency: quadratic fit | Number of beats to reach 50% of QT variation following RR change | From near 0 to over 100 beats |
| RR memory: three parameters. The effective RR (exponential model) is determined from the predicted RR which accounts for both long‐term RR history and local trend | ||||
| Jacquemet et al. (2011) |
(n = 12) Atrial pacing (n = 1) |
QT/RR dependency: best individual fit among 8 a priori selected regression models (three parameters) | Number of beats to reach 90% of QT variation following RR change |
100 ± 20 beats (pacing) 43–117 beats (tilt test) |
| RR memory: two parameters describing the fast and slow components of QT response | ||||
| Chen and Trayanova (2012) |
10‐min ECG segments recorded before VT onset (n = 15) |
QT is predicted from both preceding QT and RR intervals. 2M‐parameter model where M is the extent of QT and RR history | Extent of activation history (in beat counts) to include in the model to reach a mean square error <5 ms2 in QT prediction |
38 ± 9 beats immediately before VT 32 ± 8 beats 1 hr before VT |
LVEF, left ventricle ejection fraction; MI, myocardial infarction; TdP, torsades de pointes; VT, ventricular tachycardia.
The different approaches are applied to a simple mathematical model of QT hysteresis (Figure 2) based on exponential RR variation during exercise and recovery, on linear QT/RR dependency based on Sagie et al. (1992), and on a hysteresis model with exponentially decaying weights. This model enables analytical calculation of QT‐hys indices and allows the identification of inherent dependencies of quantifiers to variables of the recording protocol. It will be used as a guide for the discussion.
Figure 2.
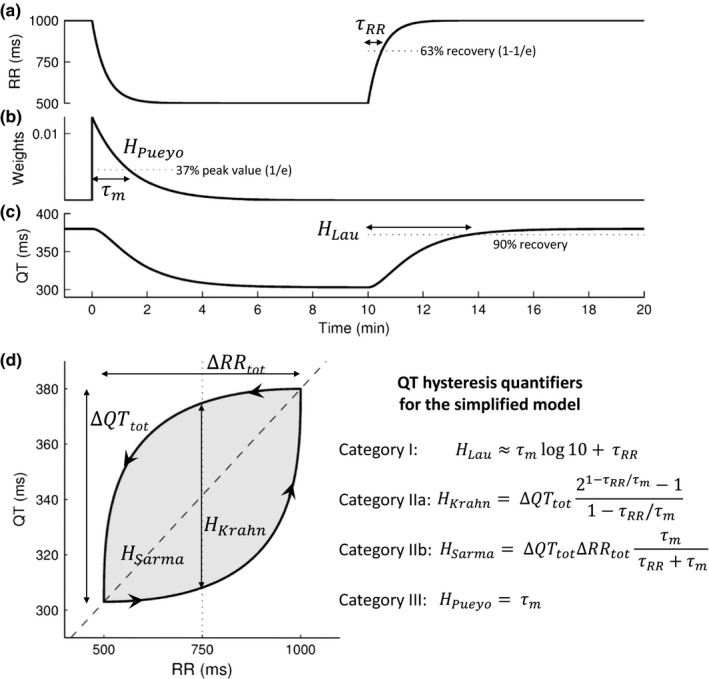
A simple mathematical model of QT/RR hysteresis. (a) The RR interval time course follows two exponential curves with time constant τRR corresponding to exercise and recovery. (b) The effective RR interval is a linear combination of preceding RR intervals with exponentially decaying weights with time constant τm. (c) The QT interval is computed as a linear function of the effective RR (Sagie et al. QT/RR relation). (d) Resulting QT/RR loop. The arrows indicate time evolution. The dashed line is the static QT/RR curve. Analytical formulas for the main QT‐hys quantifiers in the context of this simple model are shown on the right‐hand side. Calculation details are available upon request to the corresponding author
4. DISCUSSION
4.1. Category I: direct measurement of QT time course of adaptation
A simple method of QT‐hys assessment is to measure the time needed for the QT interval to attain its steady state after initiation of a sustained RR change, or the time to reach 90% of QT total variation (Figure 2c). That approach typically led to values around 3 min (Table 1). Two studies also reported the time constant of the exponential fit of QT versus time after rate change (Lau et al., 1988; Seethala et al., 2011). The obtained values of 35–60 s correspond to a time to reach 90% of QT adaptation of approximately 80–140 s. Based on the observation of a biphasic QT response to rate change, which is a common finding in pacing studies both at the cellular level and on the surface ECG (Franz et al., 1988; Lau et al., 1988), Seethala et al. (2011) excluded the QT intervals measured during the initial fast QT response from their exponential curve fitting, thus providing a specific descriptor of the slow component of QT response.
Category I quantifiers describe the time course of QT adaptation following a provoked and sustained RR change, assumed to be controlled experimentally. As illustrated in the simple model (formula for H Lau in Figure 2), slow RR kinetics (large τRR) lead to an overestimation of QT‐hys using category I quantifiers. Under pacing however, τRR tends to zero and H Lau effectively describes the time lag of QT accommodation. Appropriately, most studies listed in Table 1 investigated QT response during atrial or ventricular pacing. Besides the concerns of invasiveness, an issue of pacing studies is that they may not be representative of normal cardiac activity under autonomic control. It has been suggested that part of QT shortening during exercise is independent of ventricular rate and potentially explained by autonomic modulation (Rickards & Norman, 1981). Thus, while pacing studies are of primary importance to gain insights into the basic mechanisms of hysteresis, their clinical relevance is limited.
4.2. Category II: comparison of QT response during RR shortening vs lengthening
QT‐hys may be evaluated by comparing QT response at similar RR intervals during sequential heart rate acceleration and deceleration. Instead of estimating the time lag of QT adaptation to RR change, these methods measure the amplitude of the hysteresis loop (Figure 2d).
A first approach is to measure the difference of QT intervals (ΔQT) during heart rate increase and decrease at the same RR interval (H Krahn in Figure 2d). All reviewed studies using this approach (Table 2) were based on exercise test data. There is no consensus about the reference RR interval to be considered for ∆QT measurement, some using predetermined reference RR intervals and others measuring ∆QT at predetermined timings during recovery from peak exercise. The mathematical model (Figure 2) shows that this measure depends on an extrinsic variable (τRR) which may hamper its reproducibility. In contrast to category I methods, this dependency does not disappear even if only abrupt RR variations are considered.
A second approach is to measure the area between QT/RR curves obtained separately during increasing and decreasing rates, thus estimating the average extent of the hysteresis loop (H Sarma in Figure 2d). This generalizes the ∆QT method to a range of RR variation. Following the pioneering work of Arnold et al. (1982), several methods for quantifying QT/RR loop area (usually reported in ms2) have been suggested, using different stress protocols and curve fitting techniques (Table 3). In the same way as the ∆QT method, the loop area method brings the problem of the choice of the reference RR range or reference timing of measurement. As the reference RR range affects the magnitude of the total loop area, it seems inappropriate to compare QT/RR loop areas among subjects with different ranges of RR variation in response to a stress protocol. To overcome this problem, some studies have used a fixed range of RR variation for the assessment of the loop area, for example, from minimum RR with a range of 150 ms (Pelchovitz et al., 2012; Sarma et al., 1987). Other studies have divided the measured loop area by the total magnitude of RR variation (∆RRtotal in Figure 2d), resulting in an index of QT‐hys equivalent to the mean ∆QT over the observed RR range (Lauer et al., 2006; Zhang et al., 2014).
A limitation of these methods is that their QT‐hys estimate may be influenced by the steepness of the QT/RR curve. At similar QT time lag and RR range, the steeper the QT/RR curve, the larger the loop area. A solution to this problem is to divide the loop area by the total rectangular area (∆QTtotal · ∆RRtotal). This approach proposed by Lauer et al. (2006) may help reduce the confounding effect of subject‐specific QT/RR dependency. In the mathematical model (Figure 2d, H Sarma) with linear QT/RR dependency, the normalization suppresses this effect. In the presence of QT/RR curvature (Malik et al., 2013) revealed by stress testing, however, the normalization would be approximate and residual dependency of QT‐hys on QT/RR curve may remain. In any case, as with the first approach, the dependency in the extrinsic variable τRR remains (Figure 2). One can presume that τRR during provocative testing is mostly controlled by the stress protocol, for instance, by the steepness of exercise intensity variation and duration of exercise stages. However, it has been demonstrated that individual heart rate kinetics to a given stress level are variable among humans (Hettinga et al., 2014). It remains to be elucidated whether such variability is sufficient to undermine QT‐hys estimates using the aforementioned methods during a fixed stress protocol.
4.3. Category III: estimation of the optimum RR memory in the QT/RR relationship
The most recent and largest category of QT‐hys quantifiers involves model‐based estimation of memory parameters that describe the time lag between RR and QT changes. The QT interval is expressed as a function (QT/RR parametric curve) of the effective RR interval written as a linear combination (transfer function) of the history of RR intervals. The weight associated with each past RR interval depends on its time lag (Figure 2b). From the lag dependence of these weights, an intrinsic measure of QT‐hys can be derived, typically the timescale of decay (Figure 2b) (Malik, Hnatkova, Novotny, et al., 2008; Pueyo et al., 2004) or the time to reach 90% of the cumulative weights (Halamek et al., 2007b; Pueyo et al., 2004). The weights can be a function of either continuous time (as in our mathematical model) or discrete time (number of beats). Whereas it has been shown that the continuous‐time approach led to slightly more reliable estimations of the rate‐corrected QT interval (Malik, Hnatkova, Novotny, et al., 2008), solid evidence on a preferable method is still missing.
Most models are based on a limited number of parameters that are identified by minimizing the mean square prediction error of QT intervals from the RR time series. The QT/RR dependency parameters and the RR memory parameters are simultaneously optimized. The parametric models of QT/RR dependency were thoroughly studied (Malik, Hnatkova, Kowalski, et al., 2012). RR memory models with one parameter are typically exponentially decaying weights as in our mathematical model (Figure 2b). Such model was shown to have a better data fit than linearly decaying weights (Pueyo et al., 2004). Two‐parameter models differentiate immediate QT response and long‐term memory (Halamek et al., 2007b; Jacquemet et al., 2011). This is conceptually similar to the Cabasson model (Cabasson et al., 2012) which approximates the fast component of QT response to correspond to the immediate response of APD described by S1‐S2 restitution curves, and adds an element of memory to explain slower QT changes. Indeed, the S1‐S2 and dynamic restitution protocols are thought to respectively describe the fast and steady‐state response of APD to rate change (Kalb et al., 2004). Models including more than two parameters have been proposed. Notably, in addition to the exponential model, Pueyo et al. (2003) reported a model in which every RR interval in a 5‐min window preceding a QT interval is given an independent weight, without assumption of a fixed pattern of RR influence decay. Other memory models have included the history of past QT intervals (Chen & Trayanova, 2012), the short‐term trend of RR variation (Hadley, Froelicher, Wang, et al., 2011), or the history of ECG derived respiration (Imam, Karmakar, Jelinek, et al., 2016). There are however some concerns about the robustness and reproducibility of estimating more than one memory parameter.
A significant advantage of model‐based QT‐hys quantifiers over other methods is that, along with the estimation of the lag of QT accommodation to RR change, they provide separate descriptors of the QT/RR steady‐state dependency. In theory, and as illustrated in our simplified model, QT‐hys quantifiers of other categories could even be extracted from the dynamic QT/RR model under certain assumptions. Another advantage is that they only require a sufficiently broad range of RR intervals regardless of the protocol design. In particular, the method is applicable to recordings at rest. The model may however be application‐dependent; that is, under different recording conditions (rest, tilt test, exercise), different models may be needed to provide optimum QT prediction.
It is generally assumed that RR memory is time‐invariant, that is, that it is fixed for a given individual, independent of the cause and pattern of heart rate change. This may be reasonable in near‐resting conditions. Repeated QT‐hys assessment from separate long ECG recordings in the same subjects indicated that QT‐hys (derived from a one‐parameter model of RR memory) was stable in individuals and variable between subjects (Malik, Hnatkova, Novotny, et al., 2008). To our knowledge, this study was the only investigation of the repeatability of QT‐hys measurement. The stability of other QT‐hys quantifiers (category I–II and category III quantifiers derived from other models) remains to be demonstrated, as well as the stability of QT‐hys estimation from short ECG recordings or in the presence of wide and sudden RR variations. Adaptive parameter estimation (Pueyo et al., 2008) may enable tracking the evolution of memory parameters, but the developments are still at the proof‐of‐concept stage.
4.4. Other methods
Three documented approaches to QT‐hys evaluation did not fit under our categories. Cammarota & Curione (2012) investigated the time delay between the occurrence of the minimum RR interval and the minimum RT interval during a graded maximal exercise test and subsequent recovery. The estimated RR‐RT lag in healthy subjects was approximately 19 s or 50 beats. In our mathematical model (Figure 2), in the case where the RR interval time series features a peak with exponential decay (time constant: τRR) on both sides, the RR‐RT lag is calculated to be τRR τm/(τm − τRR) · log((τm + τRR)/2τRR). If the time constant of RR variation is τRR = 12 s, a RR‐RT lag of 19 s is obtained provided that the memory time constant τm = 80 s, which seems reasonable, but illustrates the difficulty to interpret this measure as a QT‐hys index.
Two other studies suggested methods closely related to the ∆QT between exercise and recovery. Toivonen, Helenius, and Viitasalo (1997) measured QT intervals during the relatively small rate increase observed in the first 30 s following awakening of subjects on alarm call and compared them to QT intervals measured at similar heart rates during stable conditions. Kannankeril, Harris, Norris, et al. (2008) compared QT intervals measured during the third minute of each stage of a graded exercise test to QT intervals measured at similar heart rate during the first minute of the same stage, therefore investigating QT‐hys within an exercise stage. The two latter methods are inherently restricted to describe hysteresis during relatively short and small RR variations, which may decrease their signal‐to‐noise ratio (∆QT‐to‐QT natural variability ratio). While both methods successfully detected the presence of hysteresis, they seem unlikely to be able to differentiate the extent of hysteresis between subjects.
4.5. Perspectives
As mentioned above, it remains to be clarified whether individual QT‐hys can be assumed as time‐invariant. It has been advocated that QT‐hys may differ between RR increase and decrease (Halamek, Jurak, Villa, et al., 2007a; Lau et al., 1988) or according to the method of RR variation (Halamek et al., 2007b) and that the extent of QT‐hys may be positively correlated with the rate of RR change (Pueyo et al., 2008). The influence of such variables on QT‐hys estimates remains to be examined to determine whether QT‐hys measurement can be robust to variations of measurement conditions and between‐subject variation of RR response to provocative testing.
In fact, the very mechanisms underlying QT‐hys are yet to be elucidated. Monophasic APD in the human ventricular muscle has been shown to require up to several minutes to adapt to a sudden change in pacing rate (Franz et al., 1988), which suggests that QT‐hys is mostly governed by the intrinsic electrophysiological properties of ventricular cells. This is consistent with a report of computer simulations suggesting that QT‐hys is driven by intracellular sodium concentration and Na+/K+ pump dynamics (Pueyo et al., 2010). However, other studies have suggested that QT‐hys may be related to cardiac autonomic modulation (Malik et al., 2013; Pelchovitz et al., 2012). As mentioned in a recent review article (Swenne, 2015), it is plausible that QT‐hys is in fact driven by both electrophysiological properties of heart cells and cardiac autonomic modulation. More insights into these mechanisms will be needed to determine the significance of QT‐hys.
It is conceivable that QT‐hys quantifiers may eventually be used as clinical biomarkers of cardiac diseases. Among reviewed studies, the most promising results in this respect were obtained in certain variants of the long QT syndrome (Chattha et al., 2010; Chauhan et al., 2004; Gao, Fang, Chiu‐Man, et al., 2007; Halamek et al., 2012; Krahn, Klein, & Yee, 1997; Krahn et al., 2002; Wong et al., 2010), in coronary artery disease (Lauer et al., 2006; Zhang et al., 2014), and in relation to arrhythmic risk (Pueyo et al., 2004; Trost, 2008). However, given the lack of consensus between studies and the heterogeneity of their methods, further studies are warranted so as to establish the clinical relevance of QT‐hys assessment. In particular, future studies of QT‐hys as a clinical biomarker must differentiate QT‐hys from steady‐state QT/RR dependency. Additionally, the question to be answered for a particular clinical condition may be better addressed by one mathematical model, whereas another model may lead to a better estimate to predict an outcome in a different clinical condition.
4.6. Conclusion
There is no consensus on an optimal method of QT/RR hysteresis quantification in the literature. Our critical review advocates for the use of model‐based estimation of memory (category III quantifiers). Such method appears to be the most versatile approach to QT‐hys assessment, as it allows separate quantification of QT/RR dependency and QT‐hys, and can be applied to a wider range of experimental settings. QT‐hys models with one memory parameter (exponential weights) are recommended as they have been thoroughly validated. Nevertheless, a rigorous application‐specific comparison of all methods would be desirable.
Gravel H, Curnier D, Dahdah N, Jacquemet V. Categorization and theoretical comparison of quantitative methods for assessing QT/RR hysteresis. Ann Noninvasive Electrocardiol. 2017;22:e12463 10.1111/anec.12463
Funding information
Hugo Gravel is supported by the Fonds de Recherche du Québec‐Santé (FRQS grant 30369)
REFERENCES
- Arnold, L. , Page, J. , Attwell, D. , Cannell, M. , & Eisner, D. A. (1982). The dependence on heart‐rate of the human ventricular action‐potential duration. Cardiovascular Research, 16, 547–551. [DOI] [PubMed] [Google Scholar]
- Attwell, D. , Cohen, I. , & Eisner, D. A. (1981). The effects of heart‐rate on the action‐potential of guinea‐pig and human ventricular muscle. Journal of Physiology‐London, 313, 439–461. [DOI] [PMC free article] [PubMed] [Google Scholar]
- Baumert, M. , Lambert, G. W. , Dawood, T. , Lambert, E. A. , Esler, M. D. , McGrane, M. , … Nalivaiko, E. (2008). QT interval variability and cardiac norepinephrine spillover in patients with depression and panic disorder. American Journal of Physiology‐Heart and Circulatory Physiology, 295, H962–H968. [DOI] [PubMed] [Google Scholar]
- Baumert, M. , Seeck, A. , Faber, R. , Nalivaiko, E. , & Voss, A. (2010). Longitudinal changes in QT interval variability and rate adaptation in pregnancies with normal and abnormal uterine perfusion. Hypertension Research, 33, 555–560. [DOI] [PubMed] [Google Scholar]
- Bazett, H. C. (1920). An analysis of the time relations of electrocardiograms. Heart, 7, 353–370. [Google Scholar]
- Bolea, J. , Almeida, R. , Pueyo, E. , Laguna, P. , & Caiani, E. G. (2013). Ventricular repolarization adaptation to abrupt changes in heart rate after microgravity simulation by 5‐day head‐down bed rest. Life in Space for Life on Earth Conference Proceedings, SP‐706, ID 36. [Google Scholar]
- Cabasson, A. , Meste, O. , & Vesin, J. M. (2012). Estimation and modeling of QT‐interval adaptation to heart rate changes. IEEE Transactions on Biomedical Engineering, 59, 956–965. [DOI] [PubMed] [Google Scholar]
- Cammarota, C. , & Curione, M. (2012). Time delay between RR and RT heart beat intervals assessed by trend extraction of exercise test data. Fluctuation and Noise Letters, 11, 1–18. [Google Scholar]
- Carmeliet, E. (1955). Effect of rhythm on the duration of the ventricular action potential. Archives Internationales de Physiologie et de Biochimie, 63, 222–232. [DOI] [PubMed] [Google Scholar]
- Chattha, I. S. , Sy, R. W. , Yee, R. , Gula, L. J. , Skanes, A. C. , Klein, G. J. , … Krahn, A. D. (2010). Utility of the recovery electrocardiogram after exercise: A novel indicator for the diagnosis and genotyping of long QT syndrome? Heart Rhythm: The Official Journal of the Heart Rhythm Society, 7, 906–911. [DOI] [PubMed] [Google Scholar]
- Chauhan, V. S. , Krahn, A. D. , Mitoff, P. , Klein, G. J. , Skanes, A. C. , & Yee, R. (2004). Sudden intense exercise increases QT heart rate slope and T wave complexity in long QT syndrome and normal subjects. Pace‐Pacing and Clinical Electrophysiology, 27, 1415–23. [DOI] [PubMed] [Google Scholar]
- Chauhan, V. S. , Krahn, A. D. , Walker, B. D. , Klein, G. J. , Skanes, A. C. , & Yee, R. (2002). Sex differences in QTc interval and QT dispersion: Dynamics during exercise and recovery in healthy subjects. American Heart Journal, 144, 858–864. [DOI] [PubMed] [Google Scholar]
- Chen, X. Z. , & Trayanova, N. A. (2012). A novel methodology for assessing the bounded‐input bounded‐output instability in QT interval dynamics: Application to clinical ECG with ventricular tachycardia. IEEE Transactions on Biomedical Engineering, 59, 2111–2117. [DOI] [PMC free article] [PubMed] [Google Scholar]
- Dajani, R. E. , Miquel, M. , Maison‐Blanche, P. , & Rubel, P. (2003). Time series prediction using parametric models and multilayer perceptrons: Case study on heart signals. Proceedings of the 2003 IEEE International Conference on Acoustics, Speech, and Signal Processing 2, II‐773‐776.
- Franz, M. R. , Swerdlow, C. D. , Liem, L. B. , & Schaefer, J. (1988). Cycle length dependence of human action potential duration in vivo: Effects of single extrastimuli, sudden sustained rate acceleration and deceleration, and different steady‐state frequencies. Journal of Clinical Investigation, 82, 972–979. [DOI] [PMC free article] [PubMed] [Google Scholar]
- Fridericia, L. S. (1920). Die systolendauer im elektrokardiogramm bei normalen menschen und bei herzkranken. Acta Medica Scandinavica, 53, 489–506. [Google Scholar]
- Gao, D. S. , Fang, W. Y. , Chiu‐Man, C. , Kirsh, J. , Gross, G. , & Hamilton, R. M. (2007). QT hysteresis in long QT syndrome children with exercise testing. Chinese Medical Journal, 120, 179–182. [PubMed] [Google Scholar]
- Grom, A. , Faber, T. S. , Brunner, M. , Bode, C. , & Zehender, M. (2005). Delayed adaptation of ventricular repolarization after sudden changes in heart rate due to conversion of atrial fibrillation: A potential risk factor for proarrhythmia? Europace, 7, 113–121. [DOI] [PubMed] [Google Scholar]
- Hadley, D. M. , Froelicher, V. F. , & Wang, P. J. (2011). A novel method for patient‐specific QTc: Modeling QT‐RR hysteresis. Annals of Noninvasive Electrocardiology, 16, 3–12. [DOI] [PMC free article] [PubMed] [Google Scholar]
- Halamek, J. , Couderc, J. P. , Jurak, P. , Vondra, V. , Zareba, W. , Viscor, I. , & Leinveber, P. (2012). Measure of the QT‐RR dynamic coupling in patients with the long QT syndrome. Annals of Noninvasive Electrocardiology, 17, 323–330. [DOI] [PMC free article] [PubMed] [Google Scholar]
- Halamek, J. , Jurak, P. , Bunch, T. J. , Lipoldova, J. , Novak, M. , Vondra, V. , … Asirvatham, S. J. (2010). Use of a novel transfer function to reduce repolarization interval hysteresis. Journal of Interventional Cardiac Electrophysiology, 29, 23–32. [DOI] [PubMed] [Google Scholar]
- Halamek, J. , Jurak, P. , Villa, M. , Novak, M. , Vondra, V. , Soucek, M. , … Ieee (2007a). Dynamic QT/RR coupling in patients with pacemakers. Proceedings of the Annual International Conference of the IEEE Engineering in Medicine and Biology Society, 2007, 919–922. [DOI] [PubMed] [Google Scholar]
- Halamek, J. , Jurak, P. , Villa, M. , Soucek, M. , Frana, P. , Nykodym, J. , … Kara, T. (2007b). Dynamic coupling between heart rate and ventricular repolarisation. Biomedizinische Technik, 52, 255–263. [DOI] [PubMed] [Google Scholar]
- Halamek, J. , Jurak, P. , Vondra, V. , Viscor, I. , Plachy, M. , & Leinveber, P. (2011). Excitation Specificity of Repolarization Parameters. Proceedings of the 2011 Annual International Conference of the IEEE Engineering in Medicine and Biology Society, 961‐964. [DOI] [PubMed]
- Hettinga, F. J. , Monden, P. G. , van Meeteren, N. L. , & Daanen, H. A. (2014). Cardiac acceleration at the onset of exercise: A potential parameter for monitoring progress during physical training in sports and rehabilitation. Sports Medicine, 44, 591–602. [DOI] [PubMed] [Google Scholar]
- Hnatkova, K. , Kowalski, D. , Keirns, J. J. , van Gelderen, E. M. , & Malik, M. (2014). QTc changes after meal intake: Sex differences and correlates. Journal of Electrocardiology, 47, 856–862. [DOI] [PubMed] [Google Scholar]
- Hnatkova, K. , Tomah, O. , Sisakova, M. , Novotny, T. , & Malik, M. (2010). Dynamic properties of selected repolarization descriptors. Journal of Electrocardiology, 43, 588–594. [DOI] [PubMed] [Google Scholar]
- Imam, M. H. , Karmakar, C. K. , Jelinek, H. F. , Palaniswami, M. , & Khandoker, A. H. (2016). Detecting subclinical diabetic cardiac autonomic neuropathy by analyzing ventricular repolarization dynamics. IEEE Journal of Biomedical and Health Informatics, 20, 64–72. [DOI] [PubMed] [Google Scholar]
- Jacquemet, V. , Dube, B. , Knight, R. , Nadeau, R. , LeBlanc, A. R. , Sturmer, M. , … Kus, T. (2011). Evaluation of a subject‐specific transfer‐function‐based nonlinear QT interval rate‐correction method. Physiological Measurement, 32, 619–635. [DOI] [PubMed] [Google Scholar]
- Jacquemet, V. , Gonzalez, R. C. , Sturmer, M. , Dube, B. , Sharestan, J. , Vinet, A. , … Nadeau, R. (2014). QT interval measurement and correction in patients with atrial flutter: A pilot study. Journal of Electrocardiology, 47, 228–235. [DOI] [PubMed] [Google Scholar]
- Kalb, S. S. , Dobrovolny, H. M. , Tolkacheva, E. G. , Idriss, S. F. , Krassowska, W. , & Gauthier, D. J. (2004). The restitution portrait: A new method for investigating rate‐dependent restitution. Journal of Cardiovascular Electrophysiology, 15, 698–709. [DOI] [PubMed] [Google Scholar]
- Kannankeril, P. J. , Harris, P. A. , Norris, K. J. , Warsy, I. , Smith, P. D. , & Roden, D. M. (2008). Rate‐independent QT shortening during exercise in healthy subjects: Terminal repolarization does not shorten with exercise. Journal of Cardiovascular Electrophysiology, 19, 1284–1288. [DOI] [PMC free article] [PubMed] [Google Scholar]
- Krahn, A. D. , Klein, E. J. , & Yee, R. (1997). Hysteresis of the RT interval with exercise: A new marker for the long QT syndrome? Circulation, 96, 1551–1556. [DOI] [PubMed] [Google Scholar]
- Krahn, A. D. , Yee, R. , Chauhan, V. , Skanes, A. C. , Wang, J. , Hegele, R. A. , & Klein, G. J. (2002). Beta blockers normalize QT hysteresis in long QT syndrome. American Heart Journal, 143, 528–534. [DOI] [PubMed] [Google Scholar]
- Lau, C. P. , Freedman, A. R. , Fleming, S. , Malik, M. , Camm, A. J. , & Ward, D. E. (1988). Hysteresis of the ventricular paced QT interval in response to abrupt changes in pacing rate. Cardiovascular Research, 22, 67–72. [DOI] [PubMed] [Google Scholar]
- Lauer, M. S. , Pothier, C. E. , Chernyak, Y. B. , Brunken, R. , Lieber, M. , Apperson‐Hansen, C. , & Starobin, J. M. (2006). Exercise‐induced QT/RR‐interval hysteresis as a predictor of myocardial ischemia. Journal of Electrocardiology, 39, 315–323. [DOI] [PubMed] [Google Scholar]
- Lewis, M. J. , & Short, A. L. (2006). Hysteresis of electrocardiographic depolarization‐repolarization intervals during dynamic physical exercise and subsequent recovery. Physiological Measurement, 27, 191–201. [DOI] [PubMed] [Google Scholar]
- Malik, M. (2014). QT/RR hysteresis. Journal of Electrocardiology, 47, 236–239. [DOI] [PubMed] [Google Scholar]
- Malik, M. , Farbom, P. , Batchvarov, V. , Hnatkova, K. , & Camm, A. J. (2002). Relation between QT and RR intervals is highly individual among healthy subjects: Implications for heart rate correction of the QT interval. Heart, 87, 220–228. [DOI] [PMC free article] [PubMed] [Google Scholar]
- Malik, M. , Hnatkova, K. , Kowalski, D. , Keirns, J. J. , & van Gelderen, E. M. (2012). Importance of subject‐specific QT/RR curvatures in the design of individual heart rate corrections of the QT interval. Journal of Electrocardiology, 45, 571–581. [DOI] [PubMed] [Google Scholar]
- Malik, M. , Hnatkova, K. , Kowalski, D. , Keirns, J. J. , & van Gelderen, E. M. (2013). QT/RR curvatures in healthy subjects: Sex differences and covariates. American Journal of Physiology‐Heart and Circulatory Physiology, 305, H1798–H1806. [DOI] [PMC free article] [PubMed] [Google Scholar]
- Malik, M. , Hnatkova, K. , Novotny, T. , & Schmidt, G. (2008). Subject‐specific profiles of QT/RR hysteresis. American Journal of Physiology‐Heart and Circulatory Physiology, 295, H2356–H2363. [DOI] [PubMed] [Google Scholar]
- Malik, M. , Hnatkova, K. , Schmidt, A. , & Smetana, P. (2008). Accurately measured and properly heart‐rate corrected QTc intervals show little daytime variability. Heart Rhythm: the Official Journal of the Heart Rhythm Society, 5, 1424–1431. [DOI] [PubMed] [Google Scholar]
- Malik, M. , Hnatkova, K. , Schmidt, A. , & Smetana, P. (2009a). Correction for QT/RR hysteresis in the assessment of drug‐induced QTc changes: Cardiac safety of gadobutrol. Annals of Noninvasive Electrocardiology, 14, 242–250. [DOI] [PMC free article] [PubMed] [Google Scholar]
- Malik, M. , Hnatkova, K. , Schmidt, A. , & Smetana, P. (2009b). Electrocardiographic QTc changes due to moxifloxacin infusion. Journal of Clinical Pharmacology, 49, 674–683. [DOI] [PubMed] [Google Scholar]
- Malik, M. , Johannesen, L. , Hnatkova, K. , & Stockbridge, N. (2016). Universal correction for QT/RR hysteresis. Drug Safety, 39, 577–588. [DOI] [PubMed] [Google Scholar]
- Malik, M. , van Gelderen, E. M. , Lee, J. H. , Kowalski, D. L. , Yen, M. , Goldwater, R. , … Keirns, J. J. (2012). Proarrhythmic safety of repeat doses of mirabegron in healthy subjects: A randomized, double‐blind, placebo‐, and active‐controlled thorough QT study. Clinical Pharmacology and Therapeutics, 92, 696–706. [DOI] [PubMed] [Google Scholar]
- Minchole, A. , Bueno‐Orovio, A. , Laguna, P. , Pueyo, E. , & Rodriguez, B. (2015). ECG‐based estimation of dispersion of APD restitution as a tool to stratify sotalol‐induced arrhythmic risk. Journal of Electrocardiology, 48, 867–873. [DOI] [PMC free article] [PubMed] [Google Scholar]
- Minchole, A. , Pueyo, E. , Rodriguez, J. F. , Zacur, E. , Doblare, M. , & Laguna, P. (2011). Quantification of restitution dispersion from the dynamic changes of the T‐wave peak to end, measured at the surface ECG. IEEE Transactions on Biomedical Engineering, 58, 1172–1182. [DOI] [PubMed] [Google Scholar]
- Minchole, A. , Zacur, E. , Pueyo, E. , & Laguna, P. (2014). Modeling and quantification of repolarization feature dependency on heart rate. Methods of Information in Medicine, 53, 324–328. [DOI] [PubMed] [Google Scholar]
- Moher, D. , Liberati, A. , Tetzlaff, J. , Altman, D. G. , & The, P. G. (2009). Preferred reporting items for systematic reviews and meta‐analyses: The PRISMA statement. PLoS Medicine, 6, e1000097. [DOI] [PMC free article] [PubMed] [Google Scholar]
- Ng, F. , Wong, S. , Mora, F. , Passariello, G. , & Almeida, D. (1998). Diagnostic value of QT interval hysteresis loop in coronary artery disease. Computers in Cardiology, 25, 417–420. [Google Scholar]
- Padfield, G. J. , Escudero, C. A. , DeSouza, A. M. , Steinberg, C. , Gibbs, K. , Puyat, J. H. , … Krahn, A. D. (2016). Characterization of myocardial repolarization reserve in adolescent females with anorexia nervosa. Circulation, 133, 557–565. [DOI] [PubMed] [Google Scholar]
- Pelchovitz, D. J. , Ng, J. , Chicos, A. B. , Bergner, D. W. , & Goldberger, J. J. (2012). QT‐RR hysteresis is caused by differential autonomic states during exercise and recovery. American Journal of Physiology‐Heart and Circulatory Physiology, 302, H2567–H2573. [DOI] [PMC free article] [PubMed] [Google Scholar]
- Pueyo, E. , Husti, Z. , Hornyik, T. , Baczko, I. , Laguna, P. , Varro, A. , & Rodriguez, B. (2010). Mechanisms of ventricular rate adaptation as a predictor of arrhythmic risk. American Journal of Physiology‐Heart and Circulatory Physiology, 298, H1577–H1587. [DOI] [PubMed] [Google Scholar]
- Pueyo, E. , Malik, M. , & Laguna, P. (2008). A dynamic model to characterize beat‐to‐beat adaptation of repolarization to heart rate changes. Biomedical Signal Processing and Control, 3, 29–43. [Google Scholar]
- Pueyo, E. , Smetana, P. , Caminal, P. , de Luna, A. B. , Malik, M. , & Laguna, P. (2004). Characterization of QT interval adaptation to RR interval changes and its use as a risk‐stratifier of arrhythmic mortality in amiodarone‐treated survivors of acute myocardial infarction. IEEE Transactions on Biomedical Engineering, 51, 1511–1520. [DOI] [PubMed] [Google Scholar]
- Pueyo, E. , Smetana, P. , Laguna, P. , & Malik, M. (2003). Estimation of the QT/RR hysteresis lag. Journal of Electrocardiology, 36, 187–190. [DOI] [PubMed] [Google Scholar]
- Raeder, E. A. , Albrecht, P. , Perrott, M. , & Cohen, R. J. (1995). Kinetics of cycle length dependence of ventricular repolarization: Effect of autonomic blockade. Journal of Cardiovascular Electrophysiology, 6, 163–169. [DOI] [PubMed] [Google Scholar]
- Ramirez, J. , Laguna, P. , de Luna, A. B. , Malik, M. , & Pueyo, E. (2014). QT/RR and T‐peak‐to‐end/RR curvatures and slopes in chronic heart failure: Relation to sudden cardiac death. Journal of Electrocardiology, 47, 842–848. [DOI] [PubMed] [Google Scholar]
- Ramirez, J. , Minchole, A. , Laguna, P. , & Pueyo, E. (2012). Characterization of cardiac repolarization response to heart rate changes provoked by a tilt test. Computing in Cardiology (Cinc), 39, 673–676. [Google Scholar]
- Razak, E. , Buncova, M. , Shusterman, V. , Winter, B. , Shen, W.‐K. , Ackerman, M. J. , … Nemec, J. (2011). Slow QT interval adaptation to heart rate changes in normal ambulatory subjects. Annals of Noninvasive Electrocardiology, 16, 148–155. [DOI] [PMC free article] [PubMed] [Google Scholar]
- Rickards, A. F. , & Norman, J. (1981). Relation between QT interval and heart rate: New design of physiologically adaptive cardiac pacemaker. British Heart Journal, 45, 56–61. [DOI] [PMC free article] [PubMed] [Google Scholar]
- Sagie, A. , Larson, M. G. , Goldberg, R. J. , Bengtson, J. R. , & Levy, D. (1992). An improved method for adjusting the QT interval for heart rate (the Framingham Heart Study). American Journal of Cardiology, 70, 797–801. [DOI] [PubMed] [Google Scholar]
- Sarma, J. S. M. , Venkataraman, K. , Samant, D. R. , & Gadgil, U. (1987). Hysteresis in the human RR‐QT relationship during exercise and recovery. Pace‐Pacing and Clinical Electrophysiology, 10, 485–491. [DOI] [PubMed] [Google Scholar]
- Seed, W. A. , Noble, M. I. M. , Oldershaw, P. , Wanless, R. B. , Drakeholland, A. J. , Redwood, D. , … Mills, C. (1987). Relation of human cardiac action potential duration to the interval between beats: Implications for the validity of rate corrected QT interval (QTc). British Heart Journal, 57, 32–37. [DOI] [PMC free article] [PubMed] [Google Scholar]
- Seethala, S. , Shusterman, V. , Saba, S. , Mularski, S. , & Nemec, J. (2011). Effect of beta‐adrenergic stimulation on QT interval accommodation. Heart Rhythm: the Official Journal of the Heart Rhythm Society, 8, 263–270. [DOI] [PubMed] [Google Scholar]
- Smetana, P. , Pueyo, E. , Hnatkova, K. , Batchvarov, V. , Laguna, P. , & Malik, M. (2004). Individual patterns of dynamic QT/RR relationship in survivors of acute myocardial infarction and their relationship to antiarrhythmic efficacy of amiodarone. Journal of Cardiovascular Electrophysiology, 15, 1147–1154. [DOI] [PubMed] [Google Scholar]
- Swan, H. , Toivonen, L. , & Viitasalo, M. (1998). Rate adaptation of QT intervals during and after exercise in children with congenital long QT syndrome. European Heart Journal, 19, 508–513. [DOI] [PubMed] [Google Scholar]
- Swan, H. , Viitasalo, M. , Piippo, K. , Laitinen, P. , Kontula, K. , & Toivonen, L. (1999). Sinus node function and ventricular repolarization during exercise stress test in long QT syndrome patients with KvLQT1 and HERG potassium channel defects. Journal of the American College of Cardiology, 34, 823–829. [DOI] [PubMed] [Google Scholar]
- Swenne, C. A. (2015). Mechanisms of exercise‐recovery hysteresis in the ECG: ISCE 2015 paper. Journal of Electrocardiology, 48, 1006–1009. [DOI] [PubMed] [Google Scholar]
- Toivonen, L. , Helenius, K. , & Viitasalo, M. (1997). Electrocardiographic repolarization during stress from awakening on alarm call. Journal of the American College of Cardiology, 30, 774–779. [DOI] [PubMed] [Google Scholar]
- Trost, D. C. (2008). A method for constructing and estimating the RR‐memory of the QT‐interval and its inclusion in a multivariate biomarker for torsades de pointes risk. Journal of Biopharmaceutical Statistics, 18, 773–796. [DOI] [PubMed] [Google Scholar]
- Vainer, J. , Vandersteld, B. , Smeets, J. , Gorgels, A. P. M. , Sreeram, N. , & Wellens, H. J. J. (1994). Beat‐to‐beat behavior of QT interval during conducted supraventricular rhythm in the normal heart. Pace‐Pacing and Clinical Electrophysiology, 17, 1469–1476. [DOI] [PubMed] [Google Scholar]
- Wong, J. A. , Gula, L. J. , Klein, G. J. , Yee, R. , Skanes, A. C. , & Krahn, A. D. (2010). Utility of treadmill testing in identification and genotype prediction in long QT syndrome. Circulation‐Arrhythmia and Electrophysiology, 3, 120–125. [DOI] [PubMed] [Google Scholar]
- Yamada, A. , Hayano, J. , Horie, K. , Ieda, K. , Mukai, S. , Yamada, M. , & Fujinami, T. (1993). Regulation of QT interval during postural transitory changes in heart rate in normal subjects. American Journal of Cardiology, 71, 996–998. [DOI] [PubMed] [Google Scholar]
- Zhang, Y. , Bao, M. , Dai, M. , Zhong, H. , Li, Y. , & Tan, T. (2014). QT hysteresis index improves the power of treadmill exercise test in the screening of coronary artery disease. Circulation Journal, 78, 2942–2949. [DOI] [PubMed] [Google Scholar]