Abstract
Background
Contemporary electrocardiographic (ECG) markers including ventricular ectopy and arrhythmias have not proved reliable in risk assessment for life‐threatening arrhythmias.
Methods
We developed the “Multilead ECG Template‐Derived Residua” approach to remove intrinsic morphologic differences and allow calculation of pathologic ECG heterogeneities among spatially separated leads. Prediction by R‐wave and T‐wave heterogeneity (RWH, TWH) analysis was tested in simulated and clinical ECGs.
Results
An enabling description of the Residua algorithm is provided. Simulated ECGs with but not without Residua produced a linear relationship (correlation coefficient r2 = 0.999) between input and output RWH and TWH values. In heart failure patients, Residua disclosed a marked crescendo in RWH from 164.1 ± 33.1 at baseline to 299.8 ± 54.5 μV and TWH from 134.5 ± 20.6 at baseline to 239.2 ± 37.0 μV at 30–45 minutes before the arrhythmia (both, P < 0.05), which remained elevated until arrhythmia onset. Without Residua, mean RWH and TWH were elevated at 1061.0 ± 222.9 and 882.5 ± 375.2 μV, respectively, throughout the recording and were not different prior to ventricular tachycardia onset.
Conclusions
Calculation of ECG‐template derived Residua provides a highly accurate means for assessing arrhythmia risk from standard ECGs. Potential widespread applications include resting diagnostic 12‐lead, ambulatory, and exercise ECGs, electrophysiologic study laboratory recordings, and implantable devices.
Keywords: repolarization, depolarization, heterogeneity, risk stratification, ventricular tachycardia, ventricular fibrillation
Identification of individuals who are at risk for sudden cardiac death due to life‐threatening arrhythmias persists as a major public health challenge, as ∼424,000 cardiac arrests occur in the United States annually due to this electrical disorder of heart rhythm.1 Sudden cardiac death accounts for at least half of all cardiovascular deaths and in >50% of cases, it is the first manifestation of underlying cardiovascular disease.1, 2 While effective therapies in the form of medications3 and implantable defibrillators4 can reduce risk for sudden death, it is essential first to identify individuals who may benefit from these advances. To date, standard electrocardiographic (ECG) markers including ventricular ectopy or arrhythmias, appear to be of low or relatively moderate value in detecting risk for sudden cardiac death.5
Considerable evidence indicates that analysis of subtle variations in ECG waveform morphology, including T‐wave heterogeneity (TWH),6 T‐wave variability,7 and T‐wave alternans (TWA)8, 9 may reveal arrhythmia risk. However, intrinsic morphology differences among ECG waveforms in the standard leads may mask arrhythmogenic ECG morphology changes. Complex influences including impedance and vector cancellation of ECG signals contribute to differences in the projected amplitude of the signals to the body surface. Thus, detection of microvolt levels of ECG morphology changes that are associated with disease states such as myocardial ischemia, acute coronary syndrome, or heart failure may be difficult and imprecise.
We developed a novel approach to remove intrinsic morphology differences from ECG complexes that can be implemented on standard ECG recording devices. The analytical process, termed “Multilead ECG Template‐Derived Residua,” creates a baseline median‐beat template for each lead based on a limited number of ECG complexes and subtracts this template from the beat stream to determine the morphologic changes that are potentially arrhythmogenic. The current manuscript provides an enabling description of the “Residua” approach, which was used to demonstrate that depolarization and repolarization heterogeneity can detect crescendos in cardiac electrical instability that forewarn of impending ventricular arrhythmias in clinical ECGs.10
MATERIALS AND METHODS
Computation of Multilead ECG Template‐Derived Residua
This process entails computing the median‐beat sequence for each ECG lead from a baseline segment: Bi,n(t) for n = 1…N beats and i = 1…M ECG signals, where M = all ECG leads. The baseline segment in each lead contains nonpathologic morphologies and is recorded during a period of quiet rest when morphology differences are minimum. The sequence starts with the first beat, and each successive beat then contributes a limited amount to the median‐beat computation in each ECG lead.
The multilead ECG residuum for each lead is calculated by reiterating the baseline median‐beat Bi,N (t) template and superimposing and subtracting this waveform on a beat‐to‐beat basis from the later beat stream to remove intrinsic differences in ECG morphology in all leads from each beat, ECGi(t). The value of delta is computed as the difference between the next beat and the last value of the median divided by 8. If the new beat is larger than the median, then the median is increased by the difference divided by 8. If the difference is <1, then the increase is = 1. If the difference is >32, then the increase is = 32. If the new beat is smaller than the median, then the median is decreased by the difference divided by 8. If the difference is <−1, then the decrease is = −1. If the difference is >−32, then the decrease is = −32. The factor of 8 reduces the effect that any one beat can have on the median, while the factor of 32 limits the effect that any one outlier can have on the median.
Once the morphology of this median‐beat template is removed, the remaining morphology differences are captured in the ECG Residua, the ei(t) signals. Various characteristics of the Residua can then be analyzed.
Assessment of RWH and TWH with Multilead ECG Median‐Beat Template‐Derived Residua
The utility of ECG Residua was examined by analyzing depolarization (R wave) and repolarization (T wave) heterogeneity (RWH, TWH) analysis to illustrate its capacity to allow arrhythmia prediction (Fig. 1). RWH and TWH were analyzed both with and without the multilead median‐beat template and Residua.
Figure 1.
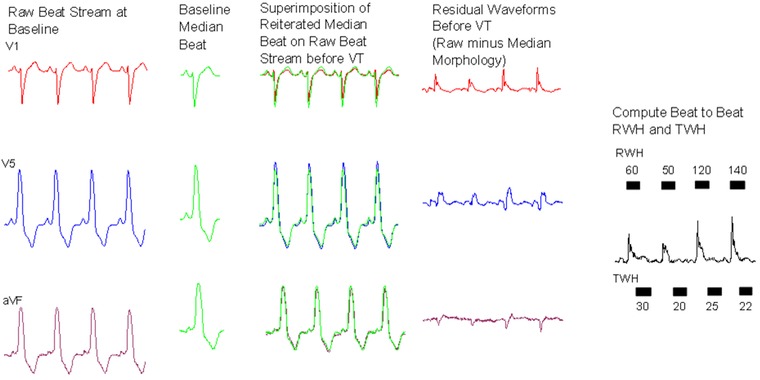
Process for generation of multilead ECG median‐beat template and calculation of ECG Residua in a representative heart failure patient. Raw baseline beats (first panel) are identified during a period of quiescence and are averaged to generate a median beat for each lead (second panel), which exhibits the intrinsic morphology of each lead. The median beat for each lead is reiterated and aligned to QRS complexes in each beat in the ECG recording stream prior to VT (third panel). The median beat is subtracted from the ECG recording stream to isolate the arrhythmogenic differences in beat morphology. This remainder constitutes the ECG Residua (fourth panel). In this example, RWH and TWH are then computed for each beat using second central moment analysis as the peak variance within the ECG Residua among all leads (fifth panel).
Accordingly, the square root of the second central moment of simultaneous R waves and T waves from each lead was computed to quantify RWH and TWH as variability about the mean morphology of the ECG Residua. The following fiducial points were used to identify the R and T waves: QRS was detected by a matched filter algorithm used by the MARS system. The QRS onset was detected when the QRS deflection rose to 10% of R‐wave peak. J Point was detected when the QRS offset returned to 10% deviation of R‐wave peak. The end of T wave was found by first determining the maximum slope of the second half of the T wave. A tangent line was drawn at the point of maximum slope and with a slope equal to the maximum slope. The end of T wave was found as the point where this line intersected with the level of the isoelectric baseline.
Specifically, R‐wave position was identified and an average waveform was computed on a point‐by‐point basis in each lead, where
Then, the second central moment of the R and T waves was calculated from the Residua by taking the mean‐square deviation of the waveforms about the average waveform:
RWH was then calculated as the maximum square root of the second central moment of the Residua occurring within the QRS duration, from the beginning of the Q wave to the J point, on a beat‐to‐beat basis:
TWH was then calculated as the maximum square root of the second central moment of the Residua occurring within the JT interval, approximately from 60 to 290 ms after the R wave, on a beat‐to‐beat basis:
The maximum RWH and TWH results were output for each beat and averaged for each 15‐sec interval. Trend reports of maximum RWH and TWH values were generated.
Validation of Multilead ECG Template‐Derived Residua
Simulated ECGs
The utility of the multilead ECG Residua to improve the accuracy of the RWH and TWH calculation was tested with simulated ECGs generated by a C++ program, with P, R, and T waves and ST segments approximated by geometric shapes whose relative timing and amplitude were similar to surface ECGs (Fig. 2).
Figure 2.
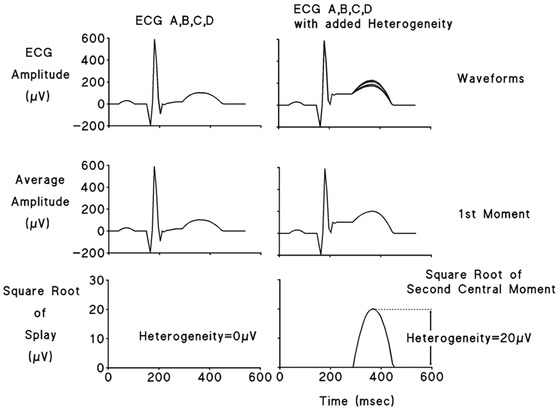
R‐wave and T‐wave heterogeneity computation in simulated ECGs. Four‐lead (A,B,C,D) simulated ECGs without (left panels) and with 20 μV (right panels) of added T‐wave heterogeneity (TWH) are depicted. The first moment of the waveform is generated in each case as its average amplitude (middle panels). The second moment is computed as the square root of the waveform splay in microvolts about the average amplitude. Lower panels depict TWH of zero (left panel) and of 20 μV (right panel).
Analysis of ECGs from Heart Failure Patients
The improvement by multilead ECG Residua in ventricular arrhythmia prediction by RWH and TWH was examined in clinical ambulatory ECG recordings obtained in hospitalized patients with nonsustained ventricular tachycardia (VT).10 The Prospective Randomized Evaluation of Cardiac Ectopy with Dobutamine or Nesiritide Therapy (PRECEDENT) trial (http://www.clinicaltrials.org NCT00270400) enrolled 255 patients aged ≥18 years with NYHA class III or IV congestive heart failure and symptomatic, decompensated congestive heart failure for which inpatient, single‐agent, intravenous therapy with either nesiritide or dobutamine was deemed appropriate. All patients were monitored by ambulatory ECG recording for the 24‐hour prerandomization period immediately before the start of the study drug. The 3‐channel (leads V1, V5, and aVF) recordings were scanned with a commercially available ambulatory ECG reader (Zymed model 2010; Philips Medical Systems, Andover, MA, USA), archived on compact disks, and made available for analysis on a MARS‐PC Holter Monitoring System (GE Medical Systems, Milwaukee, WI, USA).
Ambulatory ECGs recorded during the prerandomization phase of the PRECEDENT trial were analyzed from all 22 patients who experienced a single bout of VT (≥4 beats at heart rates of >100 beats/min) following 120 minutes of stable sinus rhythm and without atrial fibrillation, VT, or other rhythm disturbances. The Beth Israel Deaconess Medical Center Committee on Clinical Investigations certified the exempt status of this reanalysis of existing data from a completed clinical trial under exemption number 4 of the Code of Federal Regulations, 45 CFR 46.101(b).
The continuous ECGs were analyzed with and without correction by ECG Residua in leads V1, V5, and aVF. The baseline ECG median‐beat template for each lead was generated from ECGs at 60–75 minutes before the arrhythmia and subtracted from the recordings at 0–60 minutes prior to the arrhythmia. The averaged residuum for each lead is depicted (Fig. 1). Then, RWH and TWH were computed as the square root of the sum of the squares of the differences among the ECG Residua for each 15‐second interval. RWH is the maximum heterogeneity occurring in the interval from the beginning of the Q wave to the end of the S wave. TWH is the maximum heterogeneity occurring in the interval between the J point and the end of the T wave. Peak RWH and TWH levels were averaged for 15‐minute epochs.
Statistics
Correlation coefficients of input‐output relationships in simulated ECGs were calculated by Pearson's coefficient. RWH and TWH levels at 45–60, 30–45, 15–30, and 0–15 minutes were compared with baseline at 60–75 minutes before the onset of the arrhythmia in PRECEDENT trial patients by ANOVA with Tukey test for multiple comparisons (P < 0.05).
RESULTS
Algorithm Validation Testing
The RWH and TWH algorithm accurately tracked inhomogeneities in R‐wave and T‐wave morphology in simulated ECGs when multilead ECG Template‐Derived Residua were used but not in their absence. With the Residua, we observed a linear relationship between the input and output values of RWH (range: 0–538 μV) and TWH (0–156 μV) estimated by second central moment analysis with a correlation coefficient of r2 = 0.999 (P < 0.001) (Fig. 3). Without Residua, RWH output remained at >1500 μV and TWH output at 450 μV and did not correlate with input values.
Figure 3.
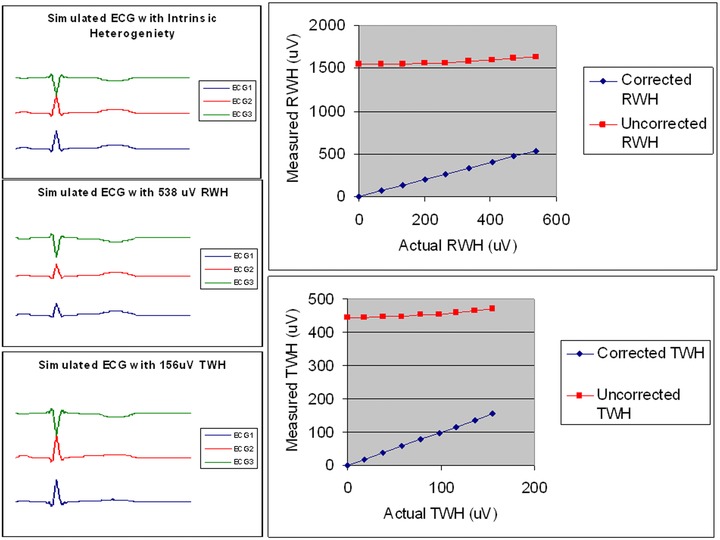
Validation of input‐output relationships. Calculation of R‐wave and T‐wave heterogeneity (RWH, TWH) were analyzed with and without correction by multilead ECG median‐beat templates and Residua. Upper left: Simulated ECGs (1,2,3) with 0 μV of RWH and TWH. Middle left: Simulated ECGs with 538 μV of RWH. Lower left: Simulated ECGs with 156 μV of TWH. Right panels: Results of input‐output testing in simulated ECGs with varying degrees of RWH (upper right) and TWH (lower right) with (“corrected”) and without (“uncorrected”) ECG Residua. When the RWH and TWH were calculated from the ECG Residua, the actual and measured RWH and TWH were highly correlated (r2 = 0.999) but without the Residua, RWH and TWH input levels were not correlated.
Ambulatory ECG‐Based Testing of ECG Heterogeneity in Heart Failure Patients with and without Multilead ECG Template‐Derived Residua
With ECG Template‐Derived Residua
When the multilead ECG median‐beat template was used and the associated Residua were used for RWH and TWH calculation, a marked crescendo in these parameters was observed prior to VT of 4–19 beats averaging 6.6 ± 0.1 beats (means ± SEM) (Figs. 4 and 5). RWH across leads V1, V5, and aVF rose from 164.1 ± 33.1 μV at baseline to 299.8 ± 54.5 μV at 30–45 minutes before the arrhythmia (P < 0.05). Meanwhile, TWH across leads V1, V5, and aVF rose from 134.5 ± 20.6 μV at baseline to 239.2 ± 37.0 μV at 30–45 minutes before the arrhythmia (P < 0.05). In 20 of 22 (91%) patients, RWH and TWH remained elevated before onset of nonsustained VT. In the remaining two patients, the fluctuations in RWH and TWH were relatively minor. Although the extent of change varied among patients, the crescendo pattern in ECG heterogeneity before VT was consistent, as group data indicated elevated RWH and TWH at 289.5 ± 45.9 and 230.9 ± 24.7 μV, respectively (P < 0.05 compared to baseline). Pearson correlation coefficient comparing RWH and TWH maxima was 0.51 (P = 0.01). Heart rates were stable, averaging 87.0 ± 4.8 beats/min at baseline and 86.1 ± 4.6 beats/min at 0–15 minutes before VT (NS).
Figure 4.
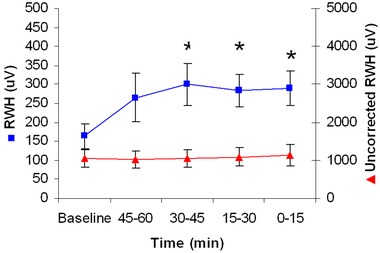
Increase in depolarization heterogeneity (RWH) before ventricular tachycardia (VT) with and without multilead ECG Residua in the 22 PRECEDENT trial patients studied. RWH based on the Residua (boxes, left y‐axis) increased significantly at 30–45 minutes prior to VT and remained elevated until its onset (*P < 0.05). RWH based on the beat stream rather than on the Residua was elevated and showed no significant changes during the entire 75‐minute analysis period (triangles, right y‐axis).
Figure 5.
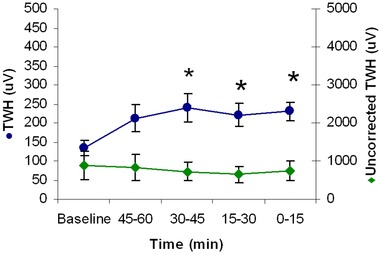
Increase in repolarization heterogeneity (TWH) before ventricular tachycardia (VT) with and without multilead ECG Residua in the 22 PRECEDENT trial patients studied. TWH based on the Residua (circles, left y‐axis) increased significantly at 30–45 minutes prior to VT and remained elevated until its onset (*P < 0.05). TWH based on the beat stream rather than on the Residua was elevated and showed no significant changes during the entire 75‐minute analysis period (diamonds, right y‐axis).
Without ECG Template‐Derived Residua
Without employing ECG Residua, the levels of both RWH (Fig. 4) and TWH (Fig. 5) during the initial baseline period were 1061.0 ± 222.9 μV for RWH and 882.5 ± 375.2 μV for TWH and were not statistically different at the time of onset of VT.
Temporal Stability of RWH and TWH
Variations in these parameters across time were also evaluated. Patients who experienced VT experienced a marked increase in RWH and TWH prior to the arrhythmia, but in patients without VT, these parameters were unchanged at the same time of day (Fig. 6, upper and middle panels). Heart rate was unchanged in patients with and without VT (Fig. 6, bottom panel).
Figure 6.
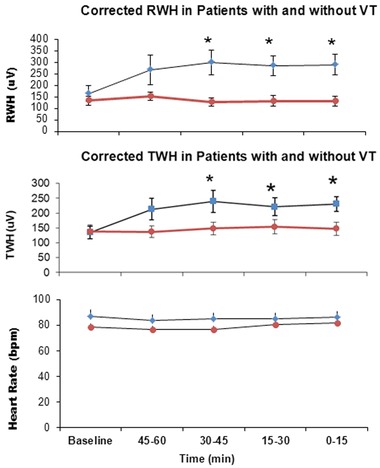
Variations in RWH (upper panel) and TWH (middle panel). In patients without VT (red line graph) (N = 22), RWH and TWH were unchanged, as compared to patients with VT (blue line graph) (N = 22) at the same time of day. Heart rate (lower panel) was unchanged in both groups (blue line graph = with VT; red line graph = without VT).
DISCUSSION
The main goal of this investigation was to test a novel methodology for extracting subtle, arrhythmogenic signals contained within the standard ECG. To separate these biologically significant microvolt‐level changes from the intrinsic differences in ECG morphology among spatially separated leads, a multilead ECG median‐beat template was developed for each lead and subtracted from the beat stream. The remaining morphology constitutes the ECG Residua. The utility of multilead ECG median‐beat template and Residua to allow arrhythmia prediction was evaluated in association with RWH and TWH analysis. With but not without the multilead median‐beat template and Residua, RWH and TWH input‐output levels were highly correlated in simulated ECGs and clinical levels in PRECEDENT continuous ECGs were highly predictive of impending ventricular arrhythmias in patients hospitalized with acute, decompensated heart failure.
Previous Studies
Extensive experimental and clinical studies support a close linkage between depolarization and repolarization heterogeneity and risk for life‐threatening ventricular arrhythmias.6, 8, 11, 12, 13, 14, 15 Using invasive isopotential maps in canines undergoing acute myocardial ischemia, Konta and coworkers13 provided evidence of an intimate relationship between temporospatial heterogeneity of cardiac electrical activity and the genesis of arrhythmia. Shusterman and colleagues8 demonstrated that electrophysiological inhomogeneities increased before VT among patients enrolled in the Electrophysiologic Study versus Electrocardiographic Monitoring (ESVEM) trial (NCT 00000518). Chauhan and coworkers determined that ventricular repolarization heterogeneity is greater among cardiomyopathy patients vulnerable to ventricular arrhythmias than in a similar population not vulnerable to ventricular arrhythmias. Selvaraj and associates15 reported spatiotemporal ECG heterogeneity and discordant TWA in epicardial and endocardial electrograms in patients with cardiomyopathy and VT.
This extensive body of information prompted a search for noninvasive measures to assess ECG heterogeneity. Day and coworkers16 focused on QT dispersion, which entails measurement of the maximum difference between the shortest and longest QT intervals among 12‐lead ECG surface leads. Although initially the approach seemed promising, the current view is that this parameter is not reliable, in part because of the inherent difficulties in making an accurate QT measurement, due to uncertain termination point of the T wave and the presence of U waves.5 Disagreements over appropriate heart‐rate correction algorithms have also undermined confidence in this methodology.
This need for improved arrhythmia risk assessment led us to develop a methodology to assess arrhythmogenic differences in ECG morphology across the entire waveform. Analyzing signals from closely spaced leads on the epicardium of canines revealed that increases in the magnitude of TWH, calculated as the second central moment, or splay, in T‐wave amplitude about the mean morphology of the waveform, strongly predicted ischemia‐induced ventricular fibrillation.6 TWH is an improvement over the conventional QT‐interval length and dispersion analyses in that heterogeneity is assessed throughout the entire waveform and the measurement is not unduly weighted by protracted termination or inflections in the T wave, biphasic forms, ST‐segment changes, or the presence of U waves. Electrograms from these proximate leads were similar and did not require development of the multilead ECG median‐beat template or calculation of Residua to allow TWH analysis. ST‐segment changes did not predict arrhythmia. Heart rate was maintained constant and thus was not a factor in the results. However, implementation of this technique clinically was difficult and required further development.
In our recent study in patients hospitalized with heart failure,10 we corrected RWH and TWH values for intrinsic differences in morphology of signals from ambulatory ECG leads V1, V5, and aVF and found that the process of subtracting a baseline median‐beat template from later ECG segments disclosed ECG heterogeneity changes during both depolarization and repolarization that heralded the onset of VT. The present report provides an original, enabling description of this new parameter, which we termed “Multilead ECG Template‐Derived Residua.” This report also provides simulated and clinical validation data for the algorithm. When multilead ECG residua were not used, RWH and TWH in standard ambulatory ECG leads were not predictive. The moderate level of correlation between RWH and TWH (Pearson correlation coefficient, 0.51, P = 0.01) suggests that these variables may differ in relation to arrhythmia onset as a result of pathological changes in myocardial substrate of individual patients.
Potential Applications
Because ECG recordings are mainstay procedures whenever individuals are in contact with the medical care system, the approach has the potential applications in screening for individuals who could benefit from antiarrhythmic medical and device‐based therapy. The technology is suitable for broad use in routine monitoring in the community and in hospital acute care settings such as resting diagnostic 12‐lead ECGs, and ambulatory and exercise ECGs, as well as ECGs from the electrophysiologic study laboratory. Residua can also support calculation of arrhythmogenic ECG morphology changes in implantable devices either by incorporation into the devices themselves or into device interrogation technology.
Limitations
In the present cohort, heart rate was unchanged and thus was not a factor in the observed measurement of RWH and TWH. However, under other physiologic conditions, heart rate could change markedly. Because determination of residua is based on evaluation of the amplitude within the prescribed waveforms for depolarization and repolarization, with carefully defined fiducial points, it is relatively insensitive to changes in heart rate. Nevertheless, in subsequent investigations, it will be informative to examine this aspect systematically. Also, the positive and negative predictive values of RWH and TWH require further investigation.
Conclusions and Implications
A novel methodology has been developed that permits assessment of subtle, pathophysiologically significant differences within the waveforms of standard ECG recordings. Development of the multilead ECG median‐beat template and calculation of ECG Residua permit removal of intrinsic morphologies from ECG beat stream to disclose the residual fluctuations, which may be arrhythmogenic. If the present results, which indicate improved prediction of ventricular arrhythmias in heart failure patients, were demonstrated in a larger database and in populations with other forms of cardiac disease, then an important step forward could be realized in identification of individuals at risk for sudden cardiac death. As the technique is amenable to high‐throughput processing for use in diverse medical devices, including both in‐ and out‐of‐hospital settings, then arrhythmia risk stratification would be improved and become more widely available.17
Financial support: No funding was provided for execution of this study or preparation of this manuscript. The authors declare no conflicts of interest.
REFERENCES
- 1. Go AS, Mozaffarian D, Roger VL, et al. Heart disease and stroke statistics—2014 update: A report from the American Heart Association. Circulation 2014;129:e28–e292. [DOI] [PMC free article] [PubMed] [Google Scholar]
- 2. Huikuri HV, Castellanos A, Myerburg RJ. Sudden death due to cardiac arrhythmias. N Engl J Med 2001;345:1473–1482. [DOI] [PubMed] [Google Scholar]
- 3. Das M, Zipes DP. Antiarrhythmic and nonantiarrhythmic drugs for sudden cardiac death prevention. J Cardiovasc Pharmacol 2010;55:438–449. [PubMed] [Google Scholar]
- 4. Moss AJ, Zareba W, Hall WJ, et al.; for the Multicenter Automatic Defibrillator Implantation Trial II Investigators . Prophylactic implantation of a defibrillator in patients with myocardial infarction and reduced ejection fraction. N Engl J Med 2002;346:877–883. [DOI] [PubMed] [Google Scholar]
- 5. Goldberger JJ, Cain ME, Hohnloser SH, et al. American Heart Association/American College of Cardiology Foundation/Heart Rhythm Society Scientific statement on noninvasive risk stratification techniques for identifying patients at risk for sudden cardiac death. A scientific statement from the American Heart Association Council on Clinical Cardiology Committee on Electrocardiography and Arrhythmias and Council on Epidemiology and Prevention. J Am Coll Cardiol 2008;52:1179–1199. [DOI] [PubMed] [Google Scholar]
- 6. Nearing BD, Verrier RL. Tracking heightened cardiac electrical instability by computing interlead heterogeneity of T‐wave morphology. J Appl Physiol 2003;95:2265–2272. [DOI] [PubMed] [Google Scholar]
- 7. Couderc JP, Zareba W, McNitt S, et al. Repolarization variability in the risk stratification of MADIT II patients. Europace 2007;9:717–723. [DOI] [PubMed] [Google Scholar]
- 8. Shusterman V, Goldberg A, London B. Upsurge in T‐wave alternans and nonalternating repolarization instability precedes spontaneous initiation of ventricular tachyarrhythmias in humans. Circulation 2006;113:2880–2887. [DOI] [PubMed] [Google Scholar]
- 9. Verrier RL, Klingenheben T, Malik M, et al. Microvolt T‐wave alternans: Physiologic basis, methods of measurement, and clinical utility. Consensus guideline by the International Society for Holter and Noninvasive Electrocardiology. J Am Coll Cardiol 2011;44:1309–1324. [DOI] [PMC free article] [PubMed] [Google Scholar]
- 10. Nearing BD, Wellenius GA, Mittleman MA, et al. Crescendo in depolarization and repolarization heterogeneity heralds development of ventricular tachycardia in hospitalized patients with decompensated heart failure. Circ Arrhythm Electrophysiol 2012;5:84–90. [DOI] [PMC free article] [PubMed] [Google Scholar]
- 11. Han J, Moe GK. Nonuniform recovery of excitability in ventricular muscle. Circ Res 1964;14:44–60. [DOI] [PubMed] [Google Scholar]
- 12. Surawicz B. Ventricular fibrillation. J Am Coll Cardiol 1985;5 (Suppl):43B–54B. [DOI] [PubMed] [Google Scholar]
- 13. Konta T, Ikeda K, Yamaki M, et al. Significance of discordant ST alternans in ventricular fibrillation. Circulation 1990;82:2185–2189. [DOI] [PubMed] [Google Scholar]
- 14. Chauhan VS, Downar E, Nanthakumar K, et al. Increased ventricular repolarization heterogeneity in patients with ventricular arrhythmia vulnerability and cardiomyopathy: A human in vivo study. Am J Physiol Heart Circ Physiol 2006;290:H79–H86. [DOI] [PubMed] [Google Scholar]
- 15. Selvaraj RJ, Picton P, Nanthakumar K, et al. Endocardial and epicardial repolarization alternans in human cardiomyopathy: Evidence for spatiotemporal heterogeneity and correlation with body surface T‐wave alternans. J Am Coll Cardiol 2007;49:338–346. [DOI] [PubMed] [Google Scholar]
- 16. Day CP, McComb JM, Campbell RW. QT dispersion: An indication of arrhythmia risk in patients with long QT intervals. Br Heart J 1990;63:342–344. [DOI] [PMC free article] [PubMed] [Google Scholar]
- 17. Kenttä TV, Bruce D, Nearing BD, et al. Prediction of sudden cardiac death with automated high‐throughput analysis of T‐wave heterogeneity in standard 12‐lead electrocardiogram [abstract]. Circulation 2014 In press. [DOI] [PubMed]


