

Abstract
Background
Deceleration capacity (DC) of heart rate proved an independent mortality predictor in postmyocardial infarction patients. The original method (DCorig) may produce negative values (9% in our analyzed sample). We aimed to improve the method and to investigate if DC also predicts the arrhythmic mortality.
Methods
Time series from 221 heart failure patients was analyzed with DCorig and a new variant, the DCsgn, in which decelerations are characterized based on windows of four consecutive beats and not on anchors. After 41.2 months, 69 patients experienced sudden cardiac death (SCD) surrogate end points, while 61 died.
Results
(SCD+ vs SCD‐group) DCorig: 3.7 ± 1.6 ms versus 4.6 ± 2.6 ms (P = 0.020) and DCsgn: 4.9 ± 1.7 ms versus 6.1 ± 2.2 ms (P < 0.001). After Cox regression (gender, age, left ventricular ejection fraction, filtered QRS, NSVT≥1/24h, VPBs≥240/24h, mean 24‐h QTc, and each DC index added on the model separately), DCsgn (continuous) was an independent SCD predictor (hazard ratio [H.R.]: 0.742, 95% confidence intervals (C.I.): 0.631–0.871, P < 0.001). DCsgn ≤ 5.373 (dichotomous) presented 1.815 H.R. for SCD (95% C.I.: 1.080–3.049, P = 0.024), areas under curves (AUC)/receiver operator characteristic (ROC): 0.62 (DCorig) and 0.66 (DCsgn), P = 0.190 (chi‐square). Results for deceased versus alive group: DCorig: 3.2 ± 2.0 ms versus 4.8 ± 2.4 ms (P < 0.001) and DCsgn: 4.6 ± 1.4 ms versus 6.2 ± 2.2 ms (P < 0.001). In Cox regression, DCsgn (continuous) presented H.R.: 0.686 (95% C.I. 0.546–0.862, P = 0.001) and DCsgn ≤ 5.373 (dichotomous) presented an H.R.: 2.443 for total mortality (TM) (95% C.I. 1.269–4.703, P = 0.008). AUC/ROC: 0.71 (DCorig) and 0.73 (DCsgn), P = 0.402.
Conclusions
DC predicts both SCD and TM. DCsgn avoids the negative values, improving the method in a nonstatistical important level.
Keywords: deceleration capacity, heart rate dynamics, autonomic nervous system, sudden cardiac death, risk stratification, myocardial infarction
Postmyocardial infarction (post‐MI) and dilated cardiomyopathy (DCMP) patients face an increased risk of arrhythmic sudden cardiac death (SCD).1, 2 Implantable cardiac defibrillators (ICDs), introduced by Dr. Mirofski3 in 1978, improve the survival of patients with an impaired left ventricular systolic function4 and are accepted as the definite prophylactic antitachyarrhythmic therapy. Evidence suggests the presence of potentially high‐risk patients among the post‐MI survivors and early DCMP patients with a preserved left ventricular systolic function.5, 6, 7 Thus, there is an expanding demand for more efficient risk stratification, while the noninvasive techniques are gaining high clinical importance.8 Current perspectives either observational or controlled randomized studies use advanced signal‐processing applications of the electrocardiogram (ECG) as T‐wave alternans, heart rate turbulence (HRT), and signal‐averaged ECG (SAECG) late potentials in order to detect those high‐risk patients, who may benefit from ICD implantation.7, 9, 10
Among the noninvasive methods proposed for risk stratification, a promising new one is the deceleration capacity (DC) of the heart rate. The method is based on a phase‐rectification signal averaging (PRSA) technique,11 permitting the entire signal's interbeat DC to be quantified and expressed as DC index. The clinical utility of DC was examined primarily by a multicenter study including three post‐MI cohorts. The cutoff point of DC <2.5 ms was an independent total mortality (TM) predictor in the larger cohort. This finding was then confirmed by the remaining two databases that were included in the same study.12 DC impairment was demonstrated in schizophrenics on antipsychotic drugs,13 in post‐MI patients prior to nonsustained ventricular tachycardia (NSVT) episodes,14 and in heart failure (HF) patients at risk for malignant ventricular arrhythmias,15 while the combination of a decreased DC and an impaired HRT was associated with an adverse outcome in post‐MI patients even when the left ventricular ejection fraction (LVEF) was still preserved.16
When we applied the original method (DCorig) on our research data,14, 15 a paradox was observed; negative DC values were produced in 9.2% of our patient's time series. From the physiology point of view, as the next RR interval decelerates, this cardiac cycle's interval is longer, compared to the previous cardiac cycle. In this way, their difference is always positive. A method quantifying and extracting the signal's DC is expected to produce only positive values. Negative DC values reflect acceleration and not deceleration for the examined part of the signal. In order to eliminate this phenomenon, we proposed a new method of computation, DCsgn.17 In this method, a deceleration is defined considering four consecutive beats and not only the anchor points. DCsgn gives positive values and extracts only real decelerations as it has been verified in our previous experimental analysis.17 In the present study, both DCorig and DCsgn methods were clinically applied and validated as SCD surrogate and TM predictors in an HF patient cohort.
METHODS
Patients and Study Design
This prospective observational study was approved by our Institution's Ethics Committee and all participants provided their informed consent. Subjects were hospitalized in our department and were referred to our electrophysiology laboratory for primary or secondary prevention of SCD between years 2005 and 2013. The study patients had an impaired left ventricular systolic function with an LVEF ≤50% due to coronary artery disease (CAD) or DCMP. Exclusion criteria included ongoing myocardial ischemia anticipated to be improved with revascularization, malignant diseases affecting survival such as cancer or leukemia, hepatic cirrhosis, and end‐stage renal failure on hemodialysis, and diseases affecting the autonomic nervous system such as stroke, psychiatric disease, dementia‐causing dysautonomia, and addiction to alcohol/opioids. Patients with chronic atrial fibrillation were excluded from the study, while those with a history of paroxysmal atrial fibrillation were included, provided that they were in sinus rhythm during the recruitment phase. After obtaining a detailed patient personal and family history with medications recording, patients underwent physical examination, chest x‐ray, blood and biochemical tests, 12‐lead ECG, echocardiography (ECHO), SAECG, and 24‐hour ambulatory ECG. Subjects with either NSVT episodes and/or late potentials were further risk‐stratified by electrophysiology study (EPS). The patients with clinical or inducible ventricular tachycardia/ventricular fibrillation (VT/VF) on EPS (n = 54) and patients with clinical VT/VF (n = 20) were candidates for an ICD (n = 74). The total sample consisted of 221 participants with CAD (n = 181) and DCMP (n = 40) with depressed LVEF (LVEF = 32.5 ± 10.0%). The mean follow‐up period was 41.2 ± 25.6 months. Primary end points were SCD‐surrogate events ((1) Clinical VT/VF, (2) SCD, and (3) ICD appropriate activation) and secondary end point was TM. Follow‐up was achieved by telephonic contact and reexamination in outpatients department. Study's end points were double checked with the ICD's interrogation reports provided from the doctors who implanted the devices (K.G. and P.D.). When death occurred, the mode of death was searched and investigated extensively by interviewing the relatives, examining all the final existing reports or contacting their doctors for clarifications when there was a need for.
ECG and Signal‐Averaged ECG
Each participant in sinus rhythm underwent a resting supine 12‐lead ECG recording at 25 mm/s and an SAECG (MAC 5000 GE Medical, Milwaukee, WI, USA) in the same position by use of the three X,Y,Z orthogonal bipolar leads (filter: 40–250 Hz). Conventional criteria for the presence of late potentials were used (fQRS: ≥114 ms, LAS: ≥38 ms, RMS: ≤20 μV) for those with a normal QRS duration,18 but for patients with intraventricular conduction delay with a QRS duration ≥120 ms, the modified criteria19 were applied (fQRS:≥145 ms, LAS:≥50 ms, RMS:≤ 17.5 μV).
Echocardiography
A complete ECHO examination was performed (SONOS 5500, Hewlett Packard, Andover, MA, USA). LVEF was calculated according to the recommendations of the American Society of Echocardiography.20
Twenty‐Four‐Hour Holter Monitoring
During the hospitalization period, every patient in sinus rhythm underwent 24‐hour Holter monitoring (HM) (Spider View). The recordings were analyzed using SyneScope 3.10 software (Spider View & Synescope 3.10, Sorin Group, Clamart, France). The events were reviewed and manually corrected after the automatic classification (P.A.). Heart rate, RR intervals, number of ventricular premature beats (VPBs), and of NSVT episodes were calculated from the ECG signal analysis.
Heart Rate Variability Analysis
For heart rate variability (HRV) analysis, only patients with at least 18 hours of good‐quality signal recordings with less than 12% of filtered extra systoles were included. HRV analysis guidelines were fully observed.21 Time domain (standard deviation of the normal to normal intervals [SDNN], standard deviation of the averages of NN intervals in all 5‐minute segments [SDANN], square root of the mean of the squares of successive NN interval differences [RMSSD], and the percentage of intervals >50 ms different from preceding interval [PNN50]) and frequency domain (HFr: 0.15–0.4 Hz, LFr: 0.04–0.15 Hz, and VLFr: 0.0033–0.04 Hz, TP) analyses were performed with Synescope 3.10 software.
Deceleration Capacity
For the computation of DC, the mathematical method based on the original algorithm12, 22 (DCorig) was applied on extracted RR time series from the patient's recordings. Furthermore, signals were analyzed with the new algorithm (DCsgn) developed by our team.17 In brief, the original method12, 22 considers as deceleration each two successive intervals, the second of which is larger than the first one. This interval is called an anchor. After PRSA, DC is computed with the following formula:
| (1) |
where x(0) is the examined interval (the anchor), x(1) is the following one, and x(−1) and x(−2) are the two previous intervals before the anchor. The bar symbol denotes the average. In the original formula,12 it is possible that a negative value to be extracted in cases where many x(−2) and x(−1) intervals are longer than the corresponding x(0) and x(1) intervals. The physiological meaning of a negative value describing interbeat durations is acceleration and not deceleration. For a better clarification of this point, let us consider a model of two RR intervals. If the second cardiac cycle is longer than the previous one (real deceleration), then only positive differences must be produced. With the DCsgn method, we consider decelerations based on all four consecutive beats for which x(0) + x(1) − x(−1) − x(−2) > 0. We also apply filtering of 5% (each interval must not be larger than 5% from the previous interval) on all successive beats participating in the computation compared to the original method that filters only the anchor points. For a more detailed description, please see our contribution.17 The number of the segments selected as decelerations and accelerations depends on the quality of the signal (the filter excludes a larger number of segments in noisy signals) and on the duration of the recording. Our recordings were 18–24 hours long and the average number of segments selected, and on which the computations have been based, was approximately 22,500 for decelerations and 24,500 for accelerations.
Rate‐Corrected QT Interval
For Holter‐derived QTc interval, a mean complex waveform was calculated for every 30 seconds of ECG by the SyneScope 3.10 software. The mean average of QTc calculated values during the 24‐hour Holter ECG was used as the QTc index.23 Fridericia's formula was used for the rate correction.
Electrophysiological Study
A complete EPS was performed in patients with either NSVT episodes or/and late potentials (n = 91) after informed consent. Ventricular tachycarrhythmia inducibility during EPS was defined as induction of either sustained monomorphic VT or/and polymorphic VT degenerating into VF.6, 24, 25
Statistical Analysis
Continuous variables are presented as mean values ± standard deviation, while qualitative variables are presented as relative frequencies. T‐test and chi‐square test were used to demonstrate the presence of significant differences in the clinical characteristics of the two study groups. For univariate analysis, t test and log rank were applied to test the associations between noninvasive markers and SCD surrogate end points. Correlations between HR indices and HRV indices were searched with Pearson's correlation coefficients (r). Multivariable analysis for SCD surrogate end point was performed using Cox regression models adjusted for gender, age, LVEF, fQRS, NSVT ≥ 1/24 h, VPBs more/equal 240/24 h, QTc (Fridericia), and one of the DC indices each time (DCorig/DCsgn/cutoff points of DC). A backward elimination procedure was applied to all multivariate models (using P < 5% as the threshold for removing a variable from the models). All reported P values are based on two‐sided tests and compared to a significance level of 5%. A value of P < 0.05 was considered statistically significant. The results obtained are presented as hazard ratios (H.R.) and the 95% confidence intervals (C.I.). DCorig and DCsgn performance for both SCD surrogate and TM end points investigated with receiver operator characteristic (ROC) curves. Areas under curves (AUCs) from DCorig and DCsgn ROC curves were internally validated using the bootstrap method and a resample number = 1000. AUC values that were extracted from the study's sample (n = 221) remained unchanged after resampling. Furthermore, AUC compared with chi‐square test. STATA 8.0 software (Stata Corporation 2003, College Station, TX, USA) was used for all statistical calculations.
RESULTS
Clinical Characteristics
The patients mean age was 64.7 ± 13.2 years and 83% were males. The mean LVEF was 32.5 ± 10.0%. CAD was present in 181 patients (82%) and DCMP in 40 (18%). The mean follow‐up period was 41.2 ± 25.6 months. No differences between SCD+ and SCD− surrogate patients were observed for age, gender, CAD, STEMI, Non‐STEMI, CABG, PTCA, DCMP, diabetes mellitus, Ht, renal function, sodium, potassium, and b blockers. In contrast, the SCD+ surrogate group was different in comparison to SCD− surrogate group in LVEF (30.0 ± 10.5% vs 33.6 ± 9.6%, P = 0.012), NYHA class (2.4 ± 0.5 vs 2.2 ± 0.4, P = 0.001), hypertension (49% vs 65%, P = 0.025), amiodarone (26% vs 16%, P = 0.027), and statins (45% vs 63%, P = 0.051). EPS was performed in 91 patients with 54 patients demonstrating inducible VT/VF (59%). Baseline clinical characteristics are presented in Table 1.
Table 1.
Baseline Patients Characteristics
| Characteristics | Total (n = 221) | SCDsur + (n = 69) | SCDsur‐ (n = 152) | P Value |
|---|---|---|---|---|
| Age (years) | 64.7±13.2 | 64.9±13.2 | 64.7±13.5 | NS |
| Male sex nb/(%) | 184 (83) | 60 (87) | 124 (82) | NS |
| CAD nb/(%) | 181 (82) | 57 (83) | 124 (82) | NS |
| STEMI nb/(%) | 119 (54) | 38 (55) | 81 (53) | NS |
| Non STEMI nb/(%) | 21 (10) | 9 (13) | 12 (8) | NS |
| CABG nb/(%) | 66 (30) | 25 (36) | 41 (27) | NS |
| PTCA nb/(%) | 60 (27) | 13 (19) | 47 (31) | NS |
| DCMP nb/(%) | 40 (18) | 10 (14) | 30 (20) | NS |
| Diabetes nb/(%) | 70 (32) | 21 (30) | 49 (32) | NS |
| LVEF (%) | 32.5±10.0 | 30.0±10.5 | 33.6±9.6 | 0.012 |
| ΝΥΗΑ class | 2.3±0.5 | 2.4±0.5 | 2.2±0.4 | 0.001 |
| Ht (%) | 40±5.2 | 40±5.1 | 40 ±5.2 | NS |
| Urea mg/dL | 53±35.2 | 58±42.3 | 51±31.4 | NS |
| Creatinine mg/dL | 1.3±0.6 | 1.3±0.5 | 1.3±0.7 | NS |
| Sodium meq/L | 138±3.9 | 138±3.5 | 138±4.0 | NS |
| Potassium meq/L | 4.2±0.5 | 4.2±0.5 | 4.2±0.5 | NS |
| Medications | ||||
| Beta‐blockers (%) | 133 (60) | 36 (52) | 97 (64) | NS |
| ACEI (%) | 104 (47) | 26 (38) | 78 (51) | NS |
| ARBs (%) | 42 (19) | 8 (12) | 34 (22) | NS |
| Acetyl sal (%) | 127 (57) | 36 (52) | 91 (60) | NS |
| Clopidogrel (%) | 66 (30) | 13 (19) | 53 (35) | NS |
| Coumarine (%) | 24 (11) | 10 (14) | 14 (9) | NS |
| Nitrate (%) | 81 (37) | 23 (33) | 58 (38) | NS |
| Diuretics (%) | 117 (53) | 36 (52) | 81 (53) | NS |
| Digoxin (%) | 17 (8) | 8 (12) | 9 (6) | NS |
| Spironolactone (%) | 30 (14) | 9 (13) | 21 (14) | NS |
| Amiodarone (%) | 42 (19) | 18 (26) | 24 (16) | 0.027 |
| Statins (%) | 127 (57) | 31 (45) | 96 (63) | 0.051 |
| CCBs (%) | 26 (12) | 11 (16) | 15 (10) | NS |
ACEi = angiotensin‐converting enzyme inhibitor; ARBs = angiotensin‐II receptor blocker; CABG = coronary artery bypass graft surgery; CAD = coronary artery disease; CCBs = calcium channel blockers; DCMP = dilated cardiomyopathy; LVEF = left ventricular ejection fraction; NonSTEMI = myocardial infarction without ST elevation; NYHA = New York Heart Association class; PTCA = percutaneous transluminal coronary angioplasty; SCDsur = sudden cardiac death surrogate; STEMI = myocardial infarction with ST elevation.
Univariate Analysis
Significant differences were demonstrated between the SCD+ and SCD− surrogate groups for LVEF from ECHO (30.0 ± 10.5% vs 33.6 ± 9.6%, P = 0.012) and for fQRS from SAECG (142 ± 30 ms vs 134 ± 29 ms, P = 0.055). VPBs cutoff point ≥240 beats/24 hour and presence of NSVT episode(s)/24 hour from Holters were also statistically different for the two groups (52% vs 36%, P = 0.020 and 42% vs 24%, P = 0.005, respectively). From HRV analysis, differences between SCD+ and SCD− groups were demonstrated for SDNN: (80 ± 27 ms vs 98 ± 38 ms, P = 0.001) and for RMSSD: (32 ± 22 ms vs 41 ± 36 ms, P = 0.050). The HFr part of the frequency spectrum and the LF/HF ratio were not different between the two groups. The LFr part of frequency spectrum was lower for the SCD+ surrogate group (LFr: 300 ± 388 ms2 vs 531 ± 719 ms2, P = 0.014). The rate‐corrected QT interval (Friedericia) derived from 24 hour Holter recording was significantly higher for the SCD+ surrogate group (443 ± 40 ms vs 433 ± 32 ms, P = 0.053). DC of heart rate was decreased in SCD+ surrogate group with both methods applied. The corresponding values for the SCD+ vs SCD− surrogate groups were: DCorig: 3.7 ± 1.6 ms vs 4.6 ± 2.6 ms (P = 0.020), DCsgn: 4.7 ± 1.7 ms vs 6.1 ± 2.2 ms (P<0.001). Results of univariate analysis for arrhythmic end points are presented in Table 2.
Table 2.
Arrhythmia Predictors Mean Values for SCD ± Surrogate and SCD− Surrogate Groups
| All | SCD+sur. | SCD‐sur | ||
|---|---|---|---|---|
| Predictors | (n = 221) | (n = 69) | (n = 152) | P Value |
| ECHO | ||||
| LVEF (%) | 32±10.0 | 30±10.5 | 33±9.6 | 0.012 |
| LVEDD (mm) | 57±9.2 | 60±9.5 | 56±8.7 | 0.001 |
| SAECG | ||||
| fQRS (ms) | 136±29 | 142±30 | 134±29 | 0.055 |
| LAS (ms) | 48±30 | 51±28 | 46±31 | 0.245 |
| RMS (μV) | 27±18 | 24±19 | 28±18 | 0.156 |
| HOLTER | ||||
| NSVT≥1/24h (%) | 65 (29) | 29 (42) | 36 (24) | 000.5 |
| VPBs≥240/24h (%) | 91 (41) | 36 (52) | 55 (36) | 0.020 |
| SDNN (ms) | 92±35 | 80±27 | 98±38 | 0.001 |
| RMSSD (ms) | 38±32 | 32±22 | 41±36 | 0.050 |
| HFr (ms2) | 293±485 | 218±392 | 327±519 | 0.128 |
| LFr (ms2) | 459±643 | 300±388 | 531±719 | 0.014 |
| LFr/HFr | 2.2±1.5 | 2.1±1.4 | 2.3±1.6 | 0.386 |
| QTc (ms) Fredericia | 436±35 | 443±40 | 433±32 | 0.053 |
| DCorig | 4.3±2.4 | 3.7±1.6 | 4.6±2.6 | 0.020 |
| DCsgn | 5.8±2.1 | 4.7±1.7 | 6.1±2.2 | <0.001 |
DCorig = deceleration capacity original method; DCsgn = deceleration capacity characterized by the sign of the fraction method; ECG = electrocardiogram; ECHO = echocardiography; fQRS = filtered QRS from signal‐averaged electrocardiogram; HFr = high frequencies; LAS = low‐amplitude signal; LFr = low frequencies; LVEDD = left ventricular end‐diastolic diameter; LVEF = left ventricular ejection fraction; NSVT = nonsustained ventricular tachycardia; QTc = rate‐corrected QT interval; RMS = root mean square; RMSSD = square root of the mean of the squares of successive NN interval differences; SAECG = signal‐averaged electrocardiogram; SDNN = standard deviation normal to normal beat; VPBs = ventricular premature beats.
When the patients data were analyzed for the TM (deceased n = 61) t tests for the two patients groups (alive vs dead) were statistically different in both DC indices: DCorig: 3.2 ± 2.0 ms vs 4.8 ± 2.4ms (P<0.001) and DCsgn: 4.6 ± 1.4 ms vs 6.2 ± 2.2 ms (P<0.001). When patients with an ICD (n = 74) were analyzed, their mean DC values were found lower in comparison with the patients without an ICD (n = 147). DCorig: 3.9 ± 2.1 ms vs 4.5 ± 2.5 ms (P = 0.109) and DCsgn: 5.3 ± 2.0 ms vs 6.0 ± 2.1 ms (P = 0.03).
Multivariable Analysis
For testing the independence of DC indices from other variables influencing SCD surrogate, a Cox regression analysis was performed with the basic model adjusted for gender, age, LVEF, fQRS, NSVT≥1episode/24h, VPBs≥240beats/24hour, QTc (Fredericia), and one DC variable (DCorig, DCsgn, DC dichotomous) added in the model each time. DCorig (continuous) was a significant and independent SCD surrogate predictor in this model (H.R.: 0.835, 95% CI: 0.735–0.947, P = 0.005). DCorig<2.5 ms was proposed as a TM predictor in post MI patients by the first multicenter cornerstone clinical DC study.12 When we searched for the predictive performance of DCorig<2.5 ms relevant arrhythmic SCD end point by adding DCorig < 2.5 ms in our basic multivariable Cox regression model adjusted for gender, age, LVEF, fQRS, NSVT⩾1 episode/24h, VPBs≥240 beats/24h, and QTc (Fredericia), finally DCorig<2.5 ms was removed from the model as nonpredictive (P = 0.259).
DCsgn (continuous) was an important and independent SCD surrogate predictor in the same model (H.R. for SCD: 0.742 (95%C.I.: 0.631‐0.871, P<0.001). When the DCsgn cutoff point of 5.373 (median) was added at the same model, a 1.815 H.R. (95%C.I.: 1.080–3.049, P = 0.024) for SCD surrogate for the patients group below the dichotomous in comparison to the patients group with DCsgn values above the dichotomous (log rank P = 0.041) was revealed (Table 3, Fig. 1). The AUCs from ROC analysis were 0.62 (DCorig) and 0.66 (DCsgn), and P = 0.190 (chi‐square) (Table 4, Fig. 2). In multivariate analysis, a dichotomous value of VPBs≥240/24h was also an independent SCD predictor. The patients above this cut off point presented 1.835 H.R. for major arrhythmic events (95% C.I.: 1.014–3.322, P = 0.045). In contrast, both LVEF and cutoff point of NSVT≥1/24h failed to predict independently the SCD surrogate (Table 3). For examining the TM end point, a Cox regression multivariable model was adjusted for gender, age, LVEF, fQRS, NSVT≥1 episode/24h, VPBs≥240beats/24hour, QTc (Fredericia), serum creatinine, and one of the DC indices (DCorig, DCsgn, and DC dichotomous) added in the model each time. In this model, DCsgn (continuous) presented an H.R. of 0.686 (95%C.I.: 0.546–0.862, P = 0.001) for death, while when DCorig (continuous) estimated in the same model, it presented an H.R. of 0.832 (95% C.I. 0.732–0.946, P = 0.005) for TM end point. We estimated DCorig<2.5 ms for TM prediction with the same model adjusted for gender, age, LVEF, fQRS, NSVT⩾1 episode/24h, VPBs≥240 beats/24h, QTc (Fredericia) serum creatinine, and DCorig<2.5 ms, and an H.R. of 2.479 (95% C.I. 1.230–4.997, P = 0.011) for TM prediction was revealed. Patients with DCsgn below the cutoff point of 5.373 (50th percentile) versus the patients above this cutoff point presented at the same Cox regression model an H.R. of 2.443 for death (95% C.I.: 1.269–4.703, P = 0.008). AUCs from ROC analysis were 0.71 (DCorig) and 0.73 (DCsgn), P = 0.402 (chi‐square) (Table 4, Fig. 2).
Table 3.
Multivariate Cox Regression Analysis of the Predictors for the Occurrence of SCDsurrogate
| Variables | Hazard ratio | (95% CI) | P Value |
|---|---|---|---|
| Male | – | – | NS |
| Age | – | – | NS |
| LVEF | 0.976 | 0.945–1.009 | 0.161 |
| fQRS | – | – | NS |
| NSVT≥1 | – | – | NS |
| VPBs≥240 | 1.835 | 1.014–3.322 | 0.045 |
| QTc | – | – | NS |
| DCorig | 0.835 | 0.735–0.947 | 0.005 |
| DCsgn | 0.742 | 0.631–0.871 | <0.001 |
| DCsgn cutoff 5.373 | 1.815 | 1.080–3.049 | 0.024 |
Full model adjusted for: gender, age, LVEF, fQRS, NSVT≥1/24h, VPBs≥240/24h, QTc, and one of the variables of DC each time (DCorig/DCsgn).
DCorig = deceleration capacity original method; DCsgn = deceleration capacity characterized by the sign of the fraction method; fQRS = filtered QRS from signal‐averaged ECG; LVEF = left ventricular ejection fraction, NSVT≥1/24h = nonsustained ventricular tachycardia episodes ≥1/24 hour; QTc = rate‐corrected according Fridericia QT interval derived from Holter; VPBs≥240/24 hour = ventricular premature beats≥240/24 hour.
Figure 1.

Kaplan Meier curves for SCD surrogate prediction with DCsgn cutoff point of 5.3 ms. DCsgn = deceleration capacity characterized by the sign of the fraction method.
Table 4.
Comparison of DCorig and DCsgn ROC Curves with Chi‐Square Test
| (A) ROC Curves for SCD Surrogate | (B) ROC Curves for Total Mortality | ||||||
|---|---|---|---|---|---|---|---|
| Chi‐Square for DCorig and DCsgn (P = 0.190) | Chi‐Square for DCorig and DCsgn (P = 0.402) | ||||||
| ROC Area | Std. Err. | [95% C.I.] | ROC Area | Std. Err. | [95% C.I.] | ||
| DCorig | 0.6225 | 0.0437 | 0.536–0.708 | DCorig | 0.704 | 0.040 | 0.625–0.738 |
| DCsgn | 0.6486 | 0.0432 | 0.564–0.733 | DCsgn | 0.721 | 0.039 | 0.645–0.798 |
AUC = area under the curve; DCorig = deceleration capacity original method; DCsgn = deceleration capacity characterized by the sign of the fraction method; ROC = receiver operating characteristic; SCD = sudden cardiac death.
Figure 2.
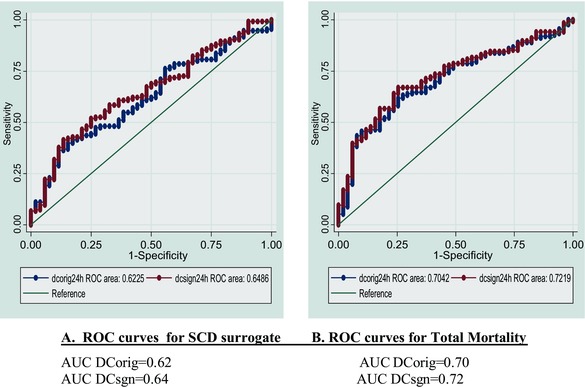
DCorig and DCsgn ROC curves for SCD surrogates (A) and for total mortality (B). AUC = area under the curve; DCorig = deceleration capacity original method; DCsgn = deceleration capacity characterized by the sign of the fraction method; ROC = receiver operating characteristic; SCD = sudden cardiac death.
Correlations
In our study, age, VPBs, and heart rate were inversely correlated with DC indices, while LVEF and SDNN from HRV were positively correlated with DC (Table 5, Fig. 3). As it is expected, DCsgn and DCorig are strongly correlated (r = 0.871, P < 0.001).
Table 5.
Correlations between DC Indices and Conventional Echocardiographic and Electrocardiographic Indices (Pearson Coefficient)
| DCorig | DCsgn | |||
|---|---|---|---|---|
| r | P Value | r | P Value | |
| Age | −0.429 | <0.001 | −0.429 | <0.001 |
| LVEF | 0.248 | <0.001 | 0.329 | <0.001 |
| VPBs | −0.203 | 0.005 | −0.203 | 0.005 |
| NSVT | −0.055 | 0.452 | −0.018 | 0.799 |
| HR | −0.330 | <0.001 | −0.400 | <0.001 |
| SDNN | 0.529 | <0.001 | 0.627 | 0.001 |
| RMSSD | −0.051 | 0.481 | 0.124 | 0.089 |
| PNN50 | 0.002 | 0.970 | 0.233 | 0.001 |
| TP | 0.432 | <0.001 | 0.514 | <0.001 |
| VLFr | 0.622 | <0.001 | 0.671 | <0.001 |
| LFr | 0.381 | <0.001 | 0.372 | <0.001 |
| HFr | −0.040 | 0.589 | 0.078 | 0.289 |
| LFr/HFr | 0.429 | <0.001 | 0.409 | <0.001 |
DCorig = deceleration capacity original method; DCsgn = deceleration capacity characterized by the sign of the fraction method; HFr = high frequencies; HR = heart rate; LFr = low frequencies; LVEF = left ventricular ejection fraction; NSVT≥1/24h = nonsustained ventricular tachycardia episodes ≥1/24 hour; RMSSD = square root of the mean of the squares of successive NN interval differences; SDNN = standard deviation normal to normal beat; PNN50 = the percentage of intervals >50 ms different from preceding interval; TP = total power; VLFr = very low frequencies; VPBs = ventricular premature beats≥240/ 24 hour.
Figure 3.

Correlations for DCsgn and other important arrhythmia predictors. DCsgn = deceleration capacity characterized by the sign of the fraction method; LVEF = left ventricular ejection fraction; SDNN = standard deviation normal to normal beat; VPBs = ventricular premature beats ≥ 240/24 hour.
DISCUSSION
TM was predicted by DCorig in accordance with previous studies12, 26 and by the recently proposed DCsgn variant.17 Our study confirms that DC method is prognostic for SCD surrogate end points15 and proposes the DCsgn variant for clinical risk stratification. DCsgn, by avoiding negative values extraction, improved the DC method's performance for both the SCD surrogate and the TM end points. The observed improvement was not statistically significant. In this study, we examined the DC performance in the arrhythmic SCD field, using core arrhythmic multivariable models adjusted for indices reflecting different mechanisms of arrhythmia initiation. Models were adjusted for LVEF (pump's systolic dysfunction), fQRS from SAECG (arrhythmogenic postinfarction scar substrate and predisposition for reentry), VPBs and NSVT episodes (triggering), and QTc interval (prolonged repolarization). The independent prognostic significance of DC indices for SCD surrogate prediction was confirmed by this arrhythmia‐specific multivariate model, as it was applied in our HF population. Differences between previous studies and our study for the DC values distribution across the quartiles and the predictive for TM dichotomous cutoff point may be explained by our patients’ characteristics. While the previous cohorts included post‐MI patients with mean LVEF 40–45%, in our study, left ventricular systolic function was more severely impaired and mean LVEF was 32.5%. Furthermore, by avoiding the negative DC values with DCsgn, the observed average DCsgn of the total population was moved to higher values that those observed with the DCorig (5.8 ± 2.1 and 4.3 ± 2.4, respectively). The same distribution with higher values produced by DCsgn method than with DCorig was observed after the total sample was analyzed for the ICD‐patients group versus the non‐ICD patients group. Furthermore, DCsgn was able to discriminate these groups (P = 0.03), while DCorig not (P = 0.109). This observation in addition to better DCsgn AUC performance may indicate that probably, DCsgn is a more sensitive arrhythmic predictor than DCorig. Several DCsgn values across the quartiles were estimated during log‐rank statistics. Finally, the median DCsgn value of 5.373 ms was selected as a dichotomous because it performs satisfactory both for arrhythmic SCD and TM end point prediction. Although the previously proposed DCorig < 2.5 ms dichotomous was proved in our study as an independent TM predictor with H.R. 2.479, this cutoff point was not a sufficient predictor in multivariate analysis examining arrhythmic SCD end point (P = 0.259).
There is no doubt that our high‐risk patient had a number of abnormal well‐accepted noninvasive risk stratifiers from the ambulatory and the signal‐averaged electrocardiography beyond the reduced value of LVEF. However, it was shown that both the number of premature ventricular contractions more than 240 beats per 24 hour (VPBs ≥ 240/24h) as well as the reduced DC value emerged as independent prognostic indicators for malignant ventricular arrhythmia during the long‐term follow‐up. Thus, it is likely that the ventricular ectopy along with the impaired parasympathetic nervous system (PNS) may have predisposed to SCD surrogate events in our HF patients with fibrotic myocardial scars in the presence of reduced LVEF and areas of slow and inhomogeneous conduction. HF patients suffer supranormal sympathetic and subnormal parasympathetic outflows26 and an affected status of PNS.27 Such conditions may promote the occurrence of ventricular arrhythmias,28 while cholinergic activity secondary to electric vagus nerve stimulation raises ventricular fibrillation thresholds29 and improves long‐term survival in animal experimental model of HF. This protective effect of the baroreceptor mechanism has been linked primarily to the antifibrillatory influence of vagus nerve activity.28, 29 In this way, PNS level of activity may represent both a prognostic index (in case it could be quantified12) and a therapeutic target (in case it could be enhanced after adequate stimulation29, 30). PRSA method separately quantifies decelerations of heart rate from accelerations and it is believed to reflect the PNS extrinsic influences on heart rate. Indeed, a reduced DC value of less than 2.5 ms has been proved to be a powerful prognostic index of mortality in post‐MI patients12 and this was further confirmed with a retrospective analysis of a large postinfarction population.31
DC Origin
Deceleration of heart rate must be the final result of the tonic sympathetic–parasympathetic interactions on the sinus node level with the reflex vagal activity32 to be added each moment on this tonic status.
Observed Correlations
Our study reveals that the older the patient, the lower the DC. Analogous correlations have been reported for different HRV indices and age with possible common mechanism the ANS's impairment with aging.33 In our study, the higher the LVEF was, the higher were the extracted DC values and the higher the HR was, the lower these DC values were (Fig. 3). The combination of low DC values with low LVEF possibly reflects the impaired PNS control of HR after MI34 and a shift to sympathetic predominance during the HF syndrome evolution. It is also notable that the more preserved the DC values were in our patients, the lower the absolute number of their VPBs (Fig. 3), implying that elevated normal DC values accompany a status of electric stability in these patients.
Limitations
Our results were extracted from severe HF patients with a number of other risk markers for the occurrence of malignant ventricular arrhythmias concurrently present. These results may not be applicable to other less sick populations. Furthermore the end points of SCD surrogates could also be criticized as the number of appropriate ICD activations overestimates the SCD risk among the HF high‐risk patients receiving the device.35
CONCLUSIONS
As in previous studies, the impaired DC values as calculated with the DCorig method were predictive of TM in our HF population with significant ventricular dysfunction. This predictive ability was somewhat enhanced when our proposed DCsgn modification method of analysis was applied in our patients’ sample. Furthermore, both methods of DC analysis were able to detect the high‐risk post‐MI and DCMP patients prone to malignant ventricular arrhythmias promising an improved risk stratification process beyond other well‐accepted noninvasive electrocardiographic and echocardiographic risk indicators. Further understanding of the role of the impaired ANS status at different stages of the HF process may incorporate the DC calculation in order to improve the risk stratification approach, and thus protect the high‐risk patients timely.
Acknowledgments
We thank Professor Georg Schmidt from the Working Group of Biological Signal in Technische Universität München, Germany, for the DC method provided to our team. We thank Dipl. Eng. Alexander Müller for his efficient support for making our signals compatible for analysis. We thank Mr. Ali Sarvi and General Electric for their permission to use the method for research purposes.
Ann Noninvasive Electrocardiol 2016;21(5):508–518
Funding: Petros Arsenos is supported with research equipment by Sorin Group.
Conflicts of interest: Petros Arsenos is supported with research equipment by Sorin Group.
REFERENCES
- 1. Gatzoulis KA, Archontakis S, Dilaveris P, et al. Ventricular arrhythmias: From the electrophysiology laboratory to clinical practice. Part I: Malignant ventricular arrhythmias. Hellenic J Cardiol 2011;52:525–535. [PubMed] [Google Scholar]
- 2. Gatzoulis KA, Archontakis S, Dilaveris P, et al. Ventricular arrhythmias: From the electrophysiology laboratory to clinical practice. Part II: Potentially malignant and benign ventricular arrhythmias. Hellenic J Cardiol 2012;53:217–233. [PubMed] [Google Scholar]
- 3. Mirowski M, Mower MM, Langer A, et al. A chronically implanted system for automatic defibrillation in active conscious dogs. Experimental model for treatment of sudden cardiac death from ventricular fibrillation. Circulation 1978;58:90–94. [DOI] [PubMed] [Google Scholar]
- 4. Moss AJ, Zareba W, Hall WJ, et al. Prophylactic implantation of a defibrillator in patients with myocardial infarction and reduced ejection fraction. N Engl J Med 2002;346:877–883. [DOI] [PubMed] [Google Scholar]
- 5. Gatzoulis KA, Tsiachris D, Dilaveris P, et al. Implantable cardioverter defibrillator therapy activation for high risk patients with relatively well preserved left ventricular ejection fraction. Does it really work? Int J Cardiol 2013;167:1360–1365. [DOI] [PubMed] [Google Scholar]
- 6. Gatzoulis KA, Tsiachris D, Arsenos P, et al. Prognostic value of programmed ventricular stimulation for sudden death in selected high risk patients with structural heart disease and preserved systolic function. Int J Cardiol 2014;176:1449–1451. [DOI] [PubMed] [Google Scholar]
- 7. Gatzoulis KA, Tsiachris D, Arsenos P, et al. Post myocardial infarction risk stratification for sudden cardiac death in patients with preserved ejection fraction: PRESERVE‐EF study design. Hellenic J Cardiol 2014;55:361–368. [PubMed] [Google Scholar]
- 8. Arsenos P, Gatzoulis K, Dilaveris1 P, et al. Arrhythmic sudden cardiac death: Substrate, mechanisms and current risk stratification strategies for the post‐myocardial infarction patient. Hellenic J Cardiol 2013;54:301–315. [PubMed] [Google Scholar]
- 9. Ikeda T, Yoshino H, Sugi K, et al. Sudden cardiac death in patients with preserved cardiac function after acute myocardial infarction. JACC 2006;48:2268–2274. [DOI] [PubMed] [Google Scholar]
- 10.The Risk Estimation Following Infarction Noninvasive Evaluation – ICD efficacy (REFINE ICD) trial. http://refineicd.com/sites.html.
- 11. Bauer A, Kantelhardtb JW, Bundec A, et al. Phase‐rectified signal averaging detects quasi‐periodicities in non‐stationary data. Physica A 2006;364:423–434. [Google Scholar]
- 12. Bauer A, Kantelhardt JW, Barthel P, et al. Deceleration capacity of heart rate as a predictor of mortality after myocardial infarction: Cohort study. Lancet 2006;367:1674–1681. [DOI] [PubMed] [Google Scholar]
- 13. Birkhofer A, Geissendoerfer J, Alger P. The deceleration capacity – A new measure of heart rate variability evaluated in patients with schizophrenia and antipsychotic treatment. Eur Psychiatry 2013;28:81–86. [DOI] [PubMed] [Google Scholar]
- 14. Arsenos P, Manis G, Nikolopoulos S, et al. Deceleration capacity alterations before non‐sustained ventricular tachycardia episodes in post myocardial infarction patients. Comput Cardiol 2013;40:145–147. [Google Scholar]
- 15. Arsenos P, Manis G, Dilaveris P, et al. Decreased deceleration capacity of heart rate detects heart failure patients at risk for malignant ventricular arrhythmias. Hospital Chronicles 2014;9:258–265. [Google Scholar]
- 16. Bauer A, Barthel P, Schneider R, et al. Improved stratification of autonomic regulation for risk prediction in post‐infarction patients with preserved left ventricular function (ISAR‐Risk). Eur Heart J 2009;30:576–583. [DOI] [PMC free article] [PubMed] [Google Scholar]
- 17. Arsenos P, Manis G. Deceleration capacity of heart rate: Two new methods of computation. Biomed Signal Process Control 2014;14:158–163. [Google Scholar]
- 18. Breithardt G, Cain ME, El‐Sherif N, et al. Standards for analysis of ventricular late potentials using high resolution or signal averaged electrocardiography: A statement by the Task Force Committee of the European Society of Cardiology, the American Heart Association and the American College of Cardiology. JACC 1991;17:999–1006. [DOI] [PubMed] [Google Scholar]
- 19. Gatzoulis KA, Carlson MD, Biblo LA, et al. Time domain analysis of the signal averaged electrocardiogram in patients with a conduction defect or a bundle branch block. Eur Heart J 1995;16:1912–1919. [DOI] [PubMed] [Google Scholar]
- 20. Lang RM, Bierig M, Devereux RB, et al. Recommendations for chamber quantification. Eur J Echocardiography 2006;7:79–108. [DOI] [PubMed] [Google Scholar]
- 21. Heart Rate Variability . Standards of measurements, physiological interpretation and clinical use. Task Force of the ESCARDIO and the NASPE. Eur Heart J 1996;17:354–381. [PubMed] [Google Scholar]
- 22. Technische Universität Müunchen , Working Group of Biological Signal Analyses: http://www.librasch.org/prsa
- 23. Arsenos P, Gatzoulis KA, Dilaveris P, et al. The rate‐corrected QT interval calculated from 24‐hour Holter recordings may serve as a significant arrhythmia risk stratifier in heart failure patients. Int J Cardiol 2011;147:321–323. [DOI] [PubMed] [Google Scholar]
- 24. Gatzoulis KA, Vouliotis AI, Tsiachris D, et al. Primary prevention of sudden cardiac death in a nonischemic dilated cardiomyopathy population: Reappraisal of the role of programmed ventricular stimulation. Circ Arrhythm Electrophysiol 2013;6:504–512. [DOI] [PubMed] [Google Scholar]
- 25. Zaman S, Narayan A, Thiagalingam A, et al. Long‐term arrhythmia‐free survival in patients with severe left ventricular dysfunction and no inducible ventricular tachycardia after myocardial infarction. Circulation 2014;129:848–854. [DOI] [PubMed] [Google Scholar]
- 26. Porter TR, Eckberg DL, Fritsch JM, et al. Autonomic pathophysiology in heart failure patients. Sympathetic‐cholinergic interrelations. J Clin Invest 1990;85:1362–1371. [DOI] [PMC free article] [PubMed] [Google Scholar]
- 27. Eckberg DL, Drabinsky M, Braunwald E. Defective cardiac parasympathetic control in patients with heart disease. N Engl J Med 1971;285:877–883. [DOI] [PubMed] [Google Scholar]
- 28. Schwartz PJ, Billman GE, Stone HL. Autonomic mechanisms in ventricular fibrillation induced by myocardial ischemia during exercise in dogs with healed myocardial infarction. An experimental preparation for sudden cardiac death. Circulation 1984;69:790–800. [DOI] [PubMed] [Google Scholar]
- 29. Kent KM, Smith ER, Redwood DR, et al. Electrical stability of acutely ischemic myocardium. Influences of heart rate and vagal stimulation. Circulation 1973;47:291–298. [DOI] [PubMed] [Google Scholar]
- 30. Hauptman PJ, Schwartz PJ, Gold MR, et al. Rationale and study design of the INcrease Of Vagal TonE in Heart Failure study: INOVATE‐HF. Am Heart J 2013;163:954–962. [DOI] [PubMed] [Google Scholar]
- 31. Bauer A, Barthel P, Müller A, et al. Risk prediction by heart rate turbulence and deceleration capacity in postinfarction patients with preserved left ventricular function retrospective analysis of 4 independent trials. J Electrocardiol 2009;42:597–601. [DOI] [PubMed] [Google Scholar]
- 32. Hohnloser SH, Klingenheben T, van de Loo A, et al. Reflex versus tonic vagal activity as a prognostic parameter in patients with sustained ventricular tachycardia or ventricular fibrillation. Circulation 1994;89:1068–1073. [DOI] [PubMed] [Google Scholar]
- 33. O'Brien IA, O'Hare PO, Corral RJ. Heart rate variability in healthy subjects: Effect of age and the derivation of normal ranges for tests of autonomic function. Br Heart J 1986;55:348–354. [DOI] [PMC free article] [PubMed] [Google Scholar]
- 34. Niemelä MJ, Airaksinen KEJ, Ikäheimo MJ, et al. Impaired parasympathetic control of heart rate after myocardial infarction. Int J Cardiol 1989;24:305–309. [DOI] [PubMed] [Google Scholar]
- 35. Ellenbogen KA, Levine JH, Berger RD, et al. Are implantable cardioverter defibrillator shocks a surrogate for sudden cardiac death in patients with nonischemic cardiomyopathy? Circulation 2006;113:776–782. [DOI] [PubMed] [Google Scholar]