

Abstract
The identification of patients at risk for sudden cardiac death (SCD) is still a significant challenge to clinicians and scientists. Noninvasive identification of high‐risk patients has been of great interest, and several ventricular depolarization and repolarization abnormalities in the standard 12‐lead electrocardiogram (ECG) have been associated with increased vulnerability to lethal ventricular arrhythmias. Several benign and pathological conditions can induce changes in repolarization detected as alteration of the ST segment or T wave. Changes in the ST segment and T waves can be early markers of an underlying cardiovascular disease, and even minor ST‐T abnormalities have predicted reduced survival and increased risk of SCD in the adult population. In this review, we will discuss the current knowledge of the SCD risk with standard 12‐lead ECG T wave abnormalities in the general population, and possible T wave changes in various cardiac conditions predisposing to SCD.
Keywords: electrophysiology‐cardiac arrest/sudden death, clinical; noninvasive techniques; electrocardiography, clinical
Sudden cardiac death (SCD) is the most common, and often the first manifestation, of coronary heart disease (CHD). It is estimated to cause approximately 50% of the annual cardiovascular deaths, and its occurrence in the general population is approximately 2 per thousand a year.1 The identification of patients at risk for SCD is still a significant challenge to clinicians and scientists. Noninvasive identification of high‐risk patients has been of great interest, and several ventricular depolarization and repolarization abnormalities in the standard 12‐lead electrocardiogram (ECG) have been associated with increased vulnerability to lethal ventricular arrhythmias. These ventricular repolarization abnormalities have among others included several T wave–associated ECG changes, which are found in apparently healthy subjects, but more frequently in hospital and clinical settings.
Several benign and pathological conditions can induce changes in repolarization detected as alteration of the ST segment or T wave. These primary repolarization abnormalities include myocardial ischemia, other structural heart diseases, electrolyte disturbances, drugs, changes in the sympathetic tone, and hyperventilation.2 Changes in the ST segment and T waves can be early markers of an underlying cardiovascular disease, and even minor ST‐T abnormalities have predicted reduced survival and increased risk of SCD in the adult population 3, 4 In this review, we will discuss the current knowledge of the SCD risk with standard 12‐lead ECG T wave abnormalities in general population, and possible T wave changes in cardiac conditions predisposing to SCD.
T WAVE ABNORMALITIES AND THE RISK OF SCD IN GENERAL POPULATION
T Wave Inversion
Generally, the T wave amplitude is usually upright in all leads, except the aVR and V1 leads, with maximal amplitudes in precordial leads V2 and V3. Especially in young adults and females, minor T wave inversion in V2 and in inferior leads can represent normal variation. Widespread T inversion in general is rare in adults, although there is significant racial variation.2 An example ECG of T wave inversion in precordial leads is presented in Figure 1.
Figure 1.
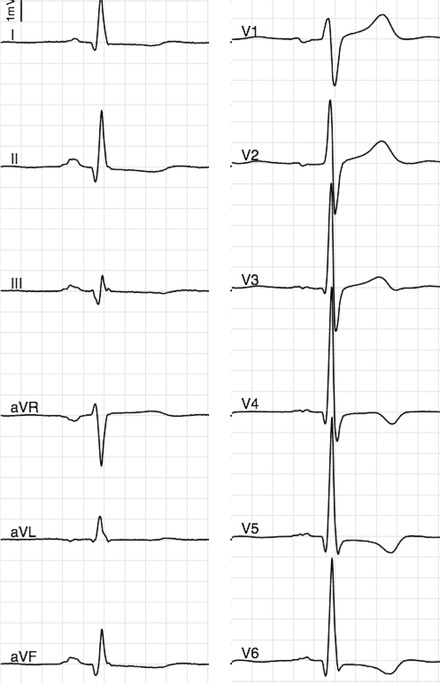
Abnormal T wave inversion in leads V4–V6 in a middle‐aged male. T wave inversion in leads other than V1–V3 has been associated with a threefold risk of SCD in general population.
In a large general population sample of asymptomatic Finnish middle‐aged subjects, T wave inversion was present in right precordial leads (leads V1 to V3) in 0.5% of individuals and in 0.7% of individuals in other leads.5 The prognosis associated with inverted T waves in right precordial leads did not differ from the rest of the population, but inverted T waves in leads other than V1–V3 and/or aVR were associated with a threefold risk for SCD. These changes were present in 0.5% and 0.7% of the population, respectively. The vast majority of these cases were women and had only mild‐to‐moderate T wave inversion and the findings persisted in repeated ECG recordings during several years. More recently, similar findings have been reported in another Finnish population of men aged 42 to 61 years,6 in which isolated negative T waves were present in 2.4% of the population, and were similarly associated with a threefold risk of SCD after adjustments for age and clinical risk factors.
Abnormal QRS‐T Angle
The frontal QRS‐T angle is defined as the angle between the directions of ventricular depolarization and repolarization, which can be easily estimated from frontal plane QRS‐axis and T wave axis from standard ECG. A wide QRS‐T angle reflects either structural abnormalities affecting the depolarization or regional pathophysiological changes in ionic channels altering the sequence of repolarization. These underlying conditions may indicate subclinical diseases and an elevated risk of SCD.7, 8 An example of an abnormal frontal plane QRS‐T axis is presented in Figure 2.
Figure 2.
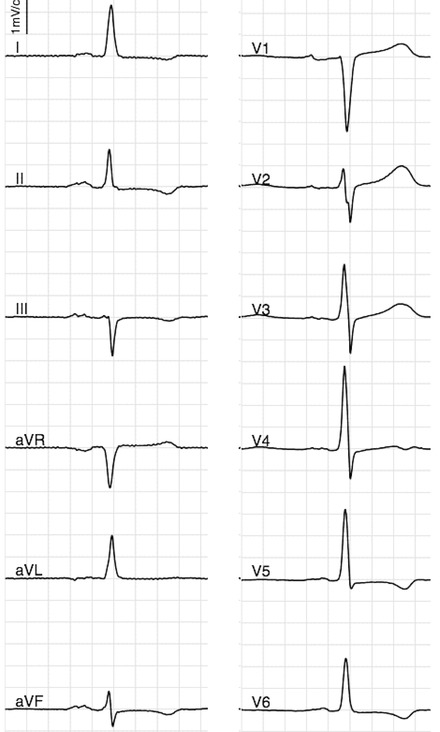
Abnormal frontal plane QRS‐T angle (>100°) due to abnormal T wave axis (in a middle‐aged individual). Abnormal QRS‐T angle is associated with twofold risk of SCD in general population.
In middle‐aged general population, QRS‐T angle ≥100° has been described to be present in 1.9% of the population and has been associated with over twofold risk of SCD.9 Although an abnormal T wave axis does not automatically mean abnormal QRS‐T angle, abnormal T axis seemed to confer most of the increased risk concomitant with wide QRS‐T angle, as it was associated with a similar twofold risk of SCD in that particular study.9 In another Finnish unselected male population, those with the highest quintile of QRS‐T angle (>67º) had similarly a twofold risk for SCD compared to others.6
T Wave Peak‐to‐End Interval
The interval from the peak of the T wave to the end of the T wave (Tpeak‐to‐Tend interval; TPE) is a measure of transmural dispersion of repolarization. Its prolongation is known to represent a period of potential vulnerability to reentrant ventricular arrhythmias,10 and in a population‐based case‐control study.11 prolonged TPE measured from V5 was associated with SCD also in subjects with normal QTc values. In this study, most SCD cases had TPE values >100 ms, but although this value was high in specificity, it lacks in sensitivity, and lower values for arrhythmia risk have been reported elsewhere.
However, in a more recent and larger prospective study in general population sample, there was no association found between prolonged TPE and SCD.12 In this sample of >5600 individuals with nearly 8 years of follow‐up, maximum TPE interval had hazard ratios <1 before and after adjustments. Given these results, the significance of TPE interval in SCD prediction is questionable.
Computerized T Wave Morphology Parameters
Several computerized and automatically calculated measures of the three‐dimensional T wave loop can also be obtained from the standard 12‐lead ECG. These T wave morphology parameters measure temporospatial changes throughout the ventricular repolarization phase and they have possessed some prognostic value for cardiovascular mortality in population‐based studies.13, 14, 15 These often include principal component analysis (PCA), T wave morphology dispersion (TMD), total cosine R‐to‐T (TCRT), and T wave residuum (TWR). The PCA ratio is a measure of the relative roundness or fatness of the three‐dimensional T wave loop.16 TMD is a measure of the variation in T wave morphology between different ECG leads, with similar T wave morphology in different ECG leads resulting in a small TMD value and repolarization abnormalities increasing the value. TCRT is an estimate of the spatial deviation between depolarization and repolarization phases, with a high TCRT value referring to a small angle between R and T wave loop vectors, resulting from normal depolarization and repolarization phases.17 TWR is a measure of nondipolar ECG signal content, with higher values indicating higher degrees of ventricular repolarization heterogeneity.18 In a recent prospective study referred to earlier,12 all of these T wave parameters stratified the SCD risk in general population. The strongest predictor of SCD in this sample was TMD with adjusted hazard ratio of 1.41 – 1, 7 for SCD. TCRT and TMD also remained significant predictors of SCD after multivariate adjustments including QT‐interval, indicating that T wave morphology parameters and QT‐interval characterize different aspects of the ventricular repolarization.
T WAVE ABNORMALITIES IN CARDIAC DISEASE
T wave abnormalities can be encountered in several cardiac conditions, including structural and ion channel disorders, and they can be an early sign of the underlying pathology. Thus, the recognition of these patterns is of importance for prediction and prevention of SCD also in asymptomatic individuals.
Arrhythmogenic Right Ventricular Dysplasia
Arrhythmogenic right ventricular dysplasia (ARVD) or cardiomyopathy is a rare genetic disease. The disease usually involves right ventricular outflow tract, where normal myocardium is replaced by fatty infiltration and fibrosis, and it is a common cause of SCD in young and athletes.19 The prevalence of ARVD is unknown due to challenging diagnosis, but it is estimated to be 0.02%.20, 21
Repolarization abnormalities in the ECG seem to be early and quite sensitive markers of disease expression in ARVD, and they are present in up to 90% of ARVD patients.22 Because a characteristic Epsilon wave is a rare finding in the general population,23 the most significant abnormalities in the ECG criteria of ARVD in addition to QRS changes in V1 to V3 are repolarization abnormalities manifested as T wave changes. Inverted T waves in precordial leads V1–V3 are recognized as major criteria, because they have the optimal sensitivity and specificity for identifying ARVD patients.24 However, these changes are still mostly ignored in clinical situations. The presence of complete right bundle branch block and inverted T waves beyond V3 are considered as minor criteria for ARVD.25 Please see Figure 3 for an example of ECG patient with ARVD.
Figure 3.
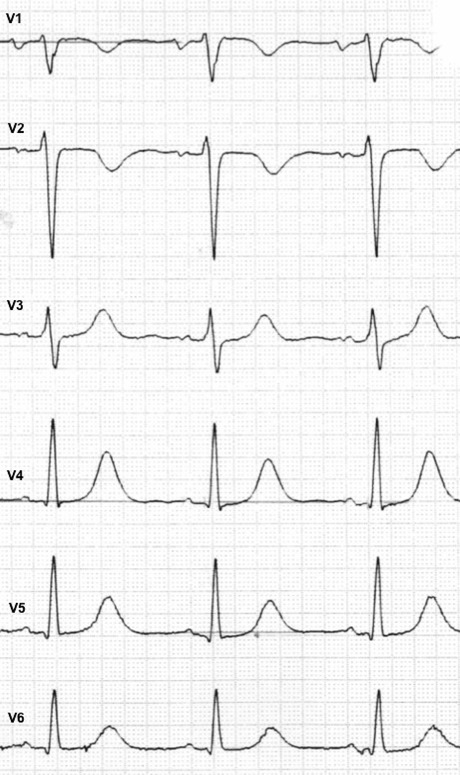
ECG of an individual with ARVD showing T‐inversion in V1 and V2.
Brugada Syndrome
The Brugada syndrome (BrS) is an inherited arrhythmic disorder, which is recognized as an important cause of SCD in young men, especially in Southeast Asia. There are three different subtypes of Brugada ECG patterns (see below), of which the type 1 is required for the diagnosis of BrS. Types 2 and 3 are considered as suggestive, but not diagnostic for BrS in the absence of documented arrhythmias, unexplained syncope or drug‐induced/spontaneous conversion to a typical type 1 pattern. The three types of Brugada ECG patterns are presented in Figure 4. The prevalence of Brugada type 1 ECG pattern among the general population in European region ranges from 0% to 0.2%.26, 27 The annual risk of malignant arrhythmias in BrS ranges from 0.5% to 8%, depending on prior symptoms.28, 29
Figure 4.
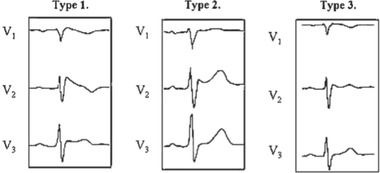
Example ECGs of the three phenotypes of Brugada ECG with various ST and T wave alterations. Type 1 is the typical coved ST‐elevation pattern with inverted T waves. In type 2, the T waves are upright, and type 3 has only mild ST changes. Reprinted from European Heart Journal with permission (2004;25:874–878).
The diagnosis of BrS can be made by recognizing its distinct ECG pattern from baseline or drug‐induced ECG changes. The electrocardiographic features include ST‐elevation in right precordial leads in combination with an atypical right bundle branch block pattern and T wave abnormalities. The type 1 pattern is described as a coved ST‐elevation over 2 mm followed by a negative T wave in at least two right precordial leads. In types 2 and 3, T wave inversion is not present.30
Early Repolarization
The term early repolarization has historically been used to describe benign ST‐elevations in precordial leads for decades, but recently J waves especially in the inferior and/or lateral leads of the ECG have been referred to as early repolarization after an apparent overpresentation of early repolarization in patients with unexplained VF. Several epidemiological studies have shown that this ECG pattern is associated with an increased risk of arrhythmic death and mortality either as a primary cause of sudden death in the general population or in conjunction with concurrent cardiac disease.31, 32, 33, 34 A recent meta‐analysis summarized the reported studies and showed that individuals with the early repolarization ECG pattern had a relative risk of 1.7 of experiencing an arrhythmia‐related death.35
High‐amplitude inferolateral J waves followed by horizontal or descending ST segments (and rarely T wave inversion), as shown in Figure 5, are believed to possess the highest risk of malignant arrhythmias in those with the early repolarization pattern.36 This ECG pattern with horizontal or descending ST segments has also been helpful in distinguishing idiopathic VF patients from matched controls, and thus it might be useful in clinical decision making separating the benign early repolarization patterns from potentially more malignant forms.37
Figure 5.
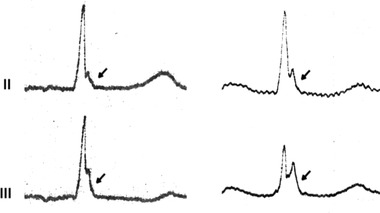
Early repolarization pattern, i.e., terminal QRS slurring and notching in two individuals, with horizontal/downsloping ST segments. This pattern of J wave with horizontal/downsloping ST segment is associated with a twofold risk of SCD in general population. Reprinted from Circulation with permission (2011;123:2666–2673).
Left Ventricular Hypertrophy, Hypertrophic and Obstructive Cardiomyopathies
In patients with left ventricular hypertrophy (LVH), ST and T wave changes are observed in approximately 70% of the cases. These changes result from altered repolarization of the ventricular myocardium caused by LVH and are collectively referred to as strain patterns. T wave inversion has been reported to be present in 55% of patients with ECG‐diagnosed LVH.38, 39
Hypertrophic cardiomyopathy (HCM) involves myocardial hypertrophy in the absence of any obvious hemodynamic load that could cause extensive hypertrophy. It is a common cause of SCD in young adults, with prevalence estimation of 0.2%.40 In apical HCM, there is a possibility for the absence of increased voltages, but prominent T wave inversion in the anterolateral leads is usually present. Similar ECG changes can be observed among young male athletes, with so‐called athlete's hearts, but in those situations, repolarization changes are less prominent.41
Dilated cardiomyopathy (DCM) is a condition in which the left or both ventricles dilate leading to dysfunction of the heart and the symptoms of heart failure. The prevalence of DCM is estimated to be under 0.04%, but SCD is commonly the first manifestation of the disease. ST‐T wave abnormalities particularly in the lateral leads are common but nonspecific.
Long QT Syndrome
The long QT syndrome (LQTS) is an inherited syndrome characterized by prolongation of the heart rate‐corrected QT interval in a standard ECG with vulnerability for SCD. The prevalence of LQTS has been estimated to be 4/10,000.42 but the disorder remains underdiagnosed as some of the LQTS gene carriers have a normal QTc duration. In addition to QT interval prolongation, morphological T wave abnormalities, such as notched and/or biphasic T waves, can be present. Several mutations have been associated with inherited LQTS, but three subtypes (LQT 1–3) account for the vast majority of cases.
Some typical ST‐T patterns exist in LQT1, LQT2, and LQT3 genotypes (Figure 6), which can be used to identify those genotypes in LQTS patients and families.42 In LQT1, the T waves are typically broad‐based, peaked and asymmetrical. Bifid T waves are the hallmark of LQT2, and in LQT3, the T waves are often distinct, peaked, late‐onset, and/or biphasic.
Figure 6.
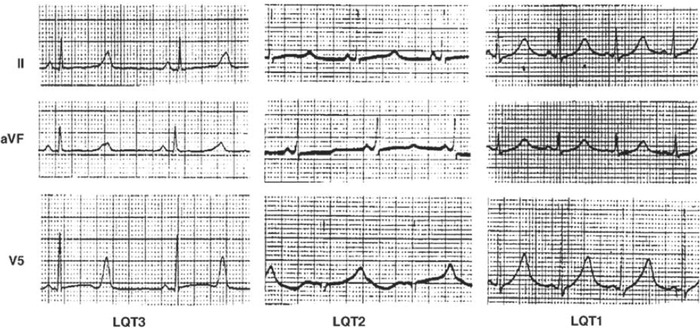
Example ECGs of three different phenotypes in long QT syndrome. Reprinted from Circulation (1995;92:2929–2934).
SUMMARY
Standard 12‐lead ECG is not only an important tool in the diagnosis of various cardiac conditions, but it also provides valuable information in risk stratification. Among other electrocardiographic abnormalities, several T wave changes have recently been associated with increased risk of SCD in the general population. Those individuals with inverted T waves and/or abnormal QRS‐T angle, as well as prolonged T wave peak‐to‐end interval seem to possess a two‐ to threefold risk of suffering SCD on a population level, even after adjusting for conventional risk factors. Although the positive predictive value of these variants remains low, those individuals with T wave abnormalities will often benefit from further clinical evaluation and closer follow‐up, as in some situations these changes may be an early sign of underlying cardiac pathology.
The authors declare that there are no conflicts of interest.
REFERENCES
- 1. Huikuri HV, Castellanos A, Myerburg RJ. Sudden death due to cardiac arrhythmias. N Engl J Med 2001;345:1473–1482. [DOI] [PubMed] [Google Scholar]
- 2. Rautaharju PM, Surawicz B, Gettes LS, et al. AHA/ACCF/HRS recommendations for the standardization and interpretation of the electrocardiogram: Part IV: The ST segment, T and U waves, and the QT interval: A scientific statement from the American Heart Association Electrocardiography and Arrhythmias Committee, Council on Clinical Cardiology; The American College of Cardiology Foundation; and The Heart Rhythm Society. Endorsed by the International Society for Computerized Electrocardiology. J Am Coll Cardiol 2009;53:982–991. [DOI] [PubMed] [Google Scholar]
- 3. Cuddy TE, Tate RB. Sudden unexpected cardiac death as a function of time since the detection of electrocardiographic and clinical risk factors in apparently healthy men: The Manitoba follow‐up study, 1948 to 2004. Can J Cardiol 2006;22:205–211. [DOI] [PMC free article] [PubMed] [Google Scholar]
- 4. Greenland P, Xie X, Liu K, et al. Impact of minor electrocardiographic ST‐segment and/or T–wave abnormalities on cardiovascular mortality during long‐term follow‐up. Am J Cardiol 2003;91:1068–1074. [DOI] [PubMed] [Google Scholar]
- 5. Aro AL, Anttonen O, Tikkanen JT, et al. Prevalence and prognostic significance of T–wave inversions in right precordial leads of a 12‐lead electrocardiogram in the middle‐aged subjects. Circulation 2012;125:2572–2577. [DOI] [PubMed] [Google Scholar]
- 6. Laukkanen JA, Di Angelantonio E, Khan H, et al. T–wave inversion, QRS duration, and QRS/T angle as electrocardiographic predictors of the risk for sudden cardiac death. Am J Cardiol 2014;113:1178–1183. [DOI] [PubMed] [Google Scholar]
- 7. Pavri BB, Hillis MB, Subacius H, et al. Prognostic value and temporal behavior of the planar QRS‐T angle in patients with nonischemic cardiomyopathy. Circulation 2008;117:3181–3186. [DOI] [PubMed] [Google Scholar]
- 8. Borleffs CJ, Scherptong RW, Man SC, et al. Predicting ventricular arrhythmias in patients with ischemic heart disease: Clinical application of the ECG‐derived QRS‐T angle. Circ Arrhythm Electrophysiol 2009;2:548–554. [DOI] [PubMed] [Google Scholar]
- 9. Aro AL, Huikuri HV, Tikkanen JT, et al. QRS‐T angle as a predictor of sudden cardiac death in a middle‐aged general population. Europace 2012;14:872–876. [DOI] [PubMed] [Google Scholar]
- 10. Yan GX, Antzelevitch C. Cellular basis for the normal T wave and the electrocardiographic manifestations of the long‐QT syndrome. Circulation 1998;98:1928–1936. [DOI] [PubMed] [Google Scholar]
- 11. Panikkath R, Reinier K, Uy‐Evanado A, et al. Prolonged Tpeak‐to‐tend interval on the resting ECG is associated with increased risk of sudden cardiac death. Circ Arrhythm Electrophysiol 2011;4:441–447. [DOI] [PMC free article] [PubMed] [Google Scholar]
- 12. Porthan K, Viitasalo M, Toivonen L, et al. Predictive value of electrocardiographic T–wave morphology parameters and T–wave peak to T–wave end interval for sudden cardiac death in the general population. Circ Arrhythm Electrophysiol 2013;6:690–696. [DOI] [PubMed] [Google Scholar]
- 13. Zabel M, Malik M, Hnatkova K, et al. Analysis of T–wave morphology from the 12‐lead electrocardiogram for prediction of long‐term prognosis in male US veterans. Circulation 2002;105:1066–1070. [DOI] [PubMed] [Google Scholar]
- 14. Okin PM, Malik M, Hnatkova K, et al. Repolarization abnormality for prediction of all‐cause and cardiovascular mortality in American Indians: The strong heart study. J Cardiovasc Electrophysiol 2005;16:945–951. [DOI] [PubMed] [Google Scholar]
- 15. Perkiomaki JS, Hyytinen‐Oinas M, Karsikas M, et al. Usefulness of T–wave loop and QRS complex loop to predict mortality after acute myocardial infarction. Am J Cardiol 2006;97:353–360. [DOI] [PubMed] [Google Scholar]
- 16. Okin PM, Devereux RB, Lee ET, et al., Strong Heart Study . Electrocardiographic repolarization complexity and abnormality predict all‐cause and cardiovascular mortality in diabetes: The strong heart study. Diabetes 2004;53:434–440. [DOI] [PubMed] [Google Scholar]
- 17. Acar B, Yi G, Hnatkova K, et al. Spatial, temporal and wavefront direction characteristics of 12‐lead T–wave morphology. Med Biol Eng Comput 1999;37:574–584. [DOI] [PubMed] [Google Scholar]
- 18. Malik M, Acar B, Gang Y, et al. QT dispersion does not represent electrocardiographic interlead heterogeneity of ventricular repolarization. J Cardiovasc Electrophysiol 2000;11:835–843. [DOI] [PubMed] [Google Scholar]
- 19. Thiene G, Nava A, Corrado D, et al. Right ventricular cardiomyopathy and sudden death in young people. N Engl J Med 1988;318:129–133. [DOI] [PubMed] [Google Scholar]
- 20. Norman MW, McKenna WJ. Arrhythmogenic right ventricular cardiomyopathy: Perspectives on disease. Z Kardiol 1999;88:550–554. [DOI] [PubMed] [Google Scholar]
- 21. Cox MG, van der Smagt JJ, Wilde AA, et al. New ECG criteria in arrhythmogenic right ventricular dysplasia/cardiomyopathy. Circ Arrhythm Electrophysiol 2009;2:524–530. [DOI] [PubMed] [Google Scholar]
- 22. Dalal D, Nasir K, Bomma C, et al. Arrhythmogenic right ventricular dysplasia: A United States experience. Circulation 2005;112:3823–3832. [DOI] [PubMed] [Google Scholar]
- 23. Uhm JS, Hwang IU, Oh YS, et al. Prevalence of electrocardiographic findings suggestive of sudden cardiac death risk in 10,867 apparently healthy young Korean men. Pacing Clin Electrophysiol 2011;34:717–723. [DOI] [PubMed] [Google Scholar]
- 24. Jain R, Dalal D, Daly A, et al. Electrocardiographic features of arrhythmogenic right ventricular dysplasia. Circulation 2009;120:477–487. [DOI] [PMC free article] [PubMed] [Google Scholar]
- 25. Marcus FI, McKenna WJ, Sherrill D, et al. Diagnosis of arrhythmogenic right ventricular cardiomyopathy/dysplasia: Proposed modification of the task force criteria. Circulation 2010;121:1533–1541. [DOI] [PMC free article] [PubMed] [Google Scholar]
- 26. Junttila MJ, Raatikainen MJ, Karjalainen J, et al. Prevalence and prognosis of subjects with Brugada‐type ECG pattern in a young and middle‐aged Finnish population. Eur Heart J 2004;25:874–878. [DOI] [PubMed] [Google Scholar]
- 27. Sinner MF, Pfeufer A, Perz S, et al. Spontaneous Brugada electrocardiogram patterns are rare in the German general population: Results from the KORA study. Europace 2009;11:1338–1344. [DOI] [PubMed] [Google Scholar]
- 28. Probst V, Veltmann C, Eckardt L, et al. Long‐term prognosis of patients diagnosed with Brugada syndrome: Results from the FINGER Brugada syndrome registry. Circulation 2010;121:635–643. [DOI] [PubMed] [Google Scholar]
- 29. Giustetto C, Drago S, Demarchi PG, et al. Risk stratification of the patients with Brugada type electrocardiogram: A community‐based prospective study. Europace 2009;11:507–513. [DOI] [PubMed] [Google Scholar]
- 30. Antzelevitch C, Brugada P, Borggrefe M, et al. Brugada syndrome: Report of the second consensus conference. Heart Rhythm 2005;2:429–440. [DOI] [PubMed] [Google Scholar]
- 31. Tikkanen JT, Anttonen O, Junttila MJ, et al. Long‐term outcome associated with early repolarization on electrocardiography. N Engl J Med 2009;361:2529–2537. [DOI] [PubMed] [Google Scholar]
- 32. Sinner MF, Reinhard W, Muller M, et al. Association of early repolarization pattern on ECG with risk of cardiac and all‐cause mortality: A population‐based prospective cohort study (MONICA/KORA). PLoS Med 2010;7:e1000314. [DOI] [PMC free article] [PubMed] [Google Scholar]
- 33. Haruta D, Matsuo K, Tsuneto A, et al. Incidence and prognostic value of early repolarization pattern in the 12‐lead electrocardiogram. Circulation 2011;123:2931–2937. [DOI] [PubMed] [Google Scholar]
- 34. Haissaguerre M, Derval N, Sacher F, et al. Sudden cardiac arrest associated with early repolarization. N Engl J Med 2008;358:2016–2023. [DOI] [PubMed] [Google Scholar]
- 35. Wu SH, Lin XX, Cheng YJ, et al. Early repolarization pattern and risk for arrhythmia death: A meta‐analysis. J Am Coll Cardiol 2013;61:2027–2028. [DOI] [PubMed] [Google Scholar]
- 36. Tikkanen JT, Junttila MJ, Anttonen O, et al. Early repolarization: Electrocardiographic phenotypes associated with favorable long‐term outcome. Circulation 2011;123:2666–2673. [DOI] [PubMed] [Google Scholar]
- 37. Rosso R, Glikson E, Belhassen B, et al. Distinguishing "benign" from "malignant early repolarization": The value of the ST‐segment morphology. Heart Rhythm 2012;9:225–229. [DOI] [PubMed] [Google Scholar]
- 38. Ofman P, Cook JR, Navaravong L, et al. T–wave inversion and diastolic dysfunction in patients with electrocardiographic left ventricular hypertrophy. J Electrocardiol 2012;45:764–769. [DOI] [PubMed] [Google Scholar]
- 39. Wachtell K, Okin PM, Olsen MH, et al. Regression of electrocardiographic left ventricular hypertrophy during antihypertensive therapy and reduction in sudden cardiac death: The LIFE study. Circulation 2007;116:700–705. [DOI] [PubMed] [Google Scholar]
- 40. Maron BJ, Thompson PD, Puffer JC, et al. Cardiovascular preparticipation screening of competitive athletes: Addendum: An addendum to a statement for health professionals from the sudden death committee (council on clinical cardiology) and the congenital cardiac defects committee (council on cardiovascular disease in the young), American Heart Association. Circulation 1998;97:2294. [DOI] [PubMed] [Google Scholar]
- 41. Corrado D, Pelliccia A, Heidbuchel H, et al. Recommendations for interpretation of 12‐lead electrocardiogram in the athlete. Eur Heart J 2010;31:243–259. [DOI] [PubMed] [Google Scholar]
- 42. Schwartz PJ, Stramba‐Badiale M, Crotti L, et al. Prevalence of the congenital long‐QT syndrome. Circulation 2009;120:1761–177. [DOI] [PMC free article] [PubMed] [Google Scholar]
- 43. Zhang L, Timothy KW, Vincent GM, et al. Spectrum of ST‐T–wave patterns and repolarization parameters in congenital long‐QT syndrome: ECG findings identify genotypes. Circulation 2000;102:2849–2855. [DOI] [PubMed] [Google Scholar]