Abstract
Aim
The objective of our study was to assess diagnostic value of three‐dimensional (3D) vectorcardiographic (VCG) parameters in detecting pulmonary arterial hypertension (PAH) in chronic obstructive lung disease (COLD) with and without right ventricular hypertrophy (RVH).
Methods
The study group of 62 patients with COPD was stratified on the basis of color Doppler echocardiographic findings into three subgroups: non‐PAH (n = 23), PAH without RVH (n = 22), and PAH with RVH (n = 17). Pairwise differences between the subgroups were evaluated by one‐way analysis of variance, and Pearson correlation analysis was used to evaluate the significance of the correlations between pulmonary arterial systolic pressure (PASP) and various VCG parameters.
Results
The azimuth of the QRS vector decreased from −24° in the non‐PAH group to −62° in PAH without RVH and to −140° in PAH with RVH (P < 0.01 for pairwise differences between all three groups). Similar significant decrease was observed for the azimuth of the ventricular gradient (VG) vector. Spatial QRS/T angle increased from 69° in the non‐PAH group to 115° in PAH without RVH (P < 0.01). In the PAH group with RVH, QRS/T angle was 94° (P < 0.05 for difference from the non‐PAH group). There was a significant correlation between PASP and QRS/T angle (r = 0.89, P < 0.05) and between PASP and the azimuth of the VG vector (r = 0.86, P < 0.05). PASP increase from linear regression model was 0.8 mmHg for a QRS/T angle increase by 10° and 1.3 mmHg for each 10° increase in the azimuth of the VG vector.
Conclusion
3DVCG parameters are potentially useful for predicting PASP in COLD patients, and possibly also for differentiation between COLD patients with PAH and RVH from those without RVH.
Keywords: pulmonary chronic obstructive, pulmonary arterial hypertension, vectorcardiography, electrocardiography
Chronic obstructive pulmonary disease (COPD) is often associated with the changes of the structure and hemodynamic of the heart, such as chronically increased right ventricular (RV) pressure load and RV hypertrophy in response to pulmonary hypertension (PAH). Because the classical manifestations of these changes occur late and are confounded by COPD, it is often delayed to diagnosis by symptoms and signs. Hence, more simple and practical noninvasive diagnostic tests are warranted to allow earlier detection of the disease. Conventional 12‐lead electrocardiography (ECG) parameters lack diagnostic accuracy, precluding their use for screening purposes, partly because they render separate one‐dimensional (1D) projections of the three‐dimensional (3D) cardiac vector in time, and partly because the RV mass is relatively low and is often concealed by the left ventricular (LV) mass.1, 2, 3, 4 The 3D vectorcardiographic (VCG) has been considered of additional value to ECG analysis, because it renders different information and allows calculation of parameters that cannot be computed from separate ECG leads. The purpose of this study is therefore to appreciate the potential diagnostic value of 3DVCG in identifying these abnormalities.
METHODS
Study Population
The study population consisted of patients who were admitted for the recent diagnosis of COPD to Liaoning Medical College between July 2010 and July 2011. Patients were included if the following criteria were met: diagnosis of COPD, according to the criteria of ICSI Health Care Guideline.5 Patients’ exclusion criteria was presented in Table 1. Sixty‐two consecutive patients collected were evaluated with a color Doppler echocardiography, and defined as non‐PAH (23 consecutive adults with normal pulmonary artery systolic pressure), PAH (22 patients with PAH), and PAH with RV hypertrophy (17 patients with PAH and RV hypertrophy). General patient characteristics were given in Table 2. There were no statistically significant differences between the three groups in terms of sex, age, body mass index (BMI), heart rate (HR; P > 0.10).
Table 1.
Exclusion Criteria
| 1. Diopathic pulmonary arterial hypertension |
| 2. Secondary pulmonary hypertension |
| 2.1. Congenital heart disease |
| 2.2. Portal hypertension |
| 2.3. Collagen vascular disease |
| 2.4. HIV infection |
| 2.5. Left heart disease |
| 2.6. Chronic thromboembolic disease |
| 3. Coronary heart disease |
| 4. Systemic hypertension |
| 5. Arrhythmia |
| 6. Any hemodynamic abnormality that can affect pulmonary artery systolic pressure (PASP) |
Table 2.
Clinical Characteristics of the Total Population
| Characteristics | Non‐PAH | PAH | PAH with RV Hypertrophy | F/X2 | P |
|---|---|---|---|---|---|
| Age (years) | 69.12 ± 12.34 | 64.1 ± 11.74 | 68.46 ± 6.61 | 2.05 | 0.13 |
| BMI (kg/m2 | 20.90 ± 3.88 | 20.11 ± 3.28 | 21.24 ± 2.68 | 0.90 | 0.41 |
| HR (beats/min) | 85.82 ± 13.85 | 88.9 ± 13.53 | 93.38 ± 14.21 | 2.20 | 0.12 |
| Female gender | 13 (56.52) | 12 (54.55) | 9 (52.94) | 0.20 | 0.91 |
Values are presented as means and standard deviation or No. (%), unless otherwise indicated.
The Assessment of Pulmonary Artery Systolic Pressure using Transthoracic Color Doppler Echocardiography
Echocardiograms were performed by one technician (E.C.) using a Philips Sonos 5500 with a 3.2 MHz transducer (Philips Medical Systems, Andover, MA, USA). Pulmonary artery systolic pressure (PASP) was obtained from the formula: PASP = RAP + 4V2, RAP was right atrial pressure and the V refers to velocity of tricuspid regurgitation. RAP was estimated by evaluating the inferior vena cava (IVC) size and change with respiration. Briefly, RAP was estimated to be 5 mmHg when the IVC diameter was less than 20 mm and the collapsibility greater than 50%; 10 mmHg when IVC diameter was less than 20 mm and collapsibility less than 50%; 15 mmHg when IVC diameter was greater than 20 mm and collapsibility greater than 50%; and 20 mmHg when IVC diameter was greater than 20 mm and collapsibility less than 50%. PAH was defined as PASP beyond 37 mmHg and PAH refers to RV anterior wall thickness was 5.0 mm or more.
Three‐Dimensional Vectorcardigram Analysis
3DVCG was recorded by trained ECG technicians using the frank lead system electrode configuration with every patient in supine position. The data from each patient were acquired digitally and analyzed by two independent cardiologists who were also blinded to the transthoracic echocardiography results and patients' symptoms and signs. The record length was 18 seconds. After manually reviewing three times and editing the onset and end points of the P, QRS and T waves recorded from the orthogonal XYZ leads at a paper speed of 50 mm/s, sensitivity 1 mV = 10 mm, a synthesized 3DVCG was generated and all of the parameters were derived from the averaged orthogonal X, Y, and Z leads.
Three‐Dimensional VCG Parameters
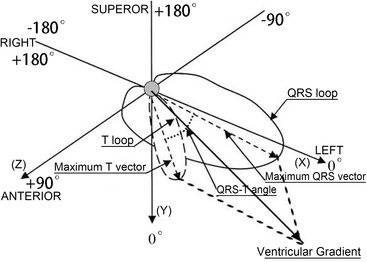
Maximum QRS and T vectors and ventricular gradient (VG) vector were computed for each patient from their averaged QRS‐T complexes, and each vector was quantified by determining spatial vector magnitude and orientation angles in frontal plane (0° left, 90° inferior, −90° superior, and ±180° right) and the horizontal plane (0° left, 90° anterior, −90° posterior, and ±180° right; Fig. 1A).6–10 The XYZ components of the VG vector were obtained as the integrals of the XYZ leads from the beginning of QRS to the end of the T wave) (Fig. 2). These parameters and the spatial angle between the maximum QRS and T vectors were used to describe the characteristics in each study group.
Figure 1.

Schematic presentation of the QRS vector loop and the maximum QRS vector in space. QRSelevation (A) is the angle between the maximum QRS vector and an axis perpendicular to the horizontal plane, 0° being the vector directed downwards. QRSazimuth (B) is the angle between the projected maximum QRS vector on the horizontal plane (XZ) and the left extremity of the X axis, 0° being the vector pointed to the left. Forward vector directions are defined as 0° to 180°, and backward vector directions as 0° to 180°, respectively.
Figure 2.

Spatial QRS‐T angle and ventricular gradient. Spatial QRS‐T angle is the angle between the QRS and T axes. Clockwise vector motions from the QRS axis to the T axis are defined as positive, and inverse motions as negative, respectively. VG is defined as the vectorial sum of the QRS and T integrals, which is generalized by parallelogram rule in three‐dimensional geometric space.
Statistical Analysis
The SPSS 13.0 for Windows Software package was used for data analysis. Continuous data were presented as means and standard deviation. Comparison of 3DVCG–derived parameters in three groups was performed with one‐way analysis of variance with post hoc Bonferroni correction. Pearson correlation analysis was used for comparison of the ones with pulmonary artery systolic pressure in PAH. A value of P < 0.05 was considered to be statistically significant.
RESULTS
Comparison of Derived VCG Parameters in Study Subgroups
The results from the comparison of 3DVCG–derived parameters in the three study groups are summarized in Table 3. With the transition from non‐PAH to PAH without RVH and further to PAH with RVH, QRSaz decreased from −23 ± 33.0° to −62 ± 57.0° and to −140 ± 26.0 (P < 0.01 for pairwise differences between non‐PAH versus PAH without RVH groups and between the PAH groups). Similar significant trends as for QRSaz took place for VGaz. The spatial QRS‐T angle was larger in patients with PAH than those with non‐PAH (115 ± 46.1° vs. 68.7 ± 34.6°, P < 0.01), but it was narrower in patients with PAH and RV hypertrophy than those with PAH without RVH (115 ± 46.1° vs. 94 ± 38.0°, P = 0.13, although the small decrease did not reach statistical significance.
Table 3.
Comparison of 3DVCG–Derived Variables in the Three Categories
| 3DVCG Variables | Non‐PAH | PAH | PAH with RV Hypertrophy |
|---|---|---|---|
| QRSmagnitude (mV) | 1.05±0.38 | 1.03±0.27 | 0.96±0.37 |
| QRSelevation (°) | 53.02±25.56 | 79.08±33.10a | 60.5±21.32b |
| QRSazimuth (°) | −23.54±32.97c | −62.20±57.01d | −139.74±26.03e |
| Spatial QRS‐T angle (°) | 68.71±34.60f | 114.62±46.14d | 93.49±38.03b |
| The ratio of the QRSmagnitude and Tmagnitude | 3.99±2.32 | 5.80±5.03 | 6.43±4.10 |
| VGmagnitudemV | 1.15±0.32 | 0.93±0.42a | 1.03±0.37 |
| VGelevation (°) | 51.87±25.62 | 79.46±32.72a | 65.10±18.50 |
| VGazimuth (°) | −9.22±27.92c | −56.72±28.18d | −135.36±40.70e |
| Tmagnitude | 0.22±0.09 | 0.25±0.11a | 0.18±0.08 |
| Televation | −45.87±13.39f | −38.43±24.71a | −37.86±25.54 |
| Tazimuth | 19.78±7.42f | 25.87±85.8a | −7.14±6.83b |
All data are presented as means ± standard deviation. QRSmagnitude is the magnitude of the maximum QRS vector.
P < 0.05, for comparisons vs. non‐PAH.
P < 0.05, for comparisons vs. PAH.
P < 0.01, for comparisons vs PAH with RV hypertrophy.
P < 0.01, for comparisons vs. non‐PAH.
P < 0.01, for comparisons vs. PAH.
P < 0.05, for comparisons vs. PAH with RV hypertrophy.
Correlation between PAPS and 3DVCG Variables
There was a linear correlation between the QRS‐T angle and PASP in patients with PAH (r = 0.89, P < 0.05). Linear regression analysis rendered the following formula for prediction of PASP: PASP = 0.08 × QRS‐T angle + 40 (R 2 = 0.80, P < 0.05). In addition, PASP was inversely correlated with VGaz (r 2 = −0.86, P2 < 0.05), and the formula for prediction of PASP from VGaz: PASP = −0.13 × VGaz + 41 (R 2 = 0.74, P < 0.05). These formulas imply that a QRS‐T angle increase by 10° was associated with a 0.8 mmHg increase in PASP and a 10° decrease in the azimuth of the VG vector was associated a 1.3 mmHg increase in PASP.
DISCUSSION
The key results of our study were the following: (1) The azimuth of the QRS vector decreased progressively from the non‐PAH group to PAH without RVH and PAH with RVH, demonstrating a progressive shift from posterior‐left to posterior‐right. (2) A similar shift was observed in the azimuth of the VG vector. (3) The correlation between PASP and QRS‐T angle was significant (r = 0.89, P < 0.05) and similarly between PASP and the azimuth of the VG vector (r = 0.86, P < 0.05). (4) In a linear regression model, a QRS‐T angle increase by 10° was associated with a 0.8 mmHg increase in PASP and a 10° decrease in the azimuth of the VG vector was associated a 1.3 mmHg increase in PASP. These results concur with limited earlier data from an animal experiment and a clinical observation.9,10
Impact of PAH and RV Hypertrophy on the Maximum QRS Vector Azimuth in Patients with COPD
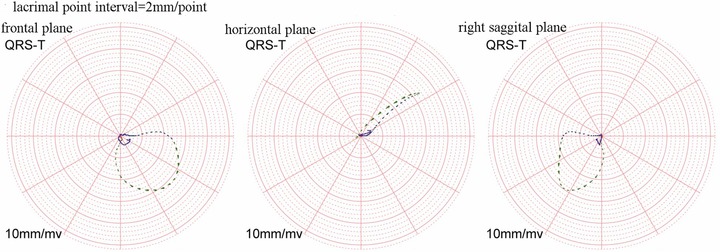
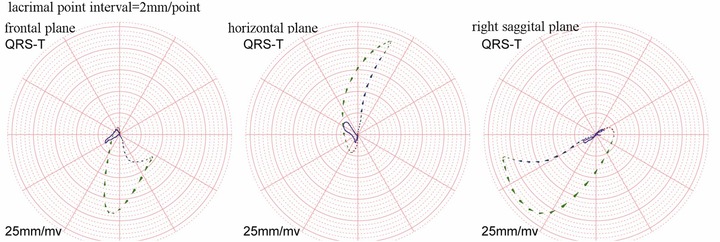
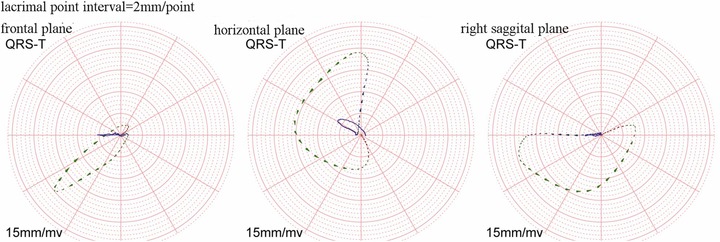
In the group of COLD patients with no PAH, the mean QRS vector is directed to inferior‐left and slightly posterior and the peak T vector to inferior‐left and slightly anterior (Table 3, Fig. 3). Because spatial direction of repolarization sequence is diametrically opposite to the direction of T vectors, the above QRS‐T relationship implies that the spatial direction of repolarization sequence is predominantly reverse with respect to depolarization during repolarization of the free LV wall. This resembles the reverse repolarization of the left ventricle in clinically normal subjects.11,12 Compared to No‐PAH group, in the PAH group with no RVH (Fig. 4), the mean QRS vector shifts further posterior (Raz decreases from −24° in the No‐PAH to −62°) with little change in the direction of the mean T vector. Finally, in the PAH group with RVH, QRS peak vector shifts to posterior‐right (Raz decreases to −140°) and in both PAH groups QRS vector direction remains prominently inferior. The prominent right‐inferior orientation of the mean QRS vector is exemplified in Figure 5 from the frontal and horizontal plane loops from a representative patient of that group. The wide horizontal plane QRS loop of the patient is seen rotating from left‐anterior to right‐anterior and then having an increasingly prominent terminal posterior orientation. The T vector loop orientation in the horizontal plane indicates that except for a relatively short initial period, the direction of terminal repolarization is prominently reverse with respect to the direction of depolarization.
Figure 3.

QRS and T vector loops of one patient in non‐PAH. The azimuth is −38.15° and the elevation is 58.24°. The big head of lacrimal point is the rotation direction forward.
Figure 4.

QRS and T vector loops of one patient in PAH. The azimuth is −70.66° and the elevation is 76.42°. The big head of lacrimal point is the rotation direction forward.
Figure 5.

QRS and T vector loops of one patient in PAH with RV hypertrophy. The azimuth is −163.85° and the elevation is 50.31°. The big head of lacrimal point is the rotation direction forward.
Interpretation of the Finding and Possible Mechanisms for the Findings
The notion of VG was introduced by Wilson in 1934 as a net time integral of QRS–STT complexes of any single lead ECG.13 The concept was generalized as a 3D VG vector by Burger,14 who noted that under simplified assumptions VG was independent of the origin of cardiac excitation. In a uniform nerve fiber with constant action, potential waveform and action potential duration (APD) VG = 0. The cardiac situation is far more complex, with hemodynamic conditions changed with respect to intracavitary blood volume (Brody effect), fiber orientation, walls strain distribution, distance from cardiac source to recording points, and many other factors.
Of particular interest is the interpretation of the findings in PAH with respect to directional relationships between QRS and T vectors, QRS‐T angle, and VG. In clinically normal persons and evidently also in the COLD group with non‐PAH in LV free wall, the epicardial APDs are shorter than endocardial APD.11,12 Ionic channel currents regulating APD are involved as the mechanism. LV epicardial layers where repolarization normally starts have higher levels of transient outward potassium current (Ito) expression. This accounts for the reverse repolarization sequence (and nonzero VG) of the left ventricle. However, terminal repolarization sequence in clinically normal subjects is concordant with respect to depolarization direction.
The situation changes progressively in patients with PAH, with mean QRS vectors shifting posterior and then posterior‐right and terminal repolarization sequence direction becoming progressively more reverse (as already noted referring to Figure 5 and Table 3) in particular in the group with PAH and RVH. In the latter group hypertrophied RV wall in the region of pulmonary cone and supraventricular repolarization is closely reverse with respect to depolarization sequence. Reverse repolarization sequence necessitates the assumption that RV epicardial APD become shorter than endocardial APD. Overall, VG magnitude increase and the VG azimuth change parallel increasing QRS/T angle. Henkens et al.9,10 found in rats with experimentally induced RVH a drastic increase in QRS/T angle by 25 days with terminal repolarization sequence changing from normal concordant to reverse sequence. These authors considered the these changes as an adaptive mechanism also suggesting that downregulation of RV load‐ (stretch‐) dependent voltage‐gated potassium channels is likely involved.
The above directional QRS/T relationships also explain the observed correlation of QRS/T angle and VGaz with PAH in Table 4 and the observed predictability of PAH from QRS/T angle and VGaz.
Table 4.
Correlation Coefficients between Pulmonary Arterial Systolic Pressure and the 3DVCG Variables
| 3DVCG | Correlation | |
|---|---|---|
| Variables | Coefficient | P Value |
| QRSmagnitude | 0.608 | >0.05 |
| QRSelevation | 0.594 | >0.05 |
| QRSazimuth | −0.529 | >0.05 |
| QRS‐T angle | 0.89 a | <0.05 |
| VGmagnitude | 0.521 | >0.05 |
| VGelevation | 0.668 | >0.05 |
| VGazimuth | −0.86 a | <0.05 |
indicates P < 0.05.
CONCLUSION
Our results suggest that 3DVCG parameters may be useful for predicting PASP in COLD patients, and possibly also for differentiation between COLD patients with PAH and RVH from those without RVH.
ACKNOWLEDGMENTS
The clinical observation was carried out in Respiratory as a collaborative study supported by Xiaoguang Chen and so on. The doctors in the Department of Ultrasound also assisted in this research project. The authors thank the staff and participants of the study for their important contributions.
Authors Contributions: D. Pan carried out the COPD studies, participated in design, data collection, the laboratory analyses, the statistical analyses, and the drafting of the manuscript. R. Liu conceived of the study, and participated in its design and coordination and helped to revise it critically for important intellectual content and gave final approval of the version to be published. S. Ren, C. Li, and Q. Chang contributed to the data collection, the revise of the manuscript for important intellectual content. All authors read and approved the final manuscript.
We state that patients have given their informed consent and that the study protocol has been approved by the institute's committee on human research of Jinzhou.
This study was supported by the Science research fund from Liaoning province under Grant No. 201202139.
REFERENCES
- 1. McLaughlin VV, Archer SL, Badesch DB, et al. ACCF/AHA 2009 expert consensus document on pulmonary hypertension: a report of the American College of Cardiology Foundation Task Force on Expert Consensus Documents and the American Heart Association: developed in collaboration with the American College of Chest Physicians, American Thoracic Society, Inc., and the Pulmonary Hypertension Association. Circulation 2009; 119: 2250–2294. [DOI] [PubMed] [Google Scholar]
- 2. Jyothula S, Safdar Z. Update on pulmonary hypertension complicating chronic obstructive pulmonary disease. Int J Chron Obstruct Pulmon Dis 2009;4:351–363. [DOI] [PMC free article] [PubMed] [Google Scholar]
- 3. Groenewegen KH, Schols AM, Wouters EF. Mortality and mortality‐related factors after hospitalization for acute exacerbation of COPD. Chest 2003; 124:459–467. [DOI] [PubMed] [Google Scholar]
- 4. Bratel T. Pulmonary circulation in chronic obstructive pulmonary disease (COPD). Clin Pulmonary Med 2010;17:111–116. [Google Scholar]
- 5. Bozarth AL, Covey A, Gohar A, et al. Chronic obstructive pulmonary disease: Clinical review and update on consensus guidelines. Hosp Pract 2014,42:79–91. [DOI] [PubMed] [Google Scholar]
- 6. Rubulis A, Jensen J, Lundahl G, et al. T vector and loop characteristics in coronary artery disease and during acute ischemia. Heart Rhythm 2004, 3:317–325. [DOI] [PubMed] [Google Scholar]
- 7. Rubulis A, Jensen J, Lundahl G, et al. Ischemia induces aggravation of baseline repolarization abnormalities in left ventricular hypertrophy: A deleterious interaction. J Appl Physiol 2006; 101: 102–110. [DOI] [PubMed] [Google Scholar]
- 8. Wecke L, Rubulis A, Lundahl G, et al. Right ventricular pacing–induced electrophysiological remodeling in the human heart and its relationship to cardiac memory. Heart Rhythm 2007;12:1477–1486. [DOI] [PubMed] [Google Scholar]
- 9. Henkens IR, Mouchaers KT, Vliegen HW, et al. Early changes in rat hearts with developing pulmonary arterial hypertension can be detected with three‐dimensional electrocardiography. Am J Physiol Heart Circ Physiol 2007;293:H1300–H1307. [DOI] [PubMed] [Google Scholar]
- 10. Henkens IR, Mouchaers KT, Vonk‐Noordegraaf A, et al. Improved ECG detection of presence and severity of right ventricular pressure load validated with cardiac magnetic resonance imaging. Am J Physiol Heart Circ Physiol 2008;294:H2150–H2157. [DOI] [PubMed] [Google Scholar]
- 11. Rautaharju PM, Zhang ZM, Haisty WK Jr, et al. Electrocardiographic repolarization‐related predictors of coronary heart disease and sudden cardiac deaths in men and women with cardiovascular disease in the Atherosclerosis Risk in Communities (ARIC) study. J Electrocardiol 2015;48:101–111. [DOI] [PubMed] [Google Scholar]
- 12. Rautaharju PM, Zhang ZM, Warren J, et al. Electrocardiographic predictors of coronary heart disease and sudden cardiac deaths in men and women free from cardiovascular disease in the Atherosclerosis Risk in Communities Study. J Am Heart Assoc 2013;2:e000061. [DOI] [PMC free article] [PubMed] [Google Scholar]
- 13. Draisma HH, Schalij MJ, van der Wall EE, et al. Elucidation of the spatial ventricular gradient and its link with dispersion of repolarization. Heart Rhythm 2006;3:1092–1099. [DOI] [PubMed] [Google Scholar]
- 14. Burger HC. A theoretical elucidation of the notion ventricular gradient. Am Heart J 1957;53:240–246. [DOI] [PubMed] [Google Scholar]


