

Abstract
Background
Electrocardiography (ECG) is still one of the first tests performed at admission, mostly in patients (pts) with chest pain or dyspnea. The aim of this study was to assess the correlation between electrocardiographic abnormalities and cardiac biomarkers as well as echocardiographic parameter in patients with acute pulmonary embolism.
Methods
We performed a retrospective analysis of 614 pts. (F/M 334/280; mean age of 67.9 ± 16.6 years) with confirmed acute pulmonary embolism (APE) who were enrolled to the ZATPOL‐2 Registry between 2012 and 2014.
Results
Elevated cardiac biomarkers were observed in 358 pts (74.4%). In this group the presence of atrial fibrillation (p = .008), right axis deviation (p = .004), S1Q3T3 sign (p < .001), RBBB (p = .006), ST segment depression in leads V4–V6 (p < .001), ST segment depression in lead I (p = .01), negative T waves in leads V1–V3 (p < .001), negative T waves in leads V4–V6 (p = .005), negative T waves in leads II, III and aVF (p = .005), ST segment elevation in lead aVR (p = .002), ST segment elevation in lead III (p = .0038) was significantly more frequent in comparison to subjects with normal serum level of cardiac biomarkers. In multivariate regression analysis, clinical predictors of “abnormal electrocardiogram” were as follows: increased heart rate (OR 1.09, 95% CI 1.02–1.17, p = .012), elevated troponin concentration (OR 3.33, 95% CI 1.94–5.72, p = .000), and right ventricular overload (OR 2.30, 95% CI 1.17–4.53, p = .016).
Conclusions
Electrocardiographic signs of right ventricular strain are strongly related to elevated cardiac biomarkers and echocardiographic signs of right ventricular overload. ECG may be used in preliminary risk stratification of patient with intermediate‐ or high‐risk forms of APE.
Keywords: acute pulmonary embolism, electrocardiogram, cardiac biomarkers, echocardiography
1. Introduction
Acute pulmonary embolism (APE) is one of the most frequent cardiovascular causes of death. Reducing mortality by rapid diagnosis and treatment remains a challenge worldwide. Total mortality is as high as 15% in a subgroup of patients who present with severe hypotension or cardiogenic shock (CS; Konstantinides et al., 2014; Torbicki et al., 2008). Electrocardiography (ECG) has poor sensitivity and specificity for diagnosing APE, but is still one of the first procedures performed at admission, mostly in patients who present with chest pain or dyspnea (Wellens & Conover, 2006).
The aim of this study was to assess the correlation between electrocardiographic findings and hemodynamic abnormalities, cardiac biomarkers (troponin and NT‐pro‐BNP concentration), and echocardiographic parameters in a large cohort of patients diagnosed with APE.
2. Material and Methods
We performed a retrospective analysis of patients who experienced APE and were enrolled to the ZATPOL‐2 Registry. ZATPOL‐2 was a prospective registry conducted in 20 cardiologic wards in Poland between December 2012 and August 2014. The registry covered all patients admitted to the hospital or emergency room and diagnosed with APE. The ZATPOL‐2 Registry study group consisted of 614 patients (334 females, 280 males), with a mean age of 67.9 ± 16.6 years; (range: 20–98 years).
Table 1 shows the baseline clinical and demographic characteristics of all patients. Inclusion criteria for the present substudy were as follows:
Table 1.
Clinical characteristics of studied group
| Parameters | n = 480 (%) |
|---|---|
| Age | 67 ± 17 |
| Sex (female/male) | 270/211 |
| Heart rate | 93 ± 22 |
| Blood pressure (systolic/diastolic) | 129 ± 27/77 ± 15 |
| Arterial oxygen saturation (%) | 93 ± 5 |
| sPESI ≥ 1 | 316 (66%) |
| Chest pain | 146 (30%) |
| Pleuric | 76 (15%) |
| Stenocardial | 70 (14%) |
| Dyspnea | 294 (61%) |
| Hemoptysis | 25 (5%) |
| Fever | 50 (10.4%) |
| Syncope | 133 (27%) |
| Deep vein thrombosis | 143 (30%) |
| Hypertension | 286 (59%) |
| Diabetes | 99 (20%) |
| Chronic renal disease (class) | 2.2 ± 0.8 |
| Cancer | 72 (15%) |
| Cardiogenic shock | 40 (8.3%) |
| Mortality | 22 (4.6%) |
acute PE objectively confirmed by visualization of thrombi on computed tomography, by high‐probability perfusion lung scan or direct visualization of thrombi on echocardiography according to the current ESC Guidelines (Torbicki et al., 2008).
availability of cardiac biomarkers (troponin and/or NT‐pro‐BNP),
echocardiogram performed within 24 hr from hospital admission.
Of 614 patients from the ZATPOL‐2 Registry database, the inclusion criteria were met in 480 patients (Figure 1).
Figure 1.
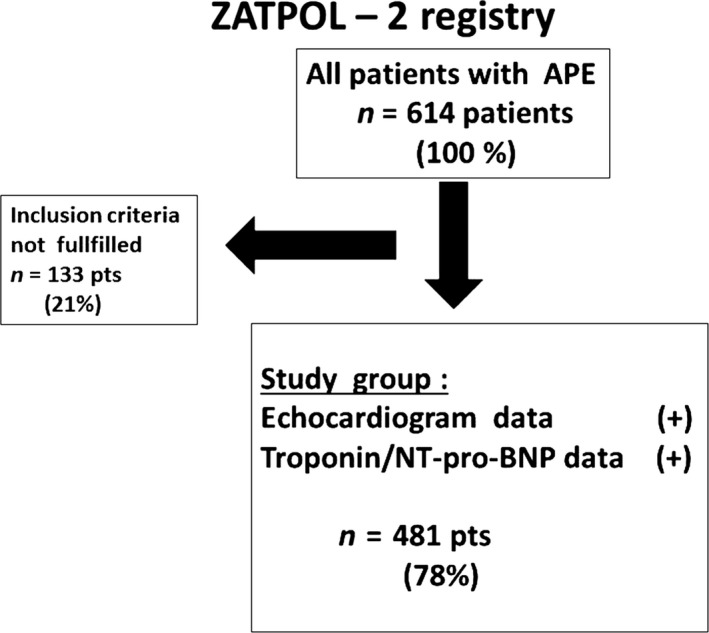
Patients flowchart
2.1. Electrocardiographic analysis
Standard 12‐lead ECG was recorded on admission with a paper speed of 25 mm/s. The first available ECG was used for analysis. The following ECG parameters were analyzed: heart rate; presence of sinus rhythm, atrial fibrillation (AF) (the presence of AF was taken into consideration if occurred within index hospitalization); QRS axis deviation (right or left axis deviation); P‐pulmonale; amplitude of P wave >0.25 mV in at least one limb lead (II, III, and aVF); right bundle branch block (RBBB); incomplete RBBB, McGinn‐White's sign (S1Q3T3 sign); negative T waves in leads III and aVF; negative T waves in leads V1–V3; negative T waves in leads V4–V6, ST segment depression in lead I, ST segment depression in leads V4–V6; ST segment elevation in lead III, ST segment elevation in lead aVR, ST segment elevation in lead V1, clockwise rotation (dextrogyria); ratio of amplitude of R wave to S wave ≤1 in lead V5; low QRS voltage (<5 mm) in the limb leads. We described the electrocardiogram as abnormal if any of the above listed ECG abnormalities were present.
The following clinical parameters were analyzed as: systolic and diastolic blood pressure, heart rate, systemic arterial blood oxygen saturation (sat %), and creatinine clearance (eGFR). The presence of clinical shock was diagnosed according to clinical criteria.
The following clinical events were recorded as: CS/hypotension on admission or during hospitalization and death from all causes. Cardiogenic shock was defined as a blood pressure <90/60 mm Hg requiring treatment with inotropic drugs or a drop in blood pressure of more than 40 mm Hg lasting at least 15 min and requiring treatment with inotropic drugs. Treatment with catecholamines was analyzed.
2.2. Echocardiographic parameters
The following echocardiographic parameters were taken into consideration and analyzed:
-
1
Right ventricular overload (RVO) was defined if at least one of the following parameters was present:
RVEDD/LVEDD (right ventricular end‐diastolic to left ventricular end‐diastolic dimensions, LAX projection) ratio > 0.9
Hypokinesis or akinesis of the right ventricular free wall
-
2
TRPG—tricuspid regurgitation peak gradient measured with the simplified Bernoulli equation using Doppler‐measured maximal velocity of tricuspid insufficiency (mm Hg)
2.3. Biomarkers levels
Cardiac troponins concentration was estimated using a troponin T test (28%) and troponin I test (72%) depending on local availability. Values exceeding the upper normal limit according to manufacturer's recommendation were considered abnormal (>0.014 ng/ml for troponin T, >0.01 μg/L for troponin I). A value above >300 pg/ml for serum NT‐pro‐BNP, and >100 pg/ml for serum BNP concentration was considered abnormal.
2.4. Statistical methods
Categorical variables were presented as counts and percentages, and continuous variables as means and standard deviations. The chi‐square test or Fisher’s exact test was used to test for association between two categorical variables. Association between a binary variable and multiple predictors was examined by the use of a bias‐reduced logistic regression model (BRLR) and described by odds ratios (OR) with 95% confidence intervals (CI). Due to a noticeable fraction of data missing in some variables, the BRLR models were estimated using 100 datasets with missing data imputed by the method of multiple imputation by chained equations (imputation model was random forests) (van Buuren & Groothuis‐Oudshoorn, 2011). A p‐value <.05 was considered statistically significant. All statistical analyses were performed using R 3.2.
3. Results
Cardiac biomarkers (troponin concentration—cTn and/or NT‐pro‐BNP) were assessed in all 481 patients and were elevated in 358 (74.4%) patients. Cardiac troponin concentration was assessed on admission in 468 (97.3%) patients and elevated in 332 (70.9%) patients. In turn, NT‐pro‐BNP was assessed in 261 (54.2%) patients and elevated in 180 (69%) patients. On echocardiography, RVO was present in 150 (31.1%) patients.
In our study, the most common ECG abnormalities were as follows: left axis deviation (34.2%), negative T waves in leads V2–V4 (33.8%), negative T waves in inferior leads (22.7%), S1Q3T3 sign (22.1.%), and AF (16.2%). Normal electrocardiogram (defined as the absence of any of the ECG abnormalities listed above) was found in 91 (19%) patients. However; if sinus tachycardia ≥100 bpm was considered an abnormal finding (22 patients), a truly normal ECG was present in 69 (14.5%) patients.
3.1. Electrocardiographic parameters and RVO
In patients with the presence of RVO on echocardiography, the following findings were significantly more frequent than in patients without RVO: S1Q3T3 sign (p < .001), negative T waves in leads V1–V3 (p < .001). Normal ECG was more frequent in patients without RVO than in patients with the presence of RVO (23.9% vs 8.0%, p < .001). Details are described in Table 2.
Table 2.
Electrocardiographic parameters and echocardiographic parameters according to presence of right ventricular overload
| Total | ECHO RVO (−) | ECHO RVO (+) | p | |
|---|---|---|---|---|
| Sinus rhythm | 408 (85.2%) | 291 (88.2%) | 117 (78.5%) | .009 |
| AFa | 78 (16.2%) | 46 (13.9%) | 32 (21.3%) | .057 |
| Right axis deviation | 51 (10.6%) | 31 (9.4%) | 20 (13.4%) | .245 |
| Left axis deviation | 164 (34.2%) | 115 (34.8%) | 49 (32.7%) | .716 |
| S1Q3T3 sign | 106 (22.1%) | 50 (15.2%) | 56 (37.3%) | <.001 |
| Incomplete RBBB | 45 (9.4%) | 26 (7.9%) | 19 (12.7%) | .134 |
| Complete RBBB | 49 (10.3%) | 29 (8.8%) | 20 (13.4%) | .169 |
| ST depression V4–V6 | 63 (13.2%) | 39 (11.9%) | 24 (16.0%) | .277 |
| ST depression lead I | 35 (7.3%) | 19 (5.8%) | 16 (10.7%) | .084 |
| Negative T wave V1–V3 | 162 (33.8%) | 94 (28.5%) | 68 (45.3%) | <.001 |
| Negative T wave V4–V6 | 104 (21.7%) | 65 (19.8%) | 39 (26.0%) | .156 |
| Negative T wave II, III, aVF | 109 (22.7%) | 70 (21.2%) | 39 (26.0%) | .297 |
| ST elevation lead aVR | 43 (9.0%) | 25 (7.6%) | 18 (12.0%) | .164 |
| ST elevation lead III | 28 (5.8%) | 19 (5.8%) | 9 (6.0%) | 1.000 |
| ST elevation lead V1 | 24 (5.0%) | 15 (4.6%) | 9 (6.0%) | .645 |
| Clockwise axis rotation | 58 (12.2%) | 40 (12.3%) | 18 (12.2%) | 1.000 |
| Normal ECG | 91 (19.0%) | 79 (23.9%) | 12 (8.0%) | <.001 |
RBBB, right bundle branch block; AF, atrial fibrillation.
Its presence was taken into consideration if occurred within index hospitalization.
3.2. Electrocardiographic parameters and cardiac biomarkers
In patients with elevated cardiac biomarkers (cTnT and/or NT‐pro‐BNP), the most frequent ECG abnormalities were negative T waves in leads V1–V3 (40.8%), left axis deviation (35.2%) and S1Q3T3 (27.4%). In patients with elevated cardiac biomarkers, the following abnormalities were significantly more frequent than in patients with normal concentration of cardiac biomarkers: presence of AF (p = .008), right axis deviation (p = .004), S1Q3T3 sign (p < .001), RBBB (p = .006), ST segment depression in leads V4–V6 (p < .001), ST segment depression in lead I (p = .01), negative T waves in leads V1–V3 (p < .001), negative T waves in leads V4–V6 (p = .005), negative T waves in leads II, III, and aVF (p = .005), ST segment elevation in lead aVR (p = .002), ST segment elevation in lead III (p = .038), and dextrogyria—clockwise rotation (p = .043). Details are presented in Table 3.
Table 3.
Electrocardiographic parameters according to serum cardiac troponin levels
| Total | cTnT (−) | cTnT (+) | p | |
|---|---|---|---|---|
| Sinus rhythm | 396 (85.0%) | 124 (91.9%) | 272 (82.2%) | .012 |
| AFa | 77 (16.5%) | 11 (8.1%) | 66 (19.9%) | .003 |
| Right axis deviation | 48 (10.3%) | 7 (5.2%) | 41 (12.4%) | .031 |
| Left axis deviation | 161 (34.5%) | 43 (31.9%) | 118 (35.5%) | .514 |
| S1Q3T3 sign | 105 (22.5%) | 13 (9.6%) | 92 (27.7%) | <.001 |
| Incomplete RBBB | 44 (9.4%) | 10 (7.4%) | 34 (10.2%) | .438 |
| Complete RBBB | 47 (10.1%) | 5 (3.7%) | 42 (12.7%) | .006 |
| ST depression V4–V6 | 62 (13.3%) | 8 (6.0%) | 54 (16.3%) | .005 |
| ST depression lead I | 34 (7.3%) | 4 (3.0%) | 30 (9.0%) | .036 |
| Negative T wave V1–V3 | 159 (34.0%) | 23 (17.0%) | 136 (41.0%) | <.001 |
| Negative T wave V4–V6 | 100 (21.5%) | 18 (13.3%) | 82 (24.8%) | .009 |
| Negative T wave II, III, aVF | 108 (23.1%) | 21 (15.6%) | 87 (26.2%) | .019 |
| ST elevation lead aVR | 43 (9.2%) | 4 (3.0%) | 39 (11.7%) | .005 |
| ST elevation lead III | 28 (6.0%) | 3 (2.2%) | 25 (7.6%) | .048 |
| ST elevation lead V1 | 23 (4.9%) | 3 (2.2%) | 20 (6.0%) | .140 |
| Clockwise axis rotation | 57 (12.4%) | 10 (7.5%) | 47 (14.4%) | .059 |
| Normal ECG | 88 (18.8%) | 53 (39.3%) | 35 (10.5%) | <.001 |
RBBB, right bundle branch block; AF, atrial fibrillation.
Its presence was taken into consideration if occurred within index hospitalization.
3.3. Electrocardiographic parameters, cardiac biomarkers and RVO
All patients were divided into four subgroups depending on: (i) presence of RVO and presence of elevated cardiac biomarkers, (ii) presence of RVO and absence of elevated cardiac biomarkers, (iii) absence of RVO and presence of elevated cardiac biomarkers, and (iv) absence of RVO and absence of elevated cardiac biomarkers. In patients with the presence of RVO and with elevated cardiac biomarkers, the following electrocardiographic abnormalities were significantly more frequent than in patients with the presence of RVO and with normal concentration of cardiac biomarkers: S1Q3T3 (41.4% vs 5.9%, p = .010), negative T waves in leads V1–V3 (50.4% vs 5.9%, p = .001). In turn, in patients without RVO and with elevated cardiac biomarkers, when compared with patients without RVO and with normal concentration of cardiac biomarkers, the following electrocardiographic abnormalities were significantly more frequently observed: AF (17.8% vs 5.7%, p = .005), right axis deviation (12.4% vs 2.9%, p = .010), S1Q3T3 sign (19.1% vs 6.7%, p = .006), RBBB (11.2% vs 3.8%, p = .047), ST segment depression in leads V4–V6 (15.6% vs 3.8%, p = .004), negative T waves in leads V1–V3 (35.1% vs 14.3%, p < .001), negative T waves in leads V4–V6 (23.7% vs 11.4%, p = .014), negative T waves in leads II, III, and aVF (24.4% vs 14.3%, p = .05), ST segment elevation in lead aVR (10.2% vs 1.9%, p = .016). Details are depicted in Table 4.
Table 4.
Correlation between electrocardiographic parameters and the presence/absence of right ventricular overload and presence/absence of cardiac biomarkers elevation
| All | ECHO RVO (+) biomarkers (+) | ECHO RVO (+) biomarkers (−) | ECHO RVO (−) biomarkers (+) | ECHO RVO (−) biomarkers (−) | p | p1 versus 2 | p1 versus 3 | p1 versus 4 | p2 versus 3 | p2 versus 4 | p3 versus 4 | |
|---|---|---|---|---|---|---|---|---|---|---|---|---|
| Sinus rhythm | 408 (85.2%) | 104 (78.8%) | 13 (76.5%) | 192 (85.3%) | 99 (94.3%) | .003 | .762 | .150 | .001 | .304 | .033 | .031 |
| AFa | 78 (16.2%) | 28 (21.1%) | 4 (23.5%) | 40 (17.8%) | 6 (5.7%) | .003 | .760 | .533 | .002 | .521 | .033 | .005 |
| Right axis deviation | 51 (10.6%) | 19 (14.4%) | 1 (5.9%) | 28 (12.4%) | 3 (2.9%) | .009 | .471 | .716 | .005 | .702 | .456 | .010 |
| Left axis deviation | 164 (34.2%) | 43 (32.3%) | 6 (35.3%) | 83 (36.9%) | 32 (30.5%) | .663 | 1.000 | .448 | .869 | 1.000 | .908 | .310 |
| S1Q3T3 sign | 106 (22.1%) | 55 (41.4%) | 1 (5.9%) | 43 (19.1%) | 7 (6.7%) | <.001 | .010 | <.001 | <.001 | .324 | 1.000 | .006 |
| Incomplete RBBB | 45 (9.4%) | 15 (11.3%) | 4 (23.5%) | 21 (9.3%) | 5 (4.8%) | .063 | .235 | .682 | .118 | .083 | .021 | .224 |
| Complete RBBB | 49 (10.3%) | 20 (15.2%) | 0 (0.0%) | 25 (11.2%) | 4 (3.8%) | .013 | .129 | .353 | .008 | .230 | 1.000 | .047 |
| ST depression V4–V6 | 63 (13.2%) | 24 (18.0%) | 0 (0.0%) | 35 (15.6%) | 4 (3.8%) | .001 | .076 | .654 | .002 | .144 | 1.000 | .004 |
| ST depression lead I | 35 (7.3%) | 16 (12.0%) | 0 (0.0%) | 17 (7.6%) | 2 (1.9%) | .015 | .218 | .221 | .007 | .617 | 1.000 | .072 |
| Negative T wave V1–V3 | 162 (33.8%) | 67 (50.4%) | 1 (5.9%) | 79 (35.1%) | 15 (14.3%) | <.001 | .001 | .006 | <.001 | .028 | .466 | <.001 |
| Negative T wave V4–V6 | 104 (21.7%) | 36 (27.1%) | 3 (17.6%) | 53 (23.7%) | 12 (11.4%) | .017 | .561 | .553 | .005 | .769 | .438 | .014 |
| Negative T wave II, III, aVF | 109 (22.7%) | 38 (28.6%) | 1 (5.9%) | 55 (24.4%) | 15 (14.3%) | .016 | .074 | .462 | .013 | .131 | .466 | .050 |
| ST elevation lead aVR | 43 (9.0%) | 18 (13.5%) | 0 (0.0%) | 23 (10.2%) | 2 (1.9%) | .004 | .225 | .436 | .003 | .383 | 1.000 | .016 |
| ST elevation lead III | 28 (5.8%) | 9 (6.8%) | 0 (0.0%) | 17 (7.6%) | 2 (1.9%) | .148 | .599 | .962 | .118 | .617 | 1.000 | .072 |
| ST elevation lead V1 | 24 (5.0%) | 9 (6.8%) | 0 (0.0%) | 13 (5.8%) | 2 (1.9%) | .276 | .599 | .876 | .118 | .607 | 1.000 | .158 |
| Clockwise axis rotation | 58 (12.2%) | 18 (13.7%) | 0 (0.0%) | 32 (14.4%) | 8 (7.7%) | .138 | .227 | .986 | .208 | .139 | .599 | .123 |
| Normal ECG | 91 (19.0%) | 8 (6.0%) | 4 (23.5%) | 31 (13.8%) | 48 (45.7%) | <.001 | .032 | .036 | <.001 | .282 | .147 | <.001 |
RVO, right ventricular overload; RBBB, right bundle branch block; AF, atrial fibrillation.
Its presence was taken into consideration if occurred within index hospitalization.
3.4. Electrocardiogram and tricuspid regurgitation peak gradient (TRPG)
In 328 (68.2%) out of 481 patients, the tricuspid regurgitation peak gradient (TRPG) was calculated. The patients were divided into three subgroups depending on the range of TRPG (mm Hg): (i) TRPG < 31 mm Hg, (ii) TRPG 31–46 mm Hg, and (iii) TRPG > 46 mm Hg. The following ECG abnormalities occurred, showing statistically significant difference between all three above‐mentioned subgroups: right axis deviation (p < .001), S1Q3T3 sign (p = .012), ST segment depression in lead I (p = .003), negative T waves in leads V1–V3 (p < .001), negative T waves in leads V4–V6 (p = .012), negative T waves in leads II, III, and aVF (p < .001), ST segment elevation in lead III (p = .026). In the subgroup of patients with a TRPG of 31–46 mm Hg, when compared with patients with TRPG < 31 mm Hg, negative T waves in leads V1–V3 (38.2% vs 16.3%, p < .001) and negative T waves in inferior leads (II, III, and aVF) (21.4% vs 10.6%, p = .042) were observed significantly more frequently. In turn, in patients with TRPG >46 mm Hg, the following ECG abnormalities were observed significantly more frequently than in patients with TRPG < 31 mm Hg: right axis deviation (p = .001), S1Q3T3 sign (p = .005), RBBB (p = .045), ST segment depression in lead I (p = .002), negative T waves in leads V1–V3 (p < .001), negative T waves in leads V4–V6 (p = .005), negative T waves in leads II, III, and aVF (p < .001), ST segment elevation in lead III (p = .037). In turn, in patients with TRPG >46 mm Hg, when compared with patients with a TRPG of 31–46 mm Hg, the following ECG abnormalities were significantly more frequently observed: right axis deviation (p < .001), incomplete RBBB (p = .047), and negative T waves in leads II, III, and aVF (p = .029). Details are described in Table 5.
Table 5.
Electrocardiographic parameters according to level of pulmonary hypertension estimated on echocardiography
| 1 | 2 | 3 | p | p1 versus 2 | p1 versus 3 | p2 versus 3 | |
|---|---|---|---|---|---|---|---|
| TIPG < 31 mm Hg | TIPG 31–46 mm Hg | TIPG > 46 mm Hg | |||||
| Sinus rhythm | 93 (90.3%) | 110 (84.0%) | 79 (84.9%) | .346 | .222 | .357 | .991 |
| AFa | 11 (10.6%) | 26 (19.8%) | 15 (16.1%) | .154 | .079 | .348 | .593 |
| Right axis deviation | 9 (8.7%) | 9 (6.9%) | 25 (26.9%) | <.001 | .792 | .001 | <.001 |
| Left axis deviation | 38 (36.5%) | 50 (38.2%) | 25 (26.9%) | .186 | .904 | .194 | .105 |
| S1Q3T3 sign | 16 (15.4%) | 35 (26.7%) | 31 (33.3%) | .012 | .053 | .005 | .357 |
| Incomplete RBBB | 10 (9.6%) | 9 (6.9%) | 15 (16.1%) | .078 | .599 | .247 | .047 |
| Complete RBBB | 5 (4.8%) | 14 (10.7%) | 13 (14.1%) | .082 | .161 | .045 | .570 |
| ST depression V4–V6 | 11 (10.7%) | 21 (16.0%) | 20 (21.7%) | .109 | .322 | .056 | .364 |
| ST depression lead I | 2 (1.9%) | 10 (7.6%) | 14 (15.1%) | .003 | .094 | .002 | .121 |
| Negative T wave V1–V3 | 17 (16.3%) | 50 (38.2%) | 48 (51.6%) | <.001 | <.001 | <.001 | .063 |
| Negative T wave V4–V6 | 15 (14.4%) | 30 (22.9%) | 30 (32.3%) | .012 | .141 | .005 | .160 |
| Negative T wave II, III, aVF | 11 (10.6%) | 28 (21.4%) | 33 (35.5%) | <.001 | .042 | <.001 | .029 |
| ST elevation lead aVR | 6 (5.8%) | 11 (8.4%) | 14 (15.1%) | .076 | .618 | .058 | .179 |
| ST elevation lead III | 4 (3.8%) | 7 (5.3%) | 12 (13.0%) | .026 | .759 | .037 | .074 |
| ST elevation lead V1 | 4 (3.8%) | 6 (4.6%) | 7 (7.5%) | .490 | 1.000 | .417 | .523 |
| Clockwise axis rotation | 13 (12.7%) | 11 (8.5%) | 10 (10.9%) | .579 | .409 | .856 | .724 |
| Normal ECG | 34 (32.7%) | 19 (14.5%) | 4 (4.3%) | <.001 | .002 | <.001 | .024 |
TIPG, tricuspid insufficiency pressure gradient; RBBB, right bundle branch block; AF, atrial fibrillation.
Its presence was taken into consideration if occurred within index hospitalization.
3.5. Clinical parameters and electrocardiographic abnormalities
In a regression analysis, the following clinical parameters were taken into consideration: age, heart rate, systolic and diastolic blood pressure, syncope, CS, treatment with catecholamines, creatinine clearance (eGFR), elevated troponin concentration, RVO. In a multivariate regression analysis, clinical predictors of AF were as follows: age (OR 1.43 per each 5 years, 95% CI 1.26–1.63, p = .000) and heart rate on admission (OR 1.07 increase per each 5 bpm: 95%CI 1.01–1.14, p = .023). Independent predictors of S1Q3T3 sign were as follows: heart rate on admission (OR 1.07 increase per each 5 bpm, 95% CI 1.01–1.13, p = .020), elevated troponin concentration (OR 3.26, 95% CI 1.65–6.44, p = .001), RVO (OR 2.58, 95% CI 1.57–4.21, p = .000). Independent predictors of negative T waves in leads V1–V3 were as follows: elevated troponin concentration (OR 3.31, 95%CI 1.91–5.73, p = .000), RVO (OR 1.63, 95% CI 1.05–2.55, p = .030). Independent predictors of negative T waves in inferior leads II, III, and aVF were as follows: elevated troponin concentration (OR 2.06, 95% CI 1.17–3.64, p = .013) only. Independent predictors of “abnormal electrocardiogram” were as follows: increased heart rate (OR 1.09 per each 5 bpm, 95% CI 1.02–1.17, p = .012), elevated troponin concentration (OR 3.33, 95%CI 1.94–5.72, p = .000), RVO (OR 2.30, 95% CI 1.17–4.53, p = .016). Details are depicted in Supporting Information.
4. Discussion
Acute PE has severe physiologic consequences including interference in gas exchange and circulation. Gas exchange abnormalities are caused by the release of inflammatory mediators that induce vasoconstriction, which leads to increase in pulmonary vascular resistance (PVR; Smulders, 2000). In turn, increase in PVR leads to RV dilation, which in an advanced stage can cause a change in the geometry of both RV and LV including the interventricular septum resulting in contractility desynchronization (Marcus et al., 2008). Desynchronization of the ventricles may be exacerbated by development of RBBB leading to impaired LV filling and systemic hypotension (Mauritz et al., 2011). RV ischemia can occur as a consequence of increased oxygen demand. All these pathophysiologic consequences contribute to ECG changes associated with PE and may be manifested by depolarization abnormalities (e.g., RBBB) and repolarization abnormalities (e.g., ST segment elevation, ST segment depression, negative T waves) as well as atrial arrhythmias.
This study showed that 74% patients with APE have elevated cardiac biomarkers. Cardiac troponin and NT‐pro‐BNP were elevated in 70% and 50% patients, respectively. RVO on echocardiogram was detected in 31% patients. In electrocardiogram of patients with RVO, S1Q3T3 sign and negative T waves in leads V1–V3 were observed significantly frequently. Punkollu et al. showed similar results to our study. In their study of 81 patients with APE, patients with right ventricular dysfunction were more likely to have McGinn‐White sign known as S1Q3T3 sign and negative T waves in leads V1–V3 (Punkullu et al., 2005). Our study confirmed this observation on a much larger population of 481 patients. Vanni et al. showed that right ventricular strain pattern on ECG (RBBB, S1Q3T3 sign, negative T waves in leads V1–V3) was associated with poor short‐term prognosis (HR 2.58), independently of echocardiographic findings in patients with APE (Vanni et al., 2009).
Some electrocardiographic abnormalities (ST segment depression in leads V4–V6, ST segment depression in lead I, ST segment elevation in lead aVR, ST segment elevation in lead III) that are typical patterns for myocardial ischemia were significantly more frequent in patients with elevated cardiac biomarkers (cTnT and/or NT‐pro‐BNP) than in patients with normal concentration of cardiac biomarkers. This can be explained by the fact that APE can cause right ventricular ischemia, even right ventricular infarction. Right ventricular ischemia leads to myocardial damage with leakage of cardiac troponin associated with ischemic ECG pattern. One could expect “right ventricular‐ischemic” ECG changes mainly in leads III, V1 and aVR as those leads “look at right ventricular regions.” We observed that lateral ECG leads such as: I, V4–V6 also presented an “ischemic ECG pattern” in APE patients. Zhan et al. demonstrated that patients with ST segment depression in lateral leads associated with ST elevation in lead aVR were at high risk for complications and death during hospitalization (Zhan et al., 2014). Our previous study, conducted on another study population (Kukla et al., 2011), showed that ST segment depression in leads V4–V6 was more frequent in patients with elevated versus normal cardiac troponin level (40% vs 15%, p = .001; Kukla et al., 2011).
The most common ischemic ECG pattern observed in APE is negative T waves in the right precordial leads (V1–V3), in our study present in 34% patients. The exact mechanism of this ischemic pattern is unclear. The fall in right ventricular output and left ventricular preload resulting in hypotension and decreased global myocardial perfusion was proposed. However, Stein et al. (1969) did not show any perfusion defect suggestive of ischemia. Others have suggested that ECG abnormalities may be attributable to catecholamine—or histamine‐mediated ischemia at the cellular level (Yoshinga et al., 1999).
Ischemic ECG patterns in inferior leads (such as negative T waves in leads II, III, and aVF or ST segment elevation in lead III) or lateral leads (ST segment depression in leads V4–V6, negative T waves in leads V4–V6) can reflect left ventricular ischemia secondary to acute RVO. Decreased cardiac output resulting from diminished left ventricular preload, concomitant hypoxemia, and systemic hypotension affect both left and right coronary artery flow and limit oxygen supply even in normal coronary arteries. Pruszczyk et al. confirmed, in a patient with APE and negative T waves in inferior leads and right precordial leads, the presence of right ventricular myocardial infarction with accompanying perfusion defect in the inferior wall of the left ventricle detected on heart scintigraphy despite normal coronary artery flow. Interestingly, even though TIMI grade 3 flow was observed in the right coronary artery, reduced myocardial perfusion was detected, as assessed by TMPG. This observation strongly supports a hypothesis that injury to microcirculation plays an important role in the mechanism of ischemic ECG pattern and elevation of cardiac troponin (Pruszczyk, Szulc, Horszczaruk, Gurba, & Kobylecka, 2003).
Myocardial ischemia expressed as elevated cardiac troponin concentration was an independent predictor of negative T waves in inferior leads, negative T waves in leads V1–V3, and S1Q3T3 sign. RVO was an independent predictor of negative T waves in leads V1–V3 and S1Q3T3 sign.
Our study analyzed correlations between tricuspid regurgitation peak gradient and ECG abnormalities. Data concerning the correlation between pressure in the right heart in APE and ECG are scarce. Previous studies analyzed much smaller patient populations. Yoshinaga et al. examined the relationship between ECG abnormalities and mean pulmonary artery pressure (MPAP). Their study showed that patients who exhibited RBB on ECG were more likely to have a MPAP > 40 mm Hg. MPAP correlated significantly with the total number of ECG abnormalities (r = .82, p < .001). In particular, at least five ECG abnormalities were noted in patients with MPAP ≥45 mm Hg (Yoshinaga et al., 2003). Because of a small study population they did not show any significant differences between patients with high MPAP >40 mm Hg (nine patients) and low MPAP <40 mm Hg (12 patients) for any single ECG parameter (abnormalities). McIntyre, Sasahara, and Littman (1972) found that precordial negative T waves (V1–V3) were more likely if the PAP was >30 mm Hg; however, only two patients exhibited this ECG abnormality in their study. Since then, a study by Ferrari et al. (1997) found that 81% of patients with APE and negative T waves in leads V1–V4 had a PAP >30 mm Hg. Our study analyzed the presence of ECG abnormalities in dependence on the magnitude of TRPG. In the subgroup of patients with a TRPG of 31–46 mm Hg, negative T waves in leads V1–V3 and negative T waves in inferior leads (II, III, and aVF) were observed significantly more frequently than in patients with TRPG < 31 mm Hg. In turn, in patients with TRPG >46 mm Hg, the following ECG abnormalities were observed significantly more frequently than in patients with TRPG < 31 mm Hg: right axis deviation, S1Q3T3 sign, RBBB, ST segment depression in lead I, negative T waves in leads V1–V3, negative T waves in leads V4–V6, negative T waves in leads II, III, and aVF, ST segment elevation in lead III. In turn, in patients with TRPG > 46 mm Hg, right axis deviation, incomplete RBBB and negative T waves in inferior leads II, III, and aVF were observed significantly more frequently than in patients with a TRPG of 31–46 mm Hg. In patients with TRPG > 46 mm Hg, the most common ECG abnormalities were as follows: negative T waves in leads V1–V3 (52%), negative T waves in inferior leads (35%), and S1Q3T3 sign (33%).
In addition, we would like to draw attention to the presence of AF in patients with APE. Kukla et al. (2015) showed that AF was observed in 24% of patients with APE and was associated with a 2‐fold increased risk of death. In our study, AF was found in 16.2% of patients. AF was observed twice more frequently in patients with elevated cardiac biomarkers than in patients with normal concentration of cardiac biomarkers. AF was observed statistically significantly more frequently in patients with the presence of at least one of major risk factors: RVO or elevated cardiac biomarkers. The presence of one of them is associated with an increased risk in patients with APE. That is why the presence of AF in patients with the presence of at least one major risk factor could carry additional risk.
Mounting evidence suggests that ECG can play a role in prognostication of patients with APE. Recent data suggest that several ECG abnormalities that have the ability to provide the valuable prognostic information are not included in the historical 21‐point ECG score by Daniel, Courtney, & Kline (2001) These include T‐wave inversion in leads beyond precordial leads, ST segment elevation, ST segment depression, the QR sign, QRS fragmentation or AF (Digby et al., 2015). The results of our study are consistent with recent meta‐analysis by Qaddoura et al. that included 13,561 patients from 68 studies. Meta‐analysis confirmed that ECG is highly valuable in the prognostication of APE and should be integrated in a risk score model (Qaddoura et al., 2016).
5. Conclusions
Electrocardiographic signs of right ventricular strain are strongly related to elevated cardiac biomarkers level and echocardiographic signs of RV overload. As ECG is the most frequently performed diagnostic test it may be used in preliminary prognostic stratification and screening of patient with intermediate‐ or high‐risk forms of APE.
Supporting information
Kukla P, Kosior DA, Tomaszewski A, et al.Correlations between electrocardiogram and biomarkers in acute pulmonary embolism: Analysis of ZATPOL‐2 Registry. Ann Noninvasive Electrocardiol. 2017;22:e12439. 10.1111/anec.12439
Funding information
The ZATPOL‐2 Registry was supported by an unrestricted educational grant from Sanofi.
References
- van Buuren, S. , & Groothuis‐Oudshoorn, K. (2011). mice: Multivariate imputation by chained equations in R. Journal of Statistical Software, 45(3), 1–67. [Google Scholar]
- Daniel, K. , Courtney, D. , & Kline, J. A. (2001). Assessment of cardiac stress from massive pulmonary embolism from 12‐lead ECG. Chest, 120, 474–481. [DOI] [PubMed] [Google Scholar]
- Digby, G. C. , Kukla, P. , Zhong‐ Qun, Z. , Pastore, C. , Piotrowicz, P. , Schapachnik, E. , … Baranchuk, A. (2015). The value of electrocardiographic abnormalities in the prognosis of pulmonary embolism: A consensus review. Annals of Noninvasive Electrocardiology, 20, 207–223. [DOI] [PMC free article] [PubMed] [Google Scholar]
- Ferrari, E. , Imbert, A. , Chevalier, T. , Mihoubi, A. , Moran, P. , & Baudouy, M. (1997). The ECG in pulmonary embolism. Predictive value of negative T waves in precordial leads—80 case reports. Chest, 111, 537–543. [DOI] [PubMed] [Google Scholar]
- Konstantinides, S. V. , Torbicki, A. , Agnelli, G. , Danchin, N. , Fitzmaurice, D. , … Zompatori, M. (2014). 2014 ESC Guidelines on the diagnosis and management of acute pulmonary embolism: The Task Force for the Diagnosis and Management of Acute Pulmonary Embolism of the European Society of Cardiology (ESC) Endorsed by the European Respiratory Society (ERS). European Heart Journal, 35, 3033–3069.25173341 [Google Scholar]
- Kukla, P. , Dlugopolski, R. , Krupa, E. , Furtak, R. , Szełemej, R. , Mirek‐Bryniarska, E. , … Nowak, J. (2011). Electrocardiography and prognosis of patients with acute pulmonary embolism. Cardiology Journal, 18, 648–653. [DOI] [PubMed] [Google Scholar]
- Kukla, P. , McIntyre, W. F. , Koracevic, G. , Kutlesic‐Kurtovic, D. , Fijorek, K. , Atanaskovic, V. , … Baranchuk, A. (2015). Relation of atrial fibrillation and right‐sided cardiac thrombus to outcome in patients with acute pulmonary embolism. American Journal of Cardiology, 115, 825–830. [DOI] [PubMed] [Google Scholar]
- Marcus, J. T. , Gan, C. T. , Zwanenburg, J. J. , Boonstra, A. , Allaart, C. P. , Götte, M. J. , & Vonk‐Noordegraaf, A. (2008). Interventricular mechanical asynchrony in pulmonary arterial hypertension: Left‐to‐right delay in peak shortening is related to right ventricular overload and left ventricular underfilling. Journal of the American College of Cardiology, 51, 750–757. [DOI] [PubMed] [Google Scholar]
- Mauritz, G. J. , Marcus, J. T. , Westerhof, N. , Postmus, P. E. , & Vonk‐Noordegraaf, A. (2011). Prolonged right ventricular post‐systolic isovolumic period in pulmonary arterial hypertension is not a reflection of diastolic dysfunction. Heart, 97, 473–478. [DOI] [PubMed] [Google Scholar]
- McIntyre, K. M. , Sasahara, A. A. , & Littman, D. (1972). Relation of the electrocardiogram to hemodynamic alterations in pulmonary embolism. American Journal of Cardiology, 30, 205–210. [DOI] [PubMed] [Google Scholar]
- Pruszczyk, P. , Szulc, M. , Horszczaruk, G. , Gurba, H. , & Kobylecka, M. (2003). Right ventricular infarction in a patient with acute pulmonary embolism and normal coronary arteries. Archives of Internal Medicine, 162, 1110–1111. [DOI] [PubMed] [Google Scholar]
- Punkullu, G. , Gowda, M. , Vasavada, B. C. , Khan, I. A. (2005). Role of electrocardiography in identifying right ventricular dysfunction in acute pulmonary embolism. American Journal of Cardiology, 96, 450–452. [DOI] [PubMed] [Google Scholar]
- Qaddoura, A. , Digby, G. , Kabali, C. , Kukla, P. , Zhan, Z. Q. , & Baranchuk, A. (2016). The value of electrocardiography for the prognostication of acute pulmonary embolism: A systematic review and meta‐analysis. Journal of the American College of Cardiology, 67(Suppl. 13), 830–830. [Google Scholar]
- Smulders, Y. M. (2000). Pathophysiology and treatment of haemodynamic instability in acute pulmonary embolism: The pivotal role of pulmonary vasoconstriction. Cardiovascular Research, 48, 23–33. [DOI] [PubMed] [Google Scholar]
- Stein, P. D. , Alshabkhourn, S. , Hawkins, H. F. , Hyland, J. W. , & Jarrett, C. E. (1969). Right coronary blood flow in acute pulmonary embolism. American Heart Journal, 77, 356–362. [DOI] [PubMed] [Google Scholar]
- Torbicki, A. , Perrier, A. , Konstantinides, S. , Agnelli, G. , Galiè, N. , Pruszczyk, P. , … Bassand, J. P. (2008). Guidelines and management of acute pulmonary embolism of The European Society of Cardiology. European Heart Journal, 29, 2276–2315. [DOI] [PubMed] [Google Scholar]
- Vanni, S. , Polidori, G. , Vergara, R. , Pepe, G. , Nazerian, P. , Moroni, F. , … Grifoni, S. (2009). Prognostic value of ECG among patients with acute pulmonary embolism and normal blood pressure. American Journal of Medicine, 122, 257–264. [DOI] [PubMed] [Google Scholar]
- Wellens, H. J. J. , & Conover, M. B. (2006). The ECG in emergency decision making. 2nd ed. ECG recognition of acute pulmonary embolism (pp. 185–195). Pjiladelphia: Saunders. [Google Scholar]
- Yoshinaga, T. , Ikeda, S. , Shikuwa, M. , Miyahara, Y. , & Kohno, S. (2003). Relationship between ECG findings and pulmonary artery pressure in patients with acute massive pulmonary thromboembolism. Circulation Journal, 67, 229–232. [DOI] [PubMed] [Google Scholar]
- Yoshinga, T. , Ikeda, S. , Nishimura, E. , Shioguchi, K. , Shikuwa, M. , Miyahara, Y. , & Kohno, S. (1999). Serial changes in the negative T waves on electrocardiography in acute pulmonary embolism. International Journal of Cardiology, 72, 65–72. [DOI] [PubMed] [Google Scholar]
- Zhan, Z. Q. , Wang, C. Q. , Nikus, K. C. , He, C. R. , Wang, J. , Mao, S. , & Dong, X. J. (2014). Electrocardiogram patterns during hemodynamic instability in patients with acute pulmonary embolism. Annals of Noninvasive Electrocardiology, 19, 541–551. [DOI] [PMC free article] [PubMed] [Google Scholar]
Associated Data
This section collects any data citations, data availability statements, or supplementary materials included in this article.
Supplementary Materials