

Abstract
The electrocardiographic (ECG) manifestation of ventricular repolarization includes J (Osborn), T, and U waves. On the basis of biophysical principles of ECG recording, any wave on the body surface ECG represents a coincident voltage gradient generated by cellular electrical activity within the heart. The J wave is a deflection with a dome that appears on the ECG after the QRS complex. A transmural voltage gradient during initial ventricular repolarization, which results from the presence of a prominent action potential notch mediated by the transient outward potassium current (Ito) in epicardium but not endocardium, is responsible for the registration of the J wave on the ECG. Clinical entities that are associated with J waves (the J‐wave syndrome) include the early repolarization syndrome, the Brugada syndrome and idiopathic ventricular fibrillation related to a prominent J wave in the inferior leads. The T wave marks the final phase of ventricular repolarization and is a symbol of transmural dispersion of repolarization (TDR) in the ventricles. An excessively prolonged QT interval with enhanced TDR predisposes people to develop torsade de pointes. The malignant “R‐on‐T” phenomenon, i.e., an extrasystole that originates on the preceding T wave, is due to transmural propagation of phase 2 reentry or phase 2 early afterdepolarization. A pathological “U” wave as seen with hypokalemia is the consequence of electrical interaction among ventricular myocardial layers at action potential phase 3 of which repolarization slows. A physiological U wave is thought to be due to delayed repolarization of the Purkinje system.
Keywords: electrocardiography, J wave, T wave, U wave
INTRODUCTION
The electrocardiogram (ECG) recording is a noninvasive, inexpensive, and useful test widely used in clinical practice. It is used to diagnose heart disorders like cardiac arrhythmias, but it may also be used to detect cardiac effects of noncardiac factors such as electrolyte disturbances and drug toxicity. Although the ECG does not directly record electrical activity from the heart, every single ECG waveform reflects a potential change in the electrical field on the body surface generated solely by the heart that functions as a central electromotive source to produce the change. On the ECG, all waveforms can be categorized into two groups: depolarization and repolarization. Ventricular depolarization is depicted by the QRS complex, and ventricular repolarization is represented by the J (Osborn), T, and U waves. Progress in basic and clinical research of electrical heterogeneity across the ventricular wall in the past two decades has greatly advanced our understanding of the ionic and cellular basis for ventricular repolarization waves and their clinical implications. This article attempts to elucidate some of the elusive ECG syndromes and entities related to ventricular repolarization based on previously demonstrated and published theories.
J (OSBORN) WAVE
The J wave is a deflection with a dome or hump morphology that appears on the ECG after the QRS complex or as a small secondary R wave (R′). Also referred to as the Osborn wave because of Osborn's landmark description in the early 1950s, 1 the J wave has been commonly observed on the ECG of some species, such as baboons and dogs, under physiological conditions. In humans, the J wave is partially or completely buried in the QRS complex under normal conditions. A prominent J wave on the ECG is often associated with conditions of hypothermia and hypercalcemia. 2 , 3 However, a distinct J wave on the ECG can be seen in some normal individuals with the early repolarization syndrome although it is sometimes diagnosed mistakenly as intraventricular block. 4 , 5
Earlier studies attributed the J wave to a variety of factors including hypoxia, injury current, acidosis, delayed ventricular depolarization, and early ventricular repolarization. 6 The fact that the J wave immediately follows the completion of ventricular activation (QRS complex) indicates the presence of a transient transmural voltage gradient during early ventricular repolarization. In the late 1980s, Antzelevitch and his colleagues proposed a difference in repolarization phases 1 and 2 of the action potential between canine ventricular epicardium and endocardium as the basis for the ECG J wave. 7 , 8 Ventricular epicardium commonly displays action potentials with a prominent notch (spike and dome) largely mediated by a 4‐aminopyridine‐sensitive transient outward current (Ito). The absence of a prominent notch in the endocardium is the consequence of a much smaller Ito. A prominent Ito‐mediated action potential notch in ventricular epicardium but not endocardium may produce a transmural voltage gradient during early ventricular repolarization that could register as a J wave or J point elevation in the ECG. Direct evidence in support of this hypothesis was obtained recently in the arterially perfused canine ventricular wedge preparation. 9 As shown in Figure 1, when activation starts with endocardium and spreads transmurally to epicardium, a distinct J wave coincident with the epicardial action potential notch is seen on the ECG. Conversely, if activation starts from the epicardium and travels to the endocardium, the J wave disappears from the ECG because it is buried within the QRS complex. The data obtained from the wedge preparation have also demonstrated a linear correlation between the J wave size and Ito‐mediated action potential notch in epicardium. Therefore, factors that influence Ito kinetics and ventricular activation sequence can modify the J wave on the ECG. The prominent J wave induced by hypothermia is the result of a marked accentuation of the spike and dome morphology of epicardial action potentials probably due to the effect of cold temperatures to slow the activation kinetic of Ito less than that of the L‐type Ca2+ current. 9 With a normal ventricular activation sequence from endocardium to epicardium, an acceleration of heart rate reduces Ito due to its slow recovery from inactivation, resulting in a decrease in the J wave size. 10 This property of the J wave is particularly useful in distinguishing the J wave from the terminal part of a notched QRS complex. Since a notched QRS is the consequence of altered ventricular activation, an increase in heart rate may amplify its terminal size. Similarly, some sodium channel blockers that possess additional Ito inhibition, such as quinidine and disopyromide, reduce the J wave size. 11 , 12 However, they would not be expected to have an effect on the terminal part of a notched QRS.
Figure 1.
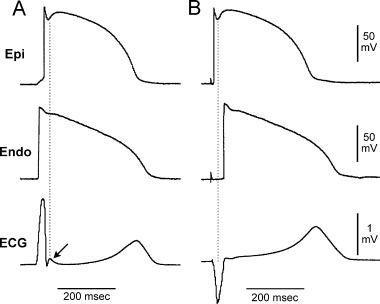
Effect of ventricular activation sequence on the J wave on the ECG. (A) When the wedge preparation is stimulated from the endocardial surface with epicardium activated last, a J wave on the ECG is temporally aligned with Ito‐mediated epicardial action potential notch. (B) When the preparation is paced from the epicardial surface with endocardium activated last, the epicardial action potential notch is coincident with the QRS, and a J wave is no longer observed (reprinted from Ref. 9 with permission).
Clinical Syndromes or Diseases that Are Associated with the J Wave (the J Wave Syndrome)
The Brugada Syndrome
The Brugada syndrome is a clinical entity described by the Brugada brothers. 13 It manifests clinically as recurrent syncope and sudden cardiac death from ventricular fibrillation (VF). 13 , 14 Although observed worldwide, it is more common in young to middle‐aged Asian males. The ECG of the Brugada patient is characterized by a normal QT interval, apparent incomplete right branch bundle block (RBBB), and ST segment elevation in the right precordial leads (V1–V3) or inferior leads (II, III, and aVF) in the absence of myocardial ischemia, electrolyte disturbance, or defined structural heart disease. 10 , 13 , 14 The apparent incomplete RBBB on the ECG in patients with the Brugada syndrome is actually an accentuated J wave. 11 , 15 This is supported by the clinical observations that the J wave and associated ST segment elevation in the Brugada patients is significantly influenced by heart rate and autonomic tone. 10 , 16
Progress in the research of ventricular repolarization heterogeneity in the past decade has greatly enhanced our understanding of the ionic and cellular basis for ST segment elevation and arrhythmogenesis in the Brugada syndrome. Parallel to the clinical observations by the Brugada brothers in the early 1990s, 13 Antzelevitch and his colleagues published several important findings regarding electrical heterogeneity across the canine ventricular wall. 8 , 9 They found that the Ito‐mediated action potential dome in the epicardium is responsible not only for the J wave on the ECG but also for the development of ST segment elevation and polymorphic ventricular tachycardia (VT) or ventricular fibrillation under certain pathophysiological conditions. An outward shift of currents due either to a decrease in inward currents (INa and ICa) or an increase in outward currents (IK–ATP) may lead to two different fates of the Ito‐mediated action potential dome in the epicardium depending on the size of Ito and Ito‐mediated phase 1 magnitude. 11 , 17 , 18 When Ito is prominent, as it is in right ventricular epicardium, 11 , 18 , 19 an outward shift of currents can accentuate the Ito‐mediated action potential notch in the epicardium to a more negative potential. The L‐type calcium current then fails to activate, and the action potential dome fails to develop, leading to an all‐or‐none repolarization at the end of phase 1. All‐or‐none repolarization, i.e., complete loss of the action potential dome, results in marked abbreviation of action potentials (Fig. 2). 11 , 19 , 20 In contrast, when Ito is weak as seen in the left ventricular epicardium, an outward shift of currents may only cause a depression (partial loss) of the dome and therefore a minimal change in action potential duration (APD). Loss of the Ito‐mediated action potential dome in epicardium but not endocardium generates a transmural voltage gradient that manifests as ST segment elevation on the ECG. The ST segment elevation due to complete loss of the epicardial action potential dome has a coved morphology as seen in the Brugada syndrome (Fig. 2). 11 , 21 , 22 The ST segment elevation due to partial loss of action potential dome in epicardium but not endocardium is usually concave upward or saddleback as seen in the early repolarization syndrome (please see the discussion below). A defect in the sodium channel due to a gene mutation in SCN5A that leads to a decrease in the inward current is linked with the Brugada syndrome. 23 , 24 It provides the rationale for the use of sodium channel blockers, which increase the outward shift of currents at phases 1 and 2 by inhibition of INa, to unmask the concealed form of the Brugada syndrome. 22 , 25
Figure 2.

Loss of Ito‐mediated epicardial action potential dome and ST segment elevation. Upper panel: Simultaneous recordings of a transmural ECG and transmembrane action potentials from one endocardial (Endo) and two epicardial (Epi 1 and Epi 2) sites. Loss of Ito‐mediated epicardial action potential dome induced by pinacidil leads to ST segment elevation. The 4‐aminopyridine (4‐AP), a specific Ito blocker, restores epicardial dome thus normalizing ST segment. Lower panel: Ventricular fibrillation is initiated by a closely coupled R‐on‐T ectopic beat via phase 2 reentry due to complete loss of epicardial dome at Epi 2 but not at Epi 1 (reprinted from Ref.11 with permission).
Complete loss of the epicardial action potential dome may not be uniform; that is, loss of the dome may occur at some sites but not others, probably due to intrinsic differences in Ito in the epicardium and/or regional differences in pathophysiological conditions. Interestingly, when the Ito‐mediated action potential dome is completely lost, the action potential abbreviates by 40–70%. However, when the dome is just about to disappear, the action potential prolongs paradoxically. This leads to a marked repolarization gradient on the epicardium (Fig. 2, lower panel). 11 Propagation of the action potential dome from sites at which it is maintained to sites at which it is lost causes local re‐excitation via phase 2 reentry, leading to the development of a closely coupled “R‐on‐T” extrasystole (Fig. 2). An increase in the transmural dispersion of repolarization (TDR), also present in this condition, may facilitate transmural propagation of the R‐on‐T extrasystole and provide further substrate for the development of polymorphic ventricular tachycardia and fibrillation. 11 It is worth emphasizing that although Ito may not necessarily be the specific ionic target of pathophysiological alterations, like the sodium channel mutation described above, a prominent Ito‐mediated action potential dome is a prerequisite for the development of phase 2 reentry. This is the reason why the Brugada syndrome and idiopathic ventricular fibrillation are predominantly seen in males whose Ito is significantly greater than that seen in females. 26
The Early Repolarization Syndrome
The early repolarization syndrome is characterized by a distinct J wave or J‐point elevation, concave upward ST segment elevation defined predominantly in the left precordial leads V4–V6, with a broad and upright T wave. The early repolarization syndrome is a benign ECG phenomenon that is more commonly seen in young healthy men and athletes. 18 Interest in this well‐known syndrome has recently been rekindled because of its electrocardiographic similarity to the highly arrhythmogenic Brugada syndrome. 17 , 27
The underlying mechanism for ST segment elevation in the early repolarization syndrome is principally similar to that for ST elevation in the Brugada syndrome. As shown in Figure 3, pinacidil, a potassium channel opener, leads to partial loss of the Ito‐mediated action potential dome in canine left ventricular epicardium. As mentioned above, the ST segment elevation due to partial loss of the action potential dome in epicardium but not endocardium is usually concave upward or saddleback on the ECG. This resembles the early repolarization syndrome observed in humans (Fig. 3B). Experimental data obtained from our laboratory have demonstrated that complete loss of the Ito‐mediated action potential dome in canine left ventricular epicardium rarely occurs due to a much smaller Ito compared to canine right ventricular epicardium. Perhaps, this explains why the early repolarization syndrome is a benign entity.
Figure 3.

Cellular basis for the early repolarization syndrome. (A) Surface ECG (lead V5) recorded from a 17‐year‐old healthy African‐American man. Note the presence of a small J wave and marked ST segment elevation. (B) Simultaneous recording of transmembrane action potentials from epicardial (Epi) and endocardial (Endo) regions and a transmural ECG in an isolated arterially perfused canine left ventricular wedge. A J wave in the transmural ECG is present due to the action potential notch in the epicardium but not the endocardium. Perfusion of the preparation with pinacidil (2 μmol/l), an ATP‐sensitive potassium channel opener, causes partial loss of the action potential dome in the epicardium, resulting in ST segment elevation in the ECG resembling the early repolarization syndrome.
As in the Brugada syndrome, heart rate and autonomic tone modify not only the J wave but also the ST segment elevation in the early repolarization syndrome. 28 However, the ionic basis for the outward shift of currents during action potential phases 1 and 2 that are responsible for partial loss of the left ventricular epicardial action potential dome in the early repolarization syndrome is unknown.
Sudden Cardiac Death Associated with a Prominent J Wave in the Inferior Leads
In the ECG precordial leads V1–V3, the J wave and ST segment elevation are the signs that indicate a high risk of sudden cardiac death, i.e., the Brugada syndrome. In contrast, the J wave and ST segment elevation in V4–V6 are benign, i.e., the early repolarization syndrome. In other words, pathophysiological alterations of J wave that involve the right ventricle are arrhythmogenic; those that involve the left ventricular anterolateral regions are benign. What would be the consequences of a prominent J wave and ST segment elevation in the inferior leads, i.e., the pathophysiological alterations of the J wave that involve the inferior region of left ventricle? We previously reported a case of recurrent VF in a young Asian male who did not exhibit structural heart disease, but who had a prominent J wave and ST segment elevation in the inferior leads (Fig. 4). 10 A number of similar cases have been reported since then. 29 , 30 , 31 In 1990 and 1993, Aizawa et al. reported several cases of VF in Japanese men that were associated with a “notch” in the late part of the QRS complex in the inferior leads. 32 , 33 At that time, the authors interpreted this as an intraventricular conduction delay. 33 We now know that the “notch” was probably a J wave because its properties were consistent with those of the J wave: its size decreased with fast heart rate but increased after a long pause.
Figure 4.

Upper Panel: Twelve‐lead ECG recorded from a 29‐year‐old Asian man who survived cardiac arrest. Prominent J waves and ST segment elevation in inferior leads II, III, and aVF were observed. Lower Panel: The onset of VF in the same patient during his hospital stay (reprinted from Ref.10 with permission).
The above cases may be considered variants of the Brugada syndrome since mutations in the cardiac sodium channel gene SCN5A caused the J wave and ST segment elevation in the right precordial leads as well as in the inferior leads. 31 , 34 On the other hand, in the cases of VF in patients with a prominent J wave and ST segment elevation in the inferior leads, early repolarization in the left precordial leads is often present (Fig. 4). 10 , 32 , 33 Therefore, all three clinical entities are identical in terms of their ionic and cellular basis and may be referred to an Ito‐mediated J‐wave syndrome. The only difference among these clinical entities is the difference in Ito density and associated J wave size. The fact that patients with hypothermia and a resultant prominent J wave predispose to the development of VF 6 indicates that Ito density or kinetics and Ito‐mediated J wave size play a key role in arrhythmogenesis.
T WAVE
According to biophysical principles of the ECG recording, all waves on the body surface ECG are the manifestation of a voltage gradient within the heart. A positive T wave, one whose polarity is the same as the QRS complex, represents such a voltage gradient during ventricular repolarization. Attempts to unlock the cellular basis of the T wave began more than one century ago when the ECG recording technique was in its infancy, 35 , 36 and its genesis had been a matter of debate through the entire 20th century. 35 , 36 , 37 , 38 , 39 , 40 , 41 A concordant polarity of the QRS complex and T wave indicates that ventricular depolarization and repolarization waves travel in opposite directions. Therefore, some regions of ventricle that are depolarized first have to repolarize last in order to generate a concordant QRS and T on the ECG.
In 1976, Cohen et al. demonstrated a difference in action potential duration between the apex and the base of sheep left ventricle, 38 proposing that an apico‐basal voltage gradient was responsible for the positive T wave. 38 , 39 However, the difference in APD between “apex” and “base” observed in this study was actually the difference in repolarization between epicardium and endocardium; they recorded action potentials from the epicardium of the apex and the endocardium of the base. 38 A more recent study has demonstrated that there is no significant apico‐basal voltage gradient on the same myocardial layer of canine left ventricle. 41
Another possibility for the concordance of polarity of the QRS complex and the T wave is that normal ventricular electrical repolarization may be opposite to ventricular depolarization, a process that can generate a transmural voltage gradient. 40 , 42 In an elegant study in the early 1980s, Higuchi and Nakaya demonstrated the effect of repolarization sequences across ventricular wall on T wave polarity. 42 In their study, cooling of the canine epicardial surface was associated with longer APD in the epicardium and resulted in a negative T wave. In contrast, warming of the epicardium was associated with APD shortening in the epicardium and led to a positive T wave. They concluded that an APD that is at least 40–60 ms longer in the endocardium than in the epicardium is required to generate a positive T wave. 42 The contribution of a transmural voltage gradient across the ventricular wall due to the difference in repolarization time between epicardial and endocardial layers is illustrated in Figure 5.
Figure 5.

Effect of ventricular activation on the T wave on the ECG. (A) ECG tracing V4 was recorded from a patient in our EP lab who underwent radiofrequency (RF) ablation for his accessory pathway. In the first three beats, pre‐excitation of the ventricle was associated with a prolonged QRS complex and a small positive T wave. Immediately after the interruption of accessory conduction by RF ablation, the normalization of the QRS was associated with an increase in T wave amplitude and Tp–e interval. (B) Pacing site dependent changes in the QT and Tp–e intervals on the ECG. Pacing from right ventricular endocardium (RVEndoP, conventional pacing) yielded a QT interval of 485 ms. Immediately after switching to left ventricular epicardial pacing (LVEpiP), the QT interval prolonged to 580 ms, and the Tp–e interval also increased. (C) Cellular basis for pacing site dependent changes in the QT and TDR. The QT interval and TDR increased respectively from 284 and 43 ms to 303 ms and 67 ms when switching from the endocardial to epicardial despite no changes in APD. Panels B and C are reprinted with modifications from Ref.77 with permission.
The ionic and cellular basis for the genesis of a transmural gradient was not established until early 1990s when a new subpopulation of cells in canine left ventricular myocardium, i.e., M cell, was discovered by Dr. Antzelevitch and his colleagues. 43 M cells that reside in the deep subendocardium have been well described in canine and human left ventricles. 43 , 44 , 45 , 46 Epicardial, endocardial, and M cells differ from each other primarily by their repolarization properties. The hallmark of M cells is a tendency to have their action potentials prolong disproportionately to epicardium or endocardium in response to slowing of pacing rate or to drugs that prolong the action potential, playing an important role in abnormal ventricular repolarization such as long QT syndrome. The electrical interplay among these three myocardial layers during ventricular repolarization underlies the genesis of various T wave morphologies as demonstrated in the isolated arterially perfused ventricular wedge preparation under both physiologic and pathologic conditions. 41 , 47 , 48 , 49 With a positive T wave on the ECG, the peak of the T wave (Tpeak) is always coincident with the repolarization of epicardium, 18 , 41 , 48 , 49 , 50 whereas the end of T wave (Tend) is dictated either by the repolarization of M cells (e.g., in canine 41 , 50 ), or by the repolarization of the subendocardium and endocardium (e.g., in rabbit 18 , 48 , 49 ). Regardless, the interval from the Tpeak to the Tend (Tp–e) represents the maximal TDR of the ventricle. In fact, the Tp–e interval exhibits a rate dependence in humans 51 and has served as a useful index in the assessment of arrhythmic risk in patients with the long QT syndrome. 52 , 53 , 54 , 55 It is worthy to emphasize that caution should be taken when extrapolating the data obtained from the isolated ventricular wedge preparation to understanding of the T wave in humans because both nondipolar (local) and dipolar (global) repolarization components may contribute to the genesis of the T wave on the body surface ECG. 56 The relative contribution of each of these two repolarization forces to the T wave may vary among different clinical conditions.
Ionic features of M cells that distinguish them from epicardium and endocardium include the presence of a smaller slowly activating delayed rectifier potassium current (IKs) but a larger late sodium current (late INa). 46 However, the rapidly activating delayed rectifier potassium current (IKr), the ionic target by most APD prolonging agents, is similar in all three types of cells. Therefore, the difference in the IKs:IKr density ratio among the three transmural cell types contributes importantly to heterogeneous repolarization across the canine left ventricular wall. 46 The mutations of genes that encode IKs and IKr have been implicated in most types of congenital long QT syndromes. 57 It is worth emphasizing that a distinct layer of M cells in the left ventricle may not be seen in smaller species. For example, data obtained from our laboratory have demonstrated that repolarization time increases gradually from left ventricular epicardium to endocardium in this model. 48 , 49 IKs and IKr density were similar between subendocardium and endocardium in the rabbit, 58 indicating that the endocardium may function like M cells in smaller animals that have thinner left ventricular walls.
Clinical Syndromes and Phenomena that are Associated with the T Wave
Long QT Syndrome (LQTS)
The congenital and acquired LQTS is a cardiac disease characterized by the appearance of a long QT interval on the ECG, notched T waves, U waves, and an atypical polymorphic VT known as Torsade de Pointes (TdP) that can lead to sudden cardiac death. 59 , 60 , 61 Since LQTS has been reviewed extensively in the literatures, 57 , 59 , 60 it will only be discussed briefly here.
Genetic analysis has identified mutations of at least six ionic genes located on chromosomes 3, 4, 7, 11, 17, and 21 that are responsible for defects in INa (SCN5A, LQT3), IKr (HERG and MiRP1, LQT2 and LQT6), IKs (KVLQT1 and MinK, LQT1 and LQT5), and IK1 (Kir2.1, LQT7). 57 Acquired LQTS is caused by drugs that either inhibit outward currents of IKr and/or IKs or enhance the inward current such as INa. However, agents that target IKr are responsible for most clinical cases of TdP. Preferential prolongation of the cells in the subendocardium and endocardium is thought to cause QT prolongation, the phenotypic appearance of abnormal T waves, pathologic U waves, and the development of TdP. 18 , 41 , 48 , 62 It is now generally accepted that phase 2 early afterdepolarization (EAD) as the initiating mechanism, and functional reentry due to an enhanced TDR as the maintenance mechanism, are responsible for the development of TdP. 41 , 47 , 48 , 62 , 63
Women exhibit an enhanced susceptibility to develop TdP under conditions of LQTS, 64 , 65 , 66 which may be modulated by age. 67 This sexual difference in the TdP risk may be related to the intrinsic differences in ventricular repolarization across the ventricular walls that manifest as the differences in the T wave morphology, e.g., T wave amplitude, slopes of the ascending and descending limbs of the T wave and the Tp–e interval, on the body surface ECG. 51 , 68 , 69 However, the physiological significance of a sexual difference in the T wave morphology remains unknown.
T Wave Alternans (TWA)
TWA is characterized by beat‐to‐beat variation of T wave morphology, amplitude, and/or polarity, and it may precede the onset of malignant ventricular arrhythmias. 70 As expected, TWA is often associated with a beat‐to‐beat change in QT interval and has been observed under various pathophysiological conditions including ischemia, ventricular hypertrophy, electrolyte disturbances, and the long QT syndrome. 70 , 71
The mechanisms underlying the genesis of TWA are not fully understood. It is certain, however, that TWA is the ECG manifestation of beat‐to‐beat changes in ventricular repolarization. 70 There is evidence that TWA under conditions of a long QT interval during relatively fast pacing rates is largely the consequence of alteration of APD in the subendocardium during alternate beats. This is thought to be due to intracellular calcium cycling. 71 , 72 In the setting of ventricular hypertrophy and failure (for example, the rabbit renovascular hypertension model), endocardium but not epicardium exhibits a significant beat‐to‐beat change in APD at slow pacing rates. 49 Phase 2 EAD may be generated from endocardium during a beat with longer APD, leading to polymorphic VT under conditions of enhanced TDR. 49
“R‐on‐T” Phenomenon
It is well‐known that an R‐on‐T extrasystole is associated with polymorphic VT and VF particularly under conditions of myocardial ischemia, LQTS and Brugada syndrome. The R‐on‐T phenomenon was first described by Smirk in 1949 as “R waves interrupting T Waves.” 73 Theoretically, any transmurally conducted electrical activity during phase 2 or 3 of the action potential can manifest as an “R‐on‐T” extrasystole on the ECG. The terminal limb of the T wave encompasses the vulnerable window representing the interval of time during which some ventricular myocytes have recovered from refractoriness while others have not. 41 Therefore, an impulse arriving at the terminal limb of the T wave could potentially capture the vulnerable window and initiate polymorphic VT or VF. Two mechanisms have been demonstrated in the genesis of an R‐on‐T extrasystole: transmurally propagated phase 2 reentry and phase 2 EAD. Phase 2 reentry, secondary to the heterogeneous loss of the epicardial action potential dome, can produce a closely coupled R‐on‐T extrasystole with a normal QT interval, a mechanism probably responsible for the initiation of polymorphic VT and VF in the Brugada syndrome and acute transmural myocardial ischemia. 11 , 17 , 18 On the other hand, phase 2 EAD is associated with QT prolongation. Phase 2 EAD, which is generated from endocardium or subendocardium in the presence of APD prolonging agents, can propagate transmurally under conditions of enhanced TDR and produce an R‐on‐T extrasystole capable of initiating TdP (Fig. 6). 48
Figure 6.

(A) An R‐on‐T ectopic beat (arrow) initiated an episode of TdP in a patient with a markedly prolonged QT interval who had taken cisapride (reprinted from Ref.78 with permission). (B) Cisapride preferentially prolonged endocardial APD, resulting in the development of phase 2 EAD in an isolated rabbit left ventricular wedge preparation. Transmural propagation of EAD produced R‐on‐T ectopic beats (arrows) that were able to initiate TdP.
U WAVE
A physiologic U wave in the presence of normal serum potassium concentration is a small wave following the T wave. Its height is generally less than one fourth of the T wave height. The T–U junction is situated at or close to the isoelectric line, but it may be slightly deviated. 74 This is significantly different from a pathologic “U” wave seen under conditions such as hypokalemia. It is usually similar to or larger than the so‐called “T” wave with no isoelectric line between the two waves.
Although a physiologic U wave may be observed in normal adults, it is particularly prevalent in patients with the congenital long QT syndrome. The cellular basis for the electrocardiographic U wave has been a matter of debate for many years. Several hypotheses have been proposed to explain this last repolarization component of the ventricles. The likely cellular basis responsible for the physiologic U wave may be Purkinje fiber network or M cells with properties of delayed repolarization. 75 , 76 As mentioned previously, recent data have shown that M cells, electrically coupled with endocardium and epicardium, play a determining role in the genesis of the T wave. 41 The hypothesis that the Purkinje fiber network is responsible for the physiologic U wave seems most plausible, but direct evidence is still lacking. 75
From a mechanistic viewpoint, the pathologic U wave may be different from the physiologic U wave. In contrast to hyperkalemia, the rate of repolarization of phase 3 of the action potential during hypokalemia is slowed, giving rise to small opposing voltage gradients that crossover producing a low amplitude bifid T wave. 41 Under these conditions, full repolarization of the epicardium marks the peak of the second component of T wave, whereas repolarization of both endocardium and M cells contributes importantly to the descending limb of the second component of T wave. The apparent “T–U” complex seen during hypokalemia is in fact a T wave whose ascending limb is interrupted. 18 , 41 In clinical practice, however, to distinguish between pathologic and physiologic U waves may be difficult.
Advances in modern laboratory technology have permitted in depth research into many mysteries related to the electrophysiological behaviors of the heart. Some ECG waveforms on the electrocardiogram that were described many years ago, and others discovered within the last one or two decades, now have plausible ionic and cellular explanations. Despite this, more interrogation must be pursued in order to bridge the gap between basic electrophysiological research and clinical ECG phenomena.
Supported by the American Heart Association, the W. W. Smith Charitable Trust, the John S. Sharpe Foundation and the Adolph Rose Levis Foundation.
REFERENCES
- 1. Osborn JJ. Experimental hypothermia: Respiratory and blood pH changes in relation to cardiac function. Am J Physiol 1953;175: 389–398. [DOI] [PubMed] [Google Scholar]
- 2. Eagle K. Images in clinical medicine. Osborn waves of hypothermia. N Engl J Med 1994;10: 680. [DOI] [PubMed] [Google Scholar]
- 3. Sridharan MR, Horan LG. Electrocardiographic J wave of hypercalcemia. Am J Cardiol 1984;54: 672–673.DOI: 10.1016/0002-9149(84)90273-X [DOI] [PubMed] [Google Scholar]
- 4. Kambara H, Phillips J. Long‐term evaluation of early repolarization syndrome (normal variant RS‐T segment elevation). Am J Cardiol 1976;38: 157–161.DOI: 10.1016/0002-9149(76)90142-9 [DOI] [PubMed] [Google Scholar]
- 5. Zeppilli P, Pirrami MM, Sassara M, et al T wave abnormalities in top‐ranking athletes: Effects of isoproterenol, atropine, and physical exercise. Am Heart J 1980;100: 213–222.DOI: 10.1016/0002-8703(80)90117-9 [DOI] [PubMed] [Google Scholar]
- 6. Gussak I, Bjerregaard P, Egan TM, et al ECG phenomenon called the J wave. History, pathophysiology, and clinical significance. J Electrocardiol 1995;28: 49–58. [DOI] [PubMed] [Google Scholar]
- 7. Litovsky SH, Antzelevitch C. Transient outward current prominent in canine ventricular epicardium but not endocardium. Circ Res 1988;62: 116–126. [DOI] [PubMed] [Google Scholar]
- 8. Antzelevitch C, Sicouri S, Litovsky SH, et al Heterogeneity within the ventricular wall: Electrophysiology and pharmacology of epicardial, endocardial and M cells. Circ Res 1991;69: 1427–1449. [DOI] [PubMed] [Google Scholar]
- 9. Yan GX, Antzelevitch C. Cellular basis for the electrocardiographic J wave. Circulation 1996;93: 372–379. [DOI] [PubMed] [Google Scholar]
- 10. Kalla H, Yan GX, Marinchak R. Ventricular fibrillation in a patient with prominent J (Osborn) waves and ST segment elevation in the inferior electrocardiographic leads: A Brugada syndrome variant? J Cardiovasc Electrophysiol 2000;11: 95–98. [DOI] [PubMed] [Google Scholar]
- 11. Yan GX, Antzelevitch C. Cellular basis for the Brugada syndrome and other mechanisms of arrhythmogenesis associated with ST‐segment elevation. Circulation 1999;100: 1660–1666. [DOI] [PubMed] [Google Scholar]
- 12. Gussak I, Antzelevitch C, Bjerregaard P, et al The Brugada syndrome: Clinical, electrophysiologic and genetic aspects. J Am Coll Cardiol 1999;33: 5–15.DOI: 10.1016/S0735-1097(98)00528-2 [DOI] [PubMed] [Google Scholar]
- 13. Brugada P, Brugada J. Right bundle branch block, persistent ST segment elevation and sudden cardiac death: A distinct clinical and electrocardiographic syndrome: A multicenter report. J Am Coll Cardiol 1992;20: 1391–1396. [DOI] [PubMed] [Google Scholar]
- 14. Nademanee K, Veerakul G, Nimmannit S, et al Arrhythmogenic marker for the sudden unexplained death syndrome in Thai men. Circulation 1997;96: 2595–2600. [DOI] [PubMed] [Google Scholar]
- 15. Antzelevitch C, Brugada P, Brugada J, et al Brugada syndrome: 1992–2002: A historical perspective. J Am Coll Cardiol 2003;41: 1665–1671.DOI: 10.1016/S0735-1097(03)00310-3 [DOI] [PubMed] [Google Scholar]
- 16. Miyazaki T, Mitamura H, Miyoshi S, et al Autonomic and antiarrhythmic drug modulation of ST segment elevation in patients with Brugada syndrome. J Am Coll Cardiol 1996;27: 1061–1070.DOI: 10.1016/0735-1097(95)00613-3 [DOI] [PubMed] [Google Scholar]
- 17. Yan GX, Kowey PR. ST segment elevation and sudden cardiac death: From the Brugada syndrome to acute myocardial ischemia. J Cardiovasc Electrophysiol 2000;11: 1330–1332.DOI: 10.1046/j.1540-8167.2000.01330.x [DOI] [PubMed] [Google Scholar]
- 18. Yan GX, Lankipalli RS, Burke JF, et al Ventricular repolarization components on the electrocardiogram: Cellular basis and clinical significance. J Am Coll Cardiol 2003;42: 401–409.DOI: 10.1016/S0735-1097(03)00713-7 [DOI] [PubMed] [Google Scholar]
- 19. Di Diego JM, Sun ZQ, Antzelevitch C. Ito and action potential notch are smaller in left vs. right canine ventricular epicardium. Am J Physiol 1996;271: H548–H561. [DOI] [PubMed] [Google Scholar]
- 20. Krishnan SC, Antzelevitch C. Flecainide‐induced arrhythmia in canine ventricular epicardium: Phase 2 Reentry? Circulation 1993;87: 562–572. [DOI] [PubMed] [Google Scholar]
- 21. Atarashi H, Ogawa S, Harumi K, et al Characteristics of patients with right bundle branch block and ST‐segment elevation in right precordial leads. Idiopathic ventricular fibrillation investigators. Am J Cardiol 1996;78: 581–583.DOI: 10.1016/S0002-9149(96)00360-8 [DOI] [PubMed] [Google Scholar]
- 22. Shimizu W, Antzelevitch C, Suyama K, et al Effects of sodium channel blockers on ST segment, QRS duration, and corrected QT interval in patients with Brugada syndrome. J Cardiovasc Electrophysiol 2000;11: 1320–1329.DOI: 10.1046/j.1540-8167.2000.01320.x [DOI] [PubMed] [Google Scholar]
- 23. Chen Q, Kirsch GE, Zhang D, et al Genetic basis and molecular mechanism for idiopathic ventricular fibrillation. Nature 1998;392: 293–296.DOI: 10.1038/32675 [DOI] [PubMed] [Google Scholar]
- 24. Dumaine R, Towbin JA, Brugada P, et al Ionic mechanisms responsible for the electrocardiographic phenotype of the Brugada syndrome are temperature dependent [see comments]. Circ Res 1999;85: 803–809. [DOI] [PubMed] [Google Scholar]
- 25. Brugada R, Brugada J, Antzelevitch C, et al Sodium channel blockers identify risk for sudden death in patients with ST‐segment elevation and right bundle branch block but structurally normal hearts. Circulation 2000;101: 510–515. [DOI] [PubMed] [Google Scholar]
- 26. Di Diego JM, Cordeiro JM, Goodrow RJ, et al Ionic and cellular basis for the predominance of the Brugada syndrome phenotype in males. Circulation 2002;106: 2004–2011. [DOI] [PubMed] [Google Scholar]
- 27. Gussak I, Antzelevitch C. Early repolarization syndrome: Clinical characteristics and possible cellular and ionic mechanisms. J Electrocardiol 2000;33: 299–309.DOI: 10.1054/jelc.2000.18106 [DOI] [PubMed] [Google Scholar]
- 28. Saviolo R. Electrocardiographic responses to maximal exercise during acute pericarditis and early repolarization. Chest 1986;90: 460–462. [DOI] [PubMed] [Google Scholar]
- 29. Takagi M, Aihara N, Takaki H, et al Clinical characteristics of patients with spontaneous or inducible ventricular fibrillation without apparent heart disease presenting with J wave and ST segment elevation in inferior leads. J Cardiovasc Electrophysiol 2000;11: 844–848. [DOI] [PubMed] [Google Scholar]
- 30. Sahara M, Sagara K, Yamashita T, et al J wave and ST segment elevation in the inferior leads: A latent type of variant Brugada syndrome? Jpn Heart J 2002;43: 55–60.DOI: 10.1536/jhj.43.55 [DOI] [PubMed] [Google Scholar]
- 31. Takehara N, Makita N, Kawabe J, et al A cardiac sodium channel mutation identified in Brugada syndrome associated with atrial standstill. J Intern Med 2004;255: 137–142.DOI: 10.1046/j.0954-6820.2003.01247.x [DOI] [PubMed] [Google Scholar]
- 32. Aizawa Y, Tamura M, Chinushi M, et al An attempt at electrical catheter ablation of the arrhythmogenic area in idiopathic ventricular fibrillation. Am Heart J 1990;123: 257–260.DOI: 10.1016/0002-8703(92)90786-U [DOI] [PubMed] [Google Scholar]
- 33. Aizawa Y, Tamura M, Chinushi M, et al Idiopathic ventricular fibrillation and bradycardia‐dependent intraventricular block. Am Heart J 1993;126: 1473–1474.DOI: 10.1016/0002-8703(93)90550-S [DOI] [PubMed] [Google Scholar]
- 34. Potet F, Mabo P, Le Coq G, et al Novel brugada SCN5A mutation leading to ST segment elevation in the inferior or the right precordial leads. J Cardiovasc Electrophysiol 2003;14: 200–203. [DOI] [PubMed] [Google Scholar]
- 35. Burdon‐Sanderson JS, Page FJM. On the time relationsof the excitatory process in the ventricle of the heart of the frog. J Physiol (Lond) 1880;2: 384–435. [DOI] [PMC free article] [PubMed] [Google Scholar]
- 36. Mines GR. On functional analysis by the action of electrolytes. J Physiol 1913;188–235. [DOI] [PMC free article] [PubMed] [Google Scholar]
- 37. Ashamn R, Ferguson FP, Gremillion AL, et al The effect of cycle length changes upon the form and amplitude of the T deflection of the electrocardiogram. Am J Physiol 1945;143: 453–467. [Google Scholar]
- 38. Cohen IS, Giles WR, Noble D. Cellular basis for the T wave of the electrocardiogram. Nature 1976;262: 657–661. [DOI] [PubMed] [Google Scholar]
- 39. Noble D, Cohen IS. The interpretation of the T wave of the electrocardiogram. Cardiovasc Res 1978;12: 13–27. [DOI] [PubMed] [Google Scholar]
- 40. Burgess MJ. Relation of ventricular repolarization to electrocardiographic T wave form and arrhythmia vulnerability. Am J Physiol 1979;236: H391–H402. [DOI] [PubMed] [Google Scholar]
- 41. Yan GX, Antzelevitch C. Cellular basis for the normal T wave and the electrocardiographic manifestations of the long‐QT syndrome. Circulation 1998;98: 1928–1936. [DOI] [PubMed] [Google Scholar]
- 42. Higuchi T, Nakaya Y. T wave polarity related to the repolarization process of epicardial and endocardial ventricular surfaces. Am Heart J 1984;108: 290–295.DOI: 10.1016/0002-8703(84)90614-8 [DOI] [PubMed] [Google Scholar]
- 43. Sicouri S, Antzelevitch C. A subpopulation of cells with unique electrophysiological properties in the deep subepicardium of the canine ventricle: The M cell. Circ Res 1991;68: 1729–1741. [DOI] [PubMed] [Google Scholar]
- 44. Drouin E, Charpentier F, Gauthier C, et al Electrophysiological characteristics of cells spanning the left ventricular wall of human heart: Evidence for the presence of M cells. J Am Coll Cardiol 1995;26: 185–192.DOI: 10.1016/0735-1097(95)00167-X [DOI] [PubMed] [Google Scholar]
- 45. Yan GX, Shimizu W, Antzelevitch C. The characteristics and distribution of M cells in arterially‐perfused canine left ventricular wedge preparations. Circulation 1998;98: 1921–1927. [DOI] [PubMed] [Google Scholar]
- 46. Antzelevitch C, Shimizu M, Yan GX, et al The M cell: Its contribution to the ECG and to normal and abnormal electrical function of the heart. J Cardiovasc Electrophysiol 1999;10: 1124–1152. [DOI] [PubMed] [Google Scholar]
- 47. Shimizu W, Antzelevitch C. Cellular basis for the electrocardiographic features of the LQT1 form of the long QT syndrome: Effects of β‐adrenergic agonists, antagonists and sodium channel blockers on transmural dispersion of repolarization and torsade de pointes. Circulation 1998;98: 2314–2322. [DOI] [PubMed] [Google Scholar]
- 48. Yan GX, Wu Y, Liu T, et al Phase 2 early afterdepolarization as a trigger of polymorphic ventricular tachycardia in acquired long‐QT syndrome: Direct evidence from intracellular recordings in the intact left ventricular wall. Circulation 2001;103: 2851–2856. [DOI] [PubMed] [Google Scholar]
- 49. Yan GX, Rials SJ, Wu Y, et al Ventricular hypertrophy amplifies transmural repolarization dispersion and induces early afterdepolarization. Am J Physiol 2001;281: H1968–H1975. [DOI] [PubMed] [Google Scholar]
- 50. Shimizu W, Antzelevitch C. Differential effects of beta‐adrenergic agonists and antagonists in LQT1, LQT2 and LQT3 models of the long QT syndrome. J Am Coll Cardiol 2000;35: 778–786.DOI: 10.1016/S0735-1097(99)00582-3 [DOI] [PubMed] [Google Scholar]
- 51. Smetana P, Batchvarov V, Hnatkova K, et al Sex differences in the rate dependence of the T wave descending limb. Cardiovasc Res 2003;58: 549–554.DOI: 10.1016/S0008-6363(03)00319-5 [DOI] [PubMed] [Google Scholar]
- 52. Lubinski A, Lewicka‐Nowak E, Kempa M, et al New insight into repolarization abnormalities in patients with congenital long QT syndrome: The increased transmural dispersion of repolarization. Pacing Clin Electrophysiol 1998;21: 172–175. [DOI] [PubMed] [Google Scholar]
- 53. Takenaka K, Ai T, Shimizu W, et al Exercise stress test amplifies genotype‐phenotype correlation in the LQT1 and LQT2 forms of the long‐QT syndrome. Circulation 2003;107: 838–844. [DOI] [PubMed] [Google Scholar]
- 54. Viitasalo M, Oikarinen L, Swan H, et al Ambulatory electrocardiographic evidence of transmural dispersion of repolarization in patients with long‐QT syndrome type 1 and 2. Circulation 2002;106: 2473–2478. [DOI] [PubMed] [Google Scholar]
- 55. Yamaguchi M, Shimizu M, Ino H, et al T wave peak‐to‐end interval and QT dispersion in acquired long QT syndrome: A new index for arrhythmogenicity. Clin Sci (Lond) 2003;105: 671–676. [DOI] [PubMed] [Google Scholar]
- 56. Zabel M, Franz MR. The electrophysiological basis of QT dispersion: Global or local repolarization? Circulation 2000;101: E235–E236. [DOI] [PubMed] [Google Scholar]
- 57. Antzelevitch C. Molecular genetics of arrhythmias and cardiovascular conditions associated with arrhythmias. PACE 2003;26: 2194–2208. [DOI] [PubMed] [Google Scholar]
- 58. Xu X, Rials SJ, Wu Y. Left ventricular hypertrophy decreases slowly, but not rapidly activating delayed rectifier K+ currents of epicardial and endocardial myocytes in rabbits. Circulation 2001;103: 1585–1590. [DOI] [PubMed] [Google Scholar]
- 59. Moss AJ. Long QT syndrome. JAMA 2003;289: 2041–2044.DOI: 10.1001/jama.289.16.2041 [DOI] [PubMed] [Google Scholar]
- 60. Kass RS, Moss AJ. Long QT syndrome: Novel insights into the mechanisms of cardiac arrhythmias. J Clin Invest 2003;112: 810–815.DOI: 10.1172/JCI200319844 [DOI] [PMC free article] [PubMed] [Google Scholar]
- 61. Antzelevitch C, El Sherif N, Rosenbaum D, et al Cellular mechanisms underlying the long QT syndrome. J Cardiovasc Electrophysiol 2003;14: 114–115.DOI: 10.1046/j.1540-8167.2003.02480_1.x [DOI] [PubMed] [Google Scholar]
- 62. Shimizu W, Antzelevitch C. Effects of a K(+) channel opener to reduce transmural dispersion of repolarization and prevent torsade de pointes in LQT1, LQT2, and LQT3 models of the long‐QT syndrome. Circulation 2000;102: 706–712. [DOI] [PubMed] [Google Scholar]
- 63. El‐Sherif N, Chinushi M, Caref EB, et al Electrophysiological mechanism of the characteristic electrocardiographic morphology of torsade de pointes tachyarrhythmias in the long‐QT syndrome: Detailed analysis of ventricular tridimensional activation patterns. Circulation 1997;96: 4392–4399. [DOI] [PubMed] [Google Scholar]
- 64. Zareba W, Moss AJ, Le Cessie S, et al Risk of cardiac events in family members of patients with long QT syndrome. J Am Coll Cardiol 1995;26: 1685–1691.DOI: 10.1016/0735-1097(95)60383-2 [DOI] [PubMed] [Google Scholar]
- 65. Drici MD, Clement N. Is gender a risk factor for adverse drug reactions? The example of drug‐induced long QT syndrome. Drug Saf 2001;24: 575–585. [DOI] [PubMed] [Google Scholar]
- 66. Engelstein ED. Long QT syndrome: A preventable cause of sudden death in women. Curr Womens Health Rep 2003;3: 126–134. [PubMed] [Google Scholar]
- 67. Zareba W, Moss AJ, Locati EH, et al Modulating effects of age and gender on the clinical course of long QT syndrome by genotype. J Am Coll Cardiol 2003;42: 103–109.DOI: 10.1016/S0735-1097(03)00554-0 [DOI] [PubMed] [Google Scholar]
- 68. Simonson E, Cady LD, Woodbury M, Jr . The normal Q‐T interval. Am Heart J 1962;63: 747–753.DOI: 10.1016/0002-8703(62)90059-5 [DOI] [PubMed] [Google Scholar]
- 69. Lehmann MH, Yang H. Sexual dimorphism in the electrocardiographic dynamics of human ventricular repolarization: Characterization in true time domain. Circulation 2001;104: 32–38. [DOI] [PubMed] [Google Scholar]
- 70. Costantini O, Drabek C, Rosenbaum DS. Can sudden cardiac death be predicted from the T wave of the ECG? A critical examination of T wave alternans and QT interval dispersion. Pacing Clin Electrophysiol 2000;23: 1407–1416. [DOI] [PubMed] [Google Scholar]
- 71. Chinushi M, Kozhevnikov D, Caref EB, et al Mechanism of discordant T wave alternans in the in vivo heart. J Cardiovasc Electrophysiol 2003;14: 632–638. [DOI] [PubMed] [Google Scholar]
- 72. Shimizu W, Antzelevitch C. Cellular and ionic basis for T‐wave alternans under long‐QT conditions. Circulation 1999;99: 1499–1507. [DOI] [PubMed] [Google Scholar]
- 73. Smirk FH. R waves interrupting T waves. Br Heart J 1949;11: 23–26. [DOI] [PMC free article] [PubMed] [Google Scholar]
- 74. Surawicz B. U wave: Facts, hypotheses, misconceptions, and misnomers. J Cardiovasc Electrophysiol 1998;9: 1117–1128. [DOI] [PubMed] [Google Scholar]
- 75. Hurst JW. Naming of the waves in the ECG, with a brief account of their genesis. Circulation 1998;98: 1937–1942. [DOI] [PubMed] [Google Scholar]
- 76. Antzelevitch C, Sicouri S, Lukas A, et al Clinical implications of electrical heterogeneity in the heart: The electrophysiology and pharmacology of epicardial, M and endocardial cells In Podrid PJ, Kowey PR. (eds.): Cardiac Arrhythmia: Mechanism, Diagnosis and Management. Baltimore , MD , William & Wilkins, 1995, pp. 88–107. [Google Scholar]
- 77. Medina‐Ravell VA, Lankipalli RS, Yan GX, et al Effect of epicardial or biventricular pacing to prolong QT interval and increase transmural dispersion of repolarization: Does resynchronization therapy pose a risk for patients predisposed to long QT or torsade de pointes? Circulation 2003;107: 740–746. [DOI] [PubMed] [Google Scholar]
- 78. Makita N, Horie M, Nakamura T, et al Drug‐induced long‐QT syndrome associated with a subclinical SCN5A mutation. Circulation 2002;106: 1269–1274. [DOI] [PubMed] [Google Scholar]