

Abstract
Background
Cerebrovascular lesions are often associated with electrocardiographic (ECG) abnormalities. The main purpose of this work was to investigate the prognostic value of ECG abnormalities and/or elevated cardiac troponin (cTNT) on admission in patients with nontraumatic intracerebral hemorrhage (ICH).
Methods
Ninety‐seven consecutive patients with ICH were included. The predictive value of ECG abnormalities and increased TNT on survival were evaluated using Cox proportional hazard model.
Results
The most frequently observed ECG abnormalities were the presence of a Q wave (39.6%), followed by prolonged QTc (>0.44 s; 35.4%), which was an independent predictor for long‐term mortality (P = 0.019). No difference in QTc was observed between patients with right versus left ICH. Increased cTNT levels at admission had no prognostic value.
Conclusion
Various ECG changes were common in patients presenting with an ICH, but only prolonged QTc was found to be an independent predictor of poor survival during follow‐up after ICH.
Keywords: ECG, QTc, cTNT, intracerebral hemorrhage, stroke prognosis
Intracerebral hemorrhage (ICH) has a great impact on morbidity and mortality, although it causes only 10% to 15% of all strokes. Factors that are known to influence the clinical outcome after ICH are: level of consciousness, hemorrhage volume, associated intraventricular hemorrhage, infratentorial ICH location, and advanced age.1 Other prognostic factors for the acute and long‐term outcome of patients with ICH have not been well investigated. Though much research has focused on the importance of electrocardiographic (ECG) changes and increased cardiac troponin (cTNT) levels in relation to both ischemic stroke,2 and subarachnoid hemorrhage,3, 4 the literature pertaining to these abnormalities in patients with ICH is limited, with only a few reports and small numbers of patients.5, 6, 7, 8, 9, 10, 11, 12 Even though most authors found some type of ECG abnormality in ICH patients, a prognostic value of such changes was reported by some authors,8, 10, 13, 14 while being denied by others.5
Similarly, the prognostic value of high TNT levels (presumed to be sign of cardiac injury) on admission for ICH is still controversial. Hays et al. found that increased cTNT levels on admission in patients with ICH were associated with increased mortality,7 while Maramattom et al. found no relation between TNT and survival.9 Along a similar line, a wide—range of ECG abnormalities occurring after ICH was reported in a recent study by Hasegawa et al.6 The authors found that ischemic‐appearing changes, in a specified anatomical distribution, (i.e., in leads I and aVL, as well as V5 and V6) were more specific for true myocardial injury. Nevertheless, ECG changes, frequently encountered after acute cerebrovascular lesions, cannot be explained solely by concomitant ischemic cardiac disease.
This work focuses on the type and frequency of ECG changes on the admission ECG in patients with nontraumatic ICH. Our purpose was to assess the predictive value of these changes, and of elevated cTNT, in the absence of myocardial infarction, for survival during the acute phase of ICH and during follow‐up.
METHODS
A retrospective cohort study was performed on 103 patients admitted to Sahlgrenska University Hospital with nontraumatic ICH. The patients were admitted from February 15, 2006 through May 31, 2009. No patients were included from December 31, 2006 through September 3, 2007, due to problems related to data management. The local Ethics Committee approved the study.
The diagnosis of stroke follows the World Health Organization definition.15 The National Institute of Health Stroke Scale (NIHSS) was used to assess the severity of the stroke.16 The ECG was recorded within one hour from admission to hospital; CT‐scans, and blood tests were also carried out at admission. Stroke location was determined according to the profile of neurologic syndromes and imaging findings. The level of consciousness was graded at admission using the Reaction Level Scale (RLS; Table 1), which is a “coma scale” for the direct assessment of the overall reaction level in patients with acute brain disorders.17, 18
Table 1.
Reaction Level Scale (RLS)
| 1. Alert, no delay in response |
| 2. Drowsy or confused, responsive to light stimulation (talk, touch) |
| 3. Very drowsy or confused, responsive to strong stimulation (loud talk, shaking, pain) |
| 4. Unconscious, localizes but does not ward off pain |
| 5. Unconscious, withdrawing movements on pain stimulation |
| 6. Unconscious, stereotype flexion movements on pain stimulation |
| 7. Unconscious, stereotype extension movements on pain stimulation |
| 8. Unconscious, no response on pain stimulation |
For the purpose of the analysis, we categorized the site of the hemorrhage into right hemisphere, left hemisphere, or bilateral, since the cerebral area involved in the ICH was usually not confined to a small or single territory.
Exclusion criteria were: ICH secondary to trauma, primary or secondary tumors, vascular malformations, thrombolytic agents, and drug abuse. One patient with clinical myocardial infarction was also excluded from the analysis.
Venous blood was sampled on admission for the measurement of troponin T, cTNT (Roche Diagnostics, Mannheim, Germany), with an applied threshold of 0.01 μg/L for diagnosing myocardial infarction; but, as generally recommended,19 we used a diagnostic cutoff value of 0.03 μg/L in order to avoid false positive values. The cTNT results were dichotomized into normal and pathological, i.e., <0.03 μg/L and ≥0.03 μg/L.
ECG Analysis
The first 12‐lead routine ECG recording from each patient admitted for ICH was acquired by using a Megacart (Siemens‐Elema AB, Solna, Sweden) electrocardiograph, at a paper speed of 50 mm/s with an amplitude calibration of 10 mm/mV. The ECGs were analyzed by one observer blinded to clinical and follow‐up data, using the modified Minnesota code;20 for details see Table 2. ECG abnormalities were thus defined according to validated criteria: (1) rhythm: sinus rhythm, atrial fibrillation, other rhythm (e.g., atrial flutter); (2) frequency: sinus bradycardia (<60/min), sinus tachycardia (>100/min); (3) PR interval: normal (0.12–0.21 s), prolonged (>0.21 s, first‐degree AV conduction block); and (4) QRS width: prolonged (≥0.12s). QT (corrected for heart rate according to Bazett, QTc = QT × [RR]½, RR in seconds 21) was considered normal when ≤0.44 s, according to the modified Minnesota code. The QT interval was measured manually and defined as the interval from the QRS onset to the return of the T wave to the T‐P baseline. When U waves were present, the QT interval was measured to the nadir between T and U waves. In the presence of biphasic T waves, T end was measured at the time of final return to baseline. Three cardiac cycles were measured in each of the following leads: II, V2, and V5; the average QT time measured in lead V2 was used in the survival analysis (see Discussion). When atrial fibrillation was identified on the ECG, QT was measured following the shortest and longest RR intervals; the values were corrected by Bazett's formula (using the RR interval preceding the measured QT) and then averaged. The intraobserver variability was estimated by remeasuring the QT interval on 20 ECGs. The mean absolute difference was 5.2 ms and the relative error was 1.2%.
Table 2.
Pathological ECG Findings According to the Modified Minnesota Code
| Heart rate | Over 100 |
| Atrial fibrillation | Atrial fibrillation present/absent |
| AV conduction | PR ≥0.21 s (I, II, III) |
| Q wave | Q/R ≥1/5, Q duration ≥0.03 s |
| Ventricular conduction | QRS ≥0.12 s |
| Left ventricular hypertrophy | Sokolow‐Lyon index ≥38 mm and/or Cornel product ≥2440 |
| QTc | over 0.44 s |
| ST segment | ST depression ≥1 mm (V1‐V6, I, II, aVL, aVF) when R ≥5 mm (aVL) |
| T wave | T wave ≥–5mm (V2‐V6, I, II) when R ≥5 mm (aVL) when QRS upright (aVF) |
AV conduction (I, II, III refers to atrioventricular block of first, second, and third degree).
ST‐segment depression, T‐wave and Q‐wave characteristics, and indices for left ventricular hypertrophy were defined according to the modified Minnesota code (Table 2).
Outcome
The primary endpoint was all‐cause mortality from the admission to hospital and up to the study‐end, April 2011. Since, as mentioned above, inclusion started in February 2005 and lasted until May 2009 the longest follow‐up period was 74 months while the shortest was 23 months; the median follow‐up time was 32 months. All mortality data—obtained from VästFolket, a registry of all deaths in Västra Götaland, Sweden—were registered in a database.
Statistics
We used the Mann‐Whitney U‐test for comparing the mean values of continuous variables (NIHSS, serum potassium, QTc) by group. The association between risk factors and death at the end of each observational period was investigated using the chi‐square test; P‐values <0.05 were regarded as statistically significant. Survival was analysed by Kaplan‐Meier estimates and Cox proportional hazard regression, where age, stroke severity, hypertension, diabetes mellitus, cTNT, previous ICH, previous myocardial infarction, and ECG parameters, including QTc, were used as covariates; the results are presented as the odds ratio (OR) with 95% confidence intervals (CI). Log rank tests were used for comparison of survival curves by prolonged QTc (yes/no) and by increased TNT (yes/no). All statistical analyses were performed using the SPSS 17.0 package (SPSS Inc., Chicago, IL, USA).
RESULTS
Baseline Characteristics
One hundred three patients (N = 103) with ICH were identified in the Stroke database. Six patients were excluded because of missing ECGs, leaving 97 patients in the study. One patient was diagnosed with acute myocardial infarction; the cTNT level in this patient was 2.13 μg/L. This patient was excluded from the final analysis.
Forty‐two patients had right while 49 had left hemisphere hemorrhage; the remaining five had bilateral bleeding. The clinical severity of the ICH (as assessed by NIHSS) was not statistically different between the left‐ and the right‐sided lesions (P = 0.4).
Twenty‐eight patients were on medication with beta‐blockers at admission to the hospital. There was no significant difference between the QTc values in the patients on beta‐blockers compared to the others, 0.44 s ± 0.09 and, 0.43 s ± 0.09, respectively. The mean serum potassium concentration (mmol/L) was 3.90 ± 0.09 in the patients with QTc ≤0.44 s, and 3.93 ± 0.09 in the group with QTc >0.44 s (P = 0.778 by Mann‐Whitney test). Patient characteristics are presented in Table 3.
Table 3.
The Demographic Characteristics of Patients with Intracerebral Hemorrhage at Baseline (N = 96)
| Baseline characteristics % | Survivors (n = 76) | Nonsurvivors (n = 20) | P‐value |
|---|---|---|---|
| Mean age, years (±SEM) | 77.0 ± 8.8 | 78.6 ± 7.4 | 0.5 |
| Women | 50.0% | 40.0% | 0.5 |
| Smokers | 13.9% | 14.3% | 0.5 |
| Hyperlipidemia | 10.7% | 14.3% | 0.7 |
| Increased cTNT (>0.03 μg/L) | 21.7% | 27.3% | 0.8 |
| Prolonged QTc (>0.44 s) | 31.6% | 50% | 0.02* |
| Hypertension | 54.7% | 66.7% | 0.3 |
| Diabetes mellitus type 2 | 12.0% | 14.3% | 0.8 |
| Atrial fibrillation | 18.7% | 23.8% | 0.6 |
| Previous myocardial infarction | 6.7% | 14.3% | 0.3 |
| Heart failure | 5.7% | 4.3% | 0.2 |
| Previous stroke, ischemic | 20.3% | 33.3% | 0.2 |
| Previous stroke, hemorrhagic | 2.7% | 14.3% | 0.04* |
| Previous TIA | 6.7% | 9.5% | 0.6 |
| Assessments on admission, mean (SD) | |||
| Systolic blood pressure, mmHg | 174.9 (32.3) | 174.8 (35.6) | 0.7 |
| Diastolic blood pressure, mmHg | 99.1 (21.6) | 93.8 (21.8) | 0.02* |
| TG, mmol/L | 1.1 (0.7) | 0.9 (0.3) | 0.8 |
| LDL, mmol/L | 2.9 (1.2) | 2.9 (1.1) | 0.1 |
*p < 0.05.
Mortality Data
All‐cause mortality during the acute phase (up to 30 days from the onset of symptoms) was 20%; at one‐year follow‐up, mortality was 28%, while at study‐end we found that 47% of the patients had died. For specific causes of death, see Table 4. There was no difference in outcome between patients with right compared to those with left hemisphere involvement.
Table 4.
Cumulative Mortality (%) during Follow‐Up after Acute ICH (N = 45)
| 30 days (N = 19) | One year (N = 27) | Study‐end (N = 45)a | |
|---|---|---|---|
| Cause of death | |||
| Stroke | 15.6% | 15.6% | 17.7% |
| Cardiac death | 2.1% | 4.2% | 7.3% |
| Infection/sepsis | 2.1% | 3.1% | 5.2% |
| Cancer, other causes | 0% | 5.2% | 16.7% |
| Total | 19.8% | 28.1% | 46.9% |
N = number of registered deaths.
11 cases with missing death diagnoses.
RLS, NIHSS, and Outcome
The level of consciousness, measured as RLS, as well as stroke severity, measured by NIHSS score, were independent predictors of adverse prognosis during the acute phase (P < 0.001 and P = 0.005, respectively); both the RLS and the NIHSS score retained their predictive power for mortality until the end of the study period (P < 0.001 and P = 0.002, respectively). Only 6.2% of our patients had an RLS >3.
ECG Changes and Outcome
Abnormalities on admission ECGs were found in 75.4% of all patients. The most frequent findings were: presence of a Q wave (39.6%); prolonged repolarization time, QTc (35.4%); ST‐T changes (25.0%); sinus tachycardia (21.9%); LVH (16.7%); atrial fibrillation (15.6%); first‐degree AV‐block (7.9%); and sinus bradycardia (6.3%); for details, see Table 5, which shows the frequency of ECG abnormalities by acute survival (up to 30 days after stroke diagnosis). Mean QTc values were 0.43 s ± 0.042; 0.43 s ± 0.038; and 0.43 s ± 0.043 in lead II, V2, and V5, respectively.
Table 5.
Electrocardiographic Abnormalities Present in the Study Group (N = 96)
| ECG changes | Atrial Fibrillation | Bradycardia | Tachycardia | ST Depression | Deep T wave Inversion | Q wave | LVH | Prolonged QTc | |
|---|---|---|---|---|---|---|---|---|---|
| Survivors (N) | 76 | 12 | 5 | 13 | 18 | 3 | 27 | 11 | 24 |
| Right hemisphere | 33 (43.4%) | 2 | 3 | 4 | 8 | 2 | 11 | 3 | 10 |
| Left hemisphere | 39 (51.3%) | 8 | 2 | 8 | 8 | 1 | 14 | 8 | 13 |
| Bilateral hemorrhage | 4 (5.3) | 2 | 0 | 1 | 2 | 0 | 2 | 0 | 1 |
| Nonsurvivors (N) | 20 | 3 | 1 | 8 | 3 | 0 | 11 | 5 | 10 |
| Right hemisphere | 9 (45.0%) | 1 | 1 | 5 | 1 | 0 | 7 | 2 | 6 |
| Left hemisphere | 10 (50.0%) | 2 | 0 | 3 | 2 | 0 | 4 | 3 | 4 |
| Bilateral hemorrhage | 1 (5.0%) | 0 | 0 | 0 | 0 | 0 | 0 | 0 | 0 |
| P‐value (chi‐square) | NS | NS | NS | NS | NS | NS | NS | 0.019 |
ECG, electrocardiographic; LVH, left ventricular hypertrophy.
Deep T‐wave inversion (>5 mm). Chi‐square test for equal proportions: survivors versus nonsurvivors.
The mean QTc was significantly longer in patients who died (0.45 s ± 0.004), compared with those who survived (0.42 s ± 0.007) up to the end of the study period, P = 0.03. The QTc was 0.46 s ± 0.009 in the patients who died of a cardiac cause compared to 0.45 s ± 0.007 in those who died of any other cause; the difference was not statistically significant (P = 0.2).
QTc was not different between patients with right (0.43 s ± 0.004) compared with those with left ICH (0.43 s ± 0.003), P = 0.4.
In a post hoc analysis confined to women (n = 46), the cutoff value for a normal QTc of ≤0.46 s was used; we found no statistically significant difference in survival. Furthermore, no difference was noted when comparing the mean QTc in surviving women versus in those who died (0.45 ± 0.008 vs 0.46 ± 0.006; P = 0.9 Mann‐Whitney).
cTNT
cTNT was not measured in all patients; only 61 of the 97 patients included in the study had a cTNT value registered on admission to the hospital. In the remaining cases, the attending physicians did not think that an acute coronary syndrome needed to be ruled out.
The levels of cTNT were high (above 0.03 μg/L) in 25.8% of the patients. The increase of cTNT levels was modest (range, 0.03–0.18 μg/L; mean ± SD, 0.06 ± 0.03) and did not correlate with survival (P = 0.6). No statistically significant difference was noted in TNT levels between the patients with right‐ versus those with left‐sided lesions.
Multiple Cox Proportional Hazard Regression
Survival analysis demonstrated that a prolonged repolarization time (QTc) according to the Minnesota code was an independent predictor of mortality (after adjusting for age, gender, NIHSS, diabetes mellitus, atrial fibrillation, previous myocardial infarction, and previous ICH; HR, 2.43; CI, 1.04 to 5.68; P = 0.019). The Kaplan‐Meier survival curves, according to the duration of QTc are shown in Figure 1 (N showing the number of registered deaths). No other ECG parameter predicted mortality in a statistically significant manner. Other independent predictors of mortality were, however, age (HR, 1.12; CI, 1.05 to 1.19; P < 0.001); clinical severity of ICH expressed as NIHSS score (HR, 1.07; CI, 1.02 to 1.11; P = 0.002), RLS (HR, 1.45; CI 1.17 to 1.80; P = 0.001), and previous ICH (HR 6.59; CI, 1.93 to 22.54; P = 0.003), see Table 6.
Figure 1.
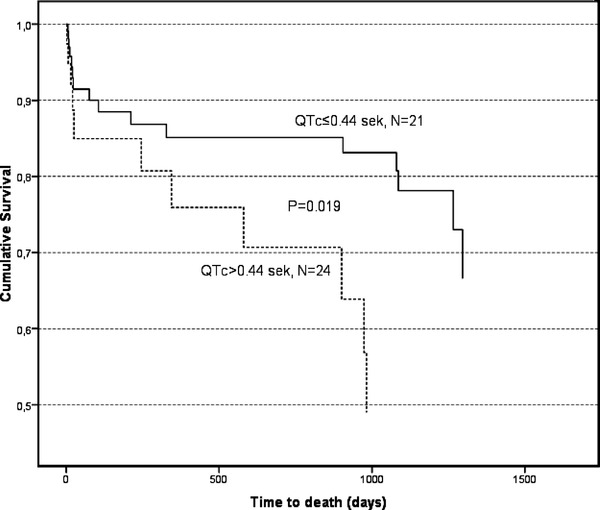
Cumulative long‐term survival in patients with nontraumatic intracerebral hemorrhage (N = 96); comparison between patients with prolonged QTc (>0.44 s) compared with patients with normal QTc (≤0.44 s), N = number of registered deaths in each group.
Table 6.
Multiple Cox Regression Analysis Showing the Relationship between Survival and Explanatory Variables
| Cox model for all clinically relevant variables | Final Cox model after removing nonsignificant variables | |||||
|---|---|---|---|---|---|---|
| Explanatory variable | HRa | 95% CI | P‐value | HRa | 95% CI | P‐value |
| Age (years) | 1.12 | 1.05–1.19 | <0.001*** | 1.07 | 1.02–1.12 | 0.004** |
| Gender, male | 1.71 | 0.66–4.41 | 0.265 | |||
| NIHSS | 1.07 | 1.02–1.11 | 0.002** | 4.05 | 1.95–8.42 | <0.001*** |
| RLS | 1.45 | 1.17–1.80 | 0.001*** | 1.32 | 1.08–1.61 | 0.006** |
| Diabetes mellitus type 2 | 3.76 | 0.91–15.53 | 0.067 | |||
| Atrial fibrillation | 1.73 | 0.68–4.40 | 0.251 | |||
| Previous myocardial infarction | 1.15 | 0.20–6.42 | 0.877 | |||
| Chronic heart failure | 1.21 | 0.71–2.07 | 0.487 | |||
| Previous ICH | 6.59 | 1.93–22.54 | 0.003** | 2.64 | 1.03–6.76 | 0.043** |
| Heart rate | 1.01 | 0.99–1.04 | 0.237 | |||
| A‐V conduction | 3.14 | 0.51–19.45 | 0.219 | |||
| QRS time | 1.02 | 0.99–1.05 | 0.169 | |||
| Q wave | 0.72 | 1.27–1.93 | 0.516 | |||
| ST segment | 0.52 | 0.17–1.58 | 0.248 | |||
| T wave | 2.06 | 0.22–19.59 | 0.529 | |||
| Left ventricle hypertrophy | 0.65 | 0.11–3.77 | 0.630 | |||
| QTc | 2.43 | 1.04–5.68 | 0.019** | 1.01 | 1.01–1.12 | 0.029** |
HR for high stroke severity, increase of age by one year, or presence of a specific medical condition or ECG abnormality.
**p < 0.01; ***p < 0.001.
DISCUSSION
The most important findings of this study are: (1) a large proportion of ICH patients present with ECG abnormalities at admission; (2) prolonged repolarization time (QTc) according to the Minnesota code is related to impaired long‐term survival in ICH patients; and (3) increased troponin T on admission to the hospital, in the absence of myocardial infarction, does not correlate to prognosis.
As expected, the incidence of associated ECG changes in our patients was very high. About 75% of the admission ECGs showed some kind of abnormality, irrespective of whether the patients had been diagnosed with preexisting heart disease or not. In agreement with earlier published results,6, 23 we also found that most of the ECG abnormalities in patients with ICH did not predict outcome. Only a QTc >0.44 s was found to be associated with impaired survival, and only less so than for a previous ICH.
Generally, there are two mechanisms that might mediate ECG changes in patients with cerebral lesions: autonomic neural stimulation from the hypothalamus/insula and/or elevated circulating catecholamines. Hypothalamic stimulation might cause ECG changes without associated myocardial damage whereas elevated circulating catecholamines might result in myocardial damage. Catecholamines can induce tachycardia, coronary vasospasm, and direct myocardial toxicity due to increased intracellular calcium, resulting in cTNT increase.22
cTNT seems to be a strong predictor of mortality in ischemic stroke, but its predictive value is still controversial in the context of nontraumatic ICH. A possible explanation would be that patients with ischemic stroke are more prone to generalized vascular disease, including coronary artery disease, which makes the myocardium more vulnerable to neurohumoral stimuli, with subsequent TNT release.
We found increased cTNT in 25.8% of the patients; the observed cTNT elevations were, however, modest. Sandhu et al.23 reported increased TNI in 15% of patients with ICH. In‐hospital mortality increased with higher levels of TNI in their study, up to 16.3 times in patients with ischemic stroke, but only 2.3 times in patients with ICH. We could not corroborate these results. This could be attributed to our small sample size and the low prevalence of severe ICH (only 6.2% of our patients had an RLS >3). In our study, most ECG changes were not accompanied by concomitant troponin elevations, thus suggesting that they were not induced by ischemia, but rather by alterations in autonomic tone. We found that elevated cTNT at admission, in the absence of myocardial infarction, did not affect survival. Our findings are in agreement with those of Maramattom et al.9 who showed that cTNT elevations in survivors of acute ICH did not influence one‐month mortality.
Perturbation of autonomic nervous tone, and subsequent heterogeneous myocardial repolarization, are generally believed to be the mechanisms behind cardiac arrhythmogenesis in patients with cerebral lesions.5 The only ECG change that correlated to mortality in our study was a prolonged repolarization time (QTc >0.44 s). Prolonged QTc might reflect an increased mortality risk due to life‐threatening arrhythmias. As shown by Oppenheimer et al.,14 several mechanisms might explain the relation between cerebral and cardiac injury, including microvascular spasm and increased levels of circulating catecholamines, which might instigate not only electrical abnormalities but also myocardial/myocyte damage.24, 25
ECG changes are mostly directly related to the cerebral injury,14 but they could also reflect preexisting coronary artery disease.26 In our study, large proportions of patients had hypertension, ischemic cardiomyopathy, or diabetes mellitus. All these conditions might increase repolarization time (QTc).27 Thus, the predictive power of QTc is probably not only related to its intrinsic value as a marker for arrhythmia risk, but also to its relation to comorbidity and thereby to its deleterious effect on survival. If taking measures guided by the QTc would improve prognosis of patients with ICH was not studied and remains to be shown.
Notably, in a post hoc analysis including only women, we found no statistically significant difference in the mean QTc time in surviving women compared to those who died. Probably, our study group is underpowered for drawing conclusions since only 13 women had QTc above 0.46 s (which is generally recommended as cut‐off value for women). However, if our sample is regarded as representative, then this finding should emphasize the lack of predictive value of QTc on women's survival.
One limitation of our study is that ECG analysis was restricted to admission ECG and no information was available on ECG/QTc prior to or after the ICH.
Another limitation is that we did not take into account the size of the hemorrhage, but the data published by Maramattom et al. showed no association of location, volume, or side of hemorrhage, with ECG changes.9 Furthermore, it has recently been shown that ICH severity (estimated by NIHSS or/and RLS) is a very strong predictor of mortality per se; adding computed tomography findings to ICH severity in a prediction score model has little or no impact on further improving the mortality prediction.28
Finally, it is recognized that measurement of QT is restricted by practical estimation difficulties; estimates vary between leads since a single repolarization vector has different orientations in different leads; moreover, differences in QT values may partially be due to regional differences in repolarization. We chose to use the QT measured in lead V2 because earlier studies focusing on QT estimation recommended the use of anteroseptal leads, which seem to give the closest approximation to QTmax.29, 30
The recently suggested cutoff values are expressed in ms and 440 ms for QTc has been identified by some,31, 32 as un upper limit of normal, but might be considered quite low and therefore higher values have been recommended such as 450 ms for adult men and 460 ms for adult women.33 However, the risk for cardiac mortality associated with certain threshold levels of prolonged QTc is at least as high in women as in men. Therefore, it is recommended that the threshold for prolonged heart rate‐corrected QT in women should be comparable with that in men.34 In this study, we used a single cutoff of 0.44 s since this is the value suggested by the modified Minnesota code, which we used for ECG analysis. It is worth emphasizing that our study cohort had an average age of about 78 years and, according to the AHA/ACCF/HRS recommendations for the interpretation of the ECG, the gender difference in rate‐adjusted QT interval becomes smaller after 40 years of age and practically disappears in older men and women.33
The correction of QTc for the simultaneous heart rate was performed according to Bazett. Even if there are limitations related to this method (which leaves a positive residual correlation with heart rate), it still is the most widely used. Moreover, de Bruyne et al. showed that the risk for all‐cause and cardiac mortality associated with heart rate‐corrected QT is hardly influenced by the formula used for correction.34 The same was found by Dekker et al. in a study published in 2004. These authors reported a high correlation between the QTc values obtained manually by three different methods (Bazett, Hodges, and Rautaharju).35
In conclusion, patients with nontraumatic ICH may present with a diversity of ECG changes and with moderately elevated cTNT levels. The TNT increase is modest and does not seem to affect acute and/or long‐term outcome as long as this is not the expression of a clinical myocardial infarction. Of all abnormalities on the admission ECG, only prolonged QTc was associated with increased all‐cause mortality and it seems that a QTc >0.44 s suggests impaired survival.
Acknowledgments
We are greatly indebted to Kirsten Mehlig, Ph.D., for statistical advice and help with data management and to Alieh Shadman and Jessica Antonsson, research nurses, for help with management of the database.
REFERENCES
- 1. Juvela S. Risk factors for impaired outcome after spontaneous intracerebral hemorrhage. Arch Neurol 1995;52(12):1193–1200. [DOI] [PubMed] [Google Scholar]
- 2. Christensen H, Fogh Christensen A, Boysen G. Abnormalities on ECG and telemetry predict stroke outcome at 3 months. J Neurol Sci 2005;234(1–2):99–103. [DOI] [PubMed] [Google Scholar]
- 3. Randell T, Tanskanen P, Scheinin M, et al. QT dispersion after subarachnoid hemorrhage. J Neurosurg Anesthesiol 1999;11(3):163–166. [DOI] [PubMed] [Google Scholar]
- 4. Sato K, Kato M, Yoshimoto T. QT intervals and QT dispersion in patients with subarachnoid hemorrhage. J Anesth 2001;15(2):74–77. [DOI] [PubMed] [Google Scholar]
- 5. Golbasi Z, Selcoki Y, Eraslan T, et al. QT dispersion. Is it an independent risk factor for in‐hospital mortality in patients with intracerebral hemorrhage? Jpn Heart J 1999;40(4):405–411. [DOI] [PubMed] [Google Scholar]
- 6. Hasegawa K, Fix ML, Wendell L, et al. Ischemic‐appearing electrocardiographic changes predict myocardial injury in patients with intracerebral hemorrhage. Am J Emerg Med 2012;30(4):545–552. [DOI] [PMC free article] [PubMed] [Google Scholar]
- 7. Hays A, Diringer MN. Elevated troponin levels are associated with higher mortality following intracerebral hemorrhage. Neurology 2006;66(9):1330–1334. [DOI] [PubMed] [Google Scholar]
- 8. Huang CH, Chen WJ, Chang WT, et al. QTc dispersion as a prognostic factor in intracerebral hemorrhage. Am J Emerg Med 2004;22(3):141–144. [DOI] [PubMed] [Google Scholar]
- 9. Maramattom BV, Manno EM, Fulgham JR, et al. Clinical importance of cardiac troponin release and cardiac abnormalities in patients with supratentorial cerebral hemorrhages. Mayo Clin Proc 2006;81(2):192–196. [DOI] [PubMed] [Google Scholar]
- 10. Sander D, Klingelhofer J. Changes of circadian blood pressure patterns and cardiovascular parameters indicate lateralization of sympathetic activation following hemispheric brain infarction. J Neurol 1995;242(5):313–318. [DOI] [PubMed] [Google Scholar]
- 11. van Bree MD, Roos YB, van der Bilt IA, et al. Prevalence and characterization of ECG abnormalities after intracerebral hemorrhage. Neurocrit Care 2010;12(1):50–55. [DOI] [PubMed] [Google Scholar]
- 12. Yamour BJ, Sridharan MR, Rice JF, et al. Electrocardiographic changes in cerebrovascular hemorrhage. Am Heart J 1980;99(3):294–300. [DOI] [PubMed] [Google Scholar]
- 13. Liu Q, Ding Y, Yan P, et al. Electrocardiographic abnormalities in patients with intracerebral hemorrhage. Acta Neurochir Suppl 2011;111:353–356. [DOI] [PubMed] [Google Scholar]
- 14. Oppenheimer SM. Neurogenic cardiac effects of cerebrovascular disease. Curr Opin Neurol 1994;7(1):20–24. [DOI] [PubMed] [Google Scholar]
- 15. The World Health Organization MONICA Project (monitoring trends and determinants in cardiovascular disease): A major international collaboration. J Clin Epidemiol 1988;41(2):105–114. [DOI] [PubMed] [Google Scholar]
- 16. Brott T, Adams HP, Jr. , Olinger CP, et al. Measurements of acute cerebral infarction: A clinical examination scale. Stroke 1989;20(7):864–870. [DOI] [PubMed] [Google Scholar]
- 17. Starmark JE, Stalhammar D, Holmgren E. The reaction level scale (RLS85). Manual and guidelines. Acta Neurochir (Wien) 1988;91(1–2):12–20. [DOI] [PubMed] [Google Scholar]
- 18. Walther SM, Jonasson U, Gill H. Comparison of the Glasgow coma scale and the reaction level scale for assessment of cerebral responsiveness in the critically ill. Intensive Care Med 2003;29(6):933–938. [DOI] [PubMed] [Google Scholar]
- 19. Alpert JS, Thygesen K, Antman E, et al. Myocardial infarction redefined–a consensus document of The Joint European Society of Cardiology/American College of Cardiology Committee for the redefinition of myocardial infarction. J Am Coll Cardiol 2000;36(3):959–969. [DOI] [PubMed] [Google Scholar]
- 20. Blackburn H, Keys A, Simonson E, et al. The electrocardiogram in population studies. A classification system. Circulation 1960;21:1160–1175. [DOI] [PubMed] [Google Scholar]
- 21. Bazett HC. An analysis of the time‐relations of electrocardiograms. Heart 1920;7:53–70. [Google Scholar]
- 22. Davis TP, Alexander J, Lesch M. Electrocardiographic changes associated with acute cerebrovascular disease: A clinical review. Prog Cardiovasc Dis 1993;36(3):245–260. [DOI] [PubMed] [Google Scholar]
- 23. Sandhu R, Aronow WS, Rajdev A, et al. Relation of cardiac troponin I levels with in‐hospital mortality in patients with ischemic stroke, intracerebral hemorrhage, and subarachnoid hemorrhage. Am J Cardiol 2008;102(5):632–634. [DOI] [PubMed] [Google Scholar]
- 24. Ramani A, Shetty U, Kundaje GN. Electrocardiographic abnormalities in cerebrovascular accidents. Angiology 1990;41(9 Pt 1):681–686. [DOI] [PubMed] [Google Scholar]
- 25. Tokgozoglu SL, Batur MK, Topuoglu MA, et al. Effects of stroke localization on cardiac autonomic balance and sudden death. Stroke 1999;30(7):1307–1311. [DOI] [PubMed] [Google Scholar]
- 26. Khechinashvili G, Asplund K. Electrocardiographic changes in patients with acute stroke: A systematic review. Cerebrovasc Dis 2002;14(2):67–76. [DOI] [PubMed] [Google Scholar]
- 27. Rossing P, Breum L, Major‐Pedersen A, et al. Prolonged QTc interval predicts mortality in patients with type 1 diabetes mellitus. Diabet Med 2001;18(3):199–205. [DOI] [PubMed] [Google Scholar]
- 28. Zahuranec DB, Sanchez BN, Brown DL, et al. Computed tomography findings for intracerebral hemorrhage have little incremental impact on post‐stroke mortality prediction model performance. Cerebrovasc Dis 2012;34(1):86–92. [DOI] [PMC free article] [PubMed] [Google Scholar]
- 29. Campbell RW, Gardiner P, Amos PA, et al. Measurement of the QT interval. Eur Heart J 1985;6(6):81–83. [DOI] [PubMed] [Google Scholar]
- 30. Cowan JC, Yusoff K, Moore M, et al. Importance of lead selection in QT interval measurement. Am J Cardiol 1988;61(1):83–87. [DOI] [PubMed] [Google Scholar]
- 31. Garson A, Jr . How to measure the QT interval–what is normal? Am J Cardiol 1993;72(6):14B–16B. [DOI] [PubMed] [Google Scholar]
- 32. Molnar J, Zhang F, Weiss J, et al. Diurnal pattern of QTc interval: How long is prolonged? Possible relation to circadian triggers of cardiovascular events. J Am Coll Cardiol 1996;27(1):76–83. [DOI] [PubMed] [Google Scholar]
- 33. Rautaharju PM, Surawicz B, Gettes LS, et al. AHA/ACCF/HRS recommendations for the standardization and interpretation of the electrocardiogram: Part IV: The ST segment, T and U waves, and the QT interval: A scientific statement from the American Heart Association Electrocardiography and Arrhythmias Committee, Council on Clinical Cardiology; the American College of Cardiology Foundation; and the Heart Rhythm Society. Endorsed by the International Society for Computerized Electrocardiology. J Am Coll Cardiol 2009;53(11):982–991. [DOI] [PubMed] [Google Scholar]
- 34. de Bruyne MC, Hoes AW, Kors JA, et al. Prolonged QT interval predicts cardiac and all‐cause mortality in the elderly. The Rotterdam Study. Eur Heart J 1999;20(4):278–284. [DOI] [PubMed] [Google Scholar]
- 35. Dekker JM, Crow RS, Hannan PJ, et al. Heart rate‐corrected QT interval prolongation predicts risk of coronary heart disease in black and white middle‐aged men and women: The ARIC study. J Am Coll Cardiol 2004;43(4):565–571. [DOI] [PubMed] [Google Scholar]