Abstract
In acute coronary syndromes, the electrocardiogram (ECG) provides important information about the presence, extent, and severity of myocardial ischemia. At times, the changes are typical and clear. In other instances, changes are subtle and might be recognized only when ECG recording is repeated after changes in the severity of symptoms. ECG interpretation is an essential part of the initial evaluation of patients with symptoms suspected to be related to myocardial ischemia, along with focused history and physical examination. Patients with ST‐segment elevation on their electrocardiogram and symptoms compatible with acute myocardial ischemia/infarction should be referred for emergent reperfusion therapy. However, it should be emphasized that a large number of patients may have ST‐elevation without having acute ST‐elevation acute coronary syndrome, while acute ongoing transmural ischemia due to an abrupt occlusion of an epicardial coronary artery may occur in patients with ST‐elevation less than the thresholds defined by the guidelines. Up‐sloping ST‐segment depression with positive T waves is increasingly recognized as a sign of regional subendocardial ischemia associated with severe obstruction of the left anterior descending coronary artery. Widespread ST‐segment depression, often associated with inverted T waves and ST‐segment elevation in lead aVR during episodes of chest pain, may represent diffuse subendocardial ischemia caused by severe coronary artery disease. In case of hemodynamic compromise, urgent coronary angiography has been increasingly recommended for these patients.
Keywords: acute coronary syndrome, electrocardiogram, ST‐segment elevation, ST‐segment depression, risk stratification, triage, myocardial infarction
Acute coronary syndromes (ACS) are caused by an imbalance between myocardial oxygen demand and blood flow, which may be caused by either an acute reduction of blood supply or an increase in demand that cannot be matched by augmentation of blood flow. The most severe manifestation of ACS is acute reduction of blood flow, caused by an occlusive blood clot that is formed on a ruptured atherosclerotic plaque in an epicardial coronary artery. This usually leads to complete or almost complete obliteration of the coronary artery lumen, resulting in acute transmural ischemia that involves all layers of the myocardium with necrosis of the involved tissue, if reperfusion does not occur rapidly. Other causes of an abrupt coronary artery occlusion are coronary embolus, spasm, and dissection of the aorta with involvement of the orifice of the main coronary artery or dissection of the coronary artery itself. Occasionally, total occlusion of an epicardial coronary artery does not lead to transmural ischemia due to the presence of residual flow via collateral circulation. In many instances, the blood clot overlying the ruptured plaque does not completely block the blood flow. Dynamic changes in the size of the thrombus with distal embolization of platelet aggregates and clots and secretion of vasoactive substances lead to cyclic flow variations with repeat episodes of subendocardial ischemia (so‐called unstable angina) that may lead to myocardial cellular injury (acute myocardial infarction; AMI). As mentioned above, ACS may be caused by abrupt increase of demand (tachyarrhythmia, sepsis, significant increase in afterload), usually in combination with limited ability to increase coronary flow (presence of fixed coronary narrowing due to preexisting coronary artery disease, vasoconstriction due to medication, hypotension, severe anemia, etc.). This may occur even without formation of blood clots on ruptured atherosclerotic plaques.
Obviously, patients with severe ischemia leading to ongoing myocardial necrosis should be rapidly diagnosed, as these patients may benefit from urgent reperfusion therapy (preferentially by primary percutaneous coronary intervention; p‐PCI). On the other hand, most patients with incomplete occlusion of the coronary artery may be stabilized first with medical therapy before a decision is made to refer them for coronary angiography and revascularization.
ACUTE MYOCARDIAL ISCHEMIA AND THE ECG
Acute myocardial ischemia may affect all components of the electrical activation of the heart, including the P wave, the PR interval, the QRS complex, the ST segment, and the T and U waves. The most dramatic ECG manifestation of acute transmural myocardial ischemia is ST‐segment elevation (STE) in the leads facing the ischemic zone and ST‐segment depression (STD) in the leads facing to the anatomically opposite myocardial segments (Fig. 1). On the other hand, subendocardial ischemia may cause STD in the ECG leads facing the involved zone. It is also evident that the ECG may be normal or only show minor changes, especially if the patient is asymptomatic when the ECG is recorded. Indeed, the Fibrinolytic Therapy Trialists’ (FTT) Collaborative Group, analyzing 58,600 patients with suspected AMI, who were randomized to fibrinolytic therapy versus control in 9 randomized trials, concluded that fibrinolytic therapy was beneficial only in patients, presented within 12 hours of onset of symptoms, whose presenting ECG showed STE or bundle branch block.1 By definition, “prolonged new STE (e.g., >20 minutes), particularly when associated with reciprocal STD, usually reflects acute coronary occlusion and results in myocardial injury with necrosis.”2 This and other data have led to the paradigm that STE on the presenting ECG in patients with compatible symptoms represents “ongoing transmural myocardial ischemia” mandating urgent reperfusion therapy, whereas patients without STE can be treated, at least initially, with more conservative approach, unless they are hemodynamically unstable. Therefore, together with focused history and physical examination, the ECG has gained a crucial role in the initial assessment and triage of patients with symptoms compatible with chest pain. Current guidelines recommend that an ECG should be performed and interpreted by an experienced physician within 10 minutes of Emergency Department arrival.3 Moreover, prehospital transmission (or interpretation) of the ECG is encouraged to reduce the time from first medical contact to reperfusion therapy (activation of the catheterization laboratory before the patient arrives to the hospital). In the most recent European guidelines, the authors point out that some patients with acute coronary occlusion may have an initial ECG without STE.4 They recommended repeated ECG recordings or monitoring of the ST segment, and also, the use of additional posterior chest wall leads V7–V9 leads.
Figure 1.
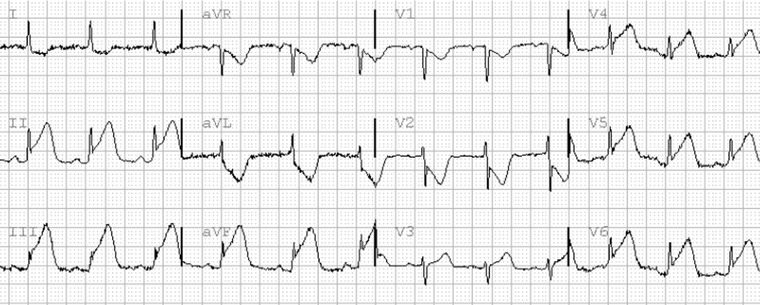
Inferior and lateral STE‐ACS. There is ST elevation in the leads II, III, aVF, and V4–V6. Leads I and aVL show reciprocal ST depression. ST elevation in leads V1–V2 represents lateral “mirror‐image” ST deviation. There is Sclarovsky–Birnbaum grade III of ischemia in leads III, aVF, and V6.
However, it should be remembered that we should identify and treat “ongoing transmural myocardial ischemia” that usually manifests as STE and not the ST segment per se. Many individuals have some degree of STE at baseline without having acute myocardial ischemia. Conditions other than acute myocardial ischemia may cause dynamic ST changes. Moreover, persons with baseline nonischemic STE may present with chest pain; some will be diagnosed with noncardiac pain, some will end up with non‐STE acute coronary syndrome (NSTE‐ACS) and some with STE‐ACS. The guidelines have set thresholds for STE based on epidemiological studies. As a large number of healthy persons (especially young males) have mild STE in leads V2–V3, a cutoff of 0.25 mV in men <40 years, 0.2 mV for men ≥40 years, and ≥0.15 mV in women in these leads was recommended.2 For all other leads, the cut‐point is 0.1 mV. The authors point out that the ECG by itself is usually insufficient to diagnose acute myocardial ischemia or infarction, since ST deviation may be observed in other conditions, such as left ventricular hypertrophy or left bundle branch block (LBBB). Indeed, nonischemic STE of more than 0.2 mV is common in leads V2–V3 in both left ventricular hypertrophy and LBBB. To raise the suspicion of STE‐ACS, STE above the threshold should be seen in at least two adjacent ECG leads. However, it should be emphasized that a large number of patients may have STE above this threshold without having acute STE‐ACS, while acute ongoing transmural ischemia due to an abrupt occlusion of an epicardial coronary artery may occur in patients with STE less than the accepted thresholds. This may be the case with small QRS complexes in the affected leads, especially in inferior STE‐ACS, with myocardial protection due to preconditioning or residual collateral circulation, etc. New or presumably new LBBB has been considered an ST‐segment elevation myocardial infarction (STEMI) equivalent, but most cases of LBBB at time of presentation are “not known to be old” because no prior electrocardiogram (ECG) is available for comparison. According to recent guidelines, new or presumably new LBBB at presentation is usually not caused by acute epicardial coronary occlusion, may interfere with STE analysis, and should not be considered diagnostic of STEMI‐equivalent in isolation.3
The differential diagnosis of nonischemic STE is diverse (Table 1).5, 6 In many instances, typical ECG patterns can easily be recognized by an experienced electrocardiographer, such as prominent J‐points with STE in the lateral leads (Fig. 2)—a pattern typical for early repolarization—or diffuse STE with STD in leads aVR and V1 and depression of the PR segment, a pattern compatible with acute pericarditis (Fig. 3). However, in many other instances there might be more than one explanation for the STE and precise diagnosis on presentation cannot be done. For example, hypertension is a known risk factor for coronary artery disease. Long‐term hypertension could induce left ventricular hypertrophy with STE in leads V1–V3 (Fig. 4). However, patients with ECG signs of left ventricular hypertrophy may present with anterior STEMI. It is commonly believed that comparison to previous ECG tracing will enable making the right diagnosis. However, in many instances nonischemic STE also shows dynamic changes. For example, STE due to early repolarization may not be seen at fast heart rate or after hyperventilation, STE due to a ventricular aneurysm increases with faster heart rate, etc. In these cases, the clinician may rely on the history and physical examination or order a transthoracic echocardiogram to facilitate the decision whether to proceed with acute reperfusion therapy.
Table 1.
Common Patterns of Nonischemic ST Elevation
| STE secondary to left ventricular hypertrophy (LVH) | |
| STE secondary to conduction defect (left bundle branch block and nonspecific intraventricular conduction delay (IVCD) | |
| Early repolarization pattern (notched J‐point mainly in anterolateral leads) | |
| Normal variant of STE (nonischemic ST elevation mainly V2–V3) | |
| Concave STE | |
| Old myocardial infarction/aneurysm | |
| Spontaneously reperfused myocardial infarction | |
| Pericarditis | |
| Brugada syndrome | |
| Wolf‐Parkinson‐White syndrome (preexcitation) | |
| Takotsubo cardiomyopathy (apical ballooning syndrome) | |
| Hypercalcemia | |
| Hyperkalemia |
Figure 2.
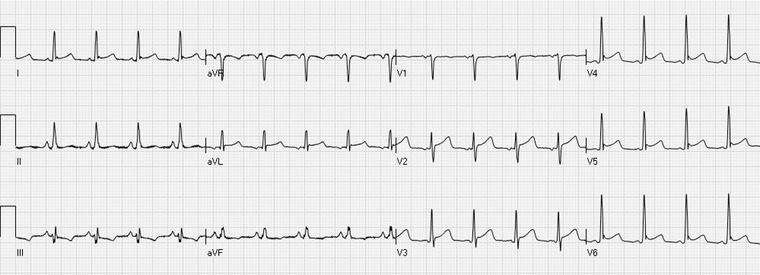
The early repolarization pattern with J‐point and ST‐segment elevations in the leads I, aVL, and V4–V6.
Figure 3.
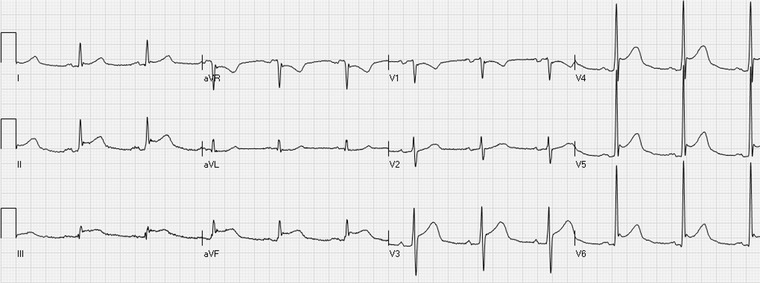
Acute pericarditis with ST elevation in the leads I, II, III, aVF, V3–V6 with ST depression in aVR and V1. PR‐segment depression in the leads aVF and V4–V6 and PR‐segment elevation in lead aVR is also typical of pericarditis.
Figure 4.
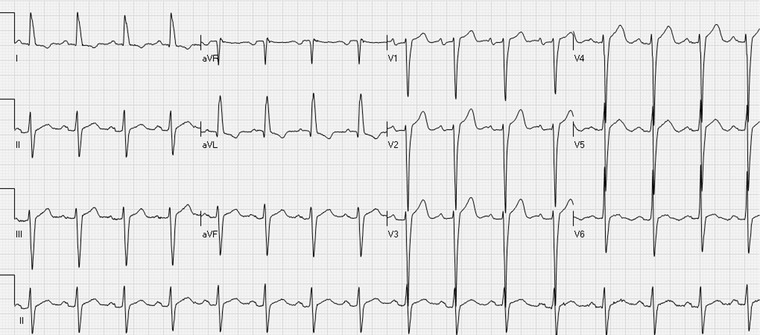
The ECG shows ST elevation in the inferior and precordial leads, most prominently in the leads V1–V4. Deep S waves in the leads V1–V4 and a high R waves in I and aVL indicate left ventricular hypertrophy.
The reported percentage of patients with false activation of the p‐PCI protocol because of nonischemic STE varies from 14% to over 40%,5, 7, 8, 9 although it has recently been suggested that a <5% rate of inappropriate p‐PCI activation represents a reasonable goal.10 It seems that this percentage is highly dependent on the prevalence of abnormal baseline ECGs in the population served by the individual medical center. It has to be also remembered that not all patients with positive cardiac markers who present with STE and found to have angiographically proven coronary artery disease, even with significant stenosis, have true STE‐ACS. Some may have NSTE‐ACS with baseline nonischemic STE, so‐called “pseudo‐STEMI.”11 In adjudicated true STE‐ACS, the pattern of ST‐segment deviation should be compatible with the site of occlusion of the coronary artery and resolution of the ECG changes is expected if timely reperfusion therapy is successful. Aborted STEMI adds to the confusion: if the coronary artery occlusion recanalizes rapidly, either spontaneously or with reperfusion therapy, even transmural ischemia due to complete occlusion of an epicardial artery may resolve without (significant) elevation of cardiac markers.12 Stress‐induced (takotsubo) cardiomyopathy may present with STE, fulfilling reperfusion criteria, on the 12‐lead ECG. By definition, these patients have neither significant culprit artery stenosis nor intracoronary thrombi. However, preexisting coronary artery disease does not exclude the possibility of stress‐induced cardiomyopathy in an individual patient, resulting in differential diagnostic challenges.4
ST‐ELEVATION ACUTE CORONARY SYNDROME
Acute transmural ischemia may affect the QRS‐complex, the ST‐segment, and the T‐wave morphology. The pattern of ECG changes enables the reader to estimate the site of coronary artery occlusion, the size and extent of the ischemic area at risk, the severity of ischemia, and prognosis.11, 13, 14, 15
Changes in the Initial Portion of the QRS
In the chronic phase of myocardial infarction, Q waves are regarded as a sign of irreversible necrosis. However, about 50% of patients presenting within 1 hour of onset of STE‐ACS already have Q waves in the leads with STE, especially in the anterior leads.14 These Q waves may be transient and not necessarily represent irreversible damage. It is believed that intense ischemia may cause a transient loss of electrical activity in the region at risk (“myocardial concussion”). Thus, Q waves on presentation may reflect either irreversible damage and/or a large ischemic zone, and thus portend a large final infarction.14 On the other hand, in inferior STE‐ACS preexisting Q waves may disappear during acute ischemia—the Q waves may be “pulled up” by the injury current—and reappear during reperfusion.14
Changes in the Terminal Portion of the QRS
Severe transmural ischemia affects the terminal portion of the QRS. This is manifested as reduction or abolition of the S wave in leads with terminal S wave and a J/R wave ratio of 50% or more in leads with terminal R‐wave configuration (Fig. 1).11, 14 Patients with significant terminal QRS distortion (Sclarovsky–Birnbaum grade III of ischemia) have more severe ischemia, less myocardial salvage despite successful recanalization of the epicardial coronary arteries and poorer prognosis, compared to patients with STE‐ACS without terminal QRS distortion (Sclarovsky–Birnbaum grade II).16, 17
ST Segment Deviation
STE in leads facing the ischemic zone is the most recognized manifestation of acute transmural ischemia. Ischemia due to left anterior descending (LAD) coronary artery occlusion usually induces STE in the precordial leads, mainly in leads V2–V4. In anterior STEMI, concomitant STE in leads I and aVL and/or STD in the inferior leads (II, III, and aVF) points to occlusion of the LAD proximal to the first diagonal branch. 11 However, the sensitivity of this sign is low, as in many cases with a long, wrapping LAD, concomitant inferior wall ischemia tends to oppose the changes in leads I and aVL and cancel ST deviation in these and the inferior leads.11
Both dominant left circumflex (LCx) and right coronary artery (RCA) occlusion usually results in STE in the inferior leads. Usually there is reciprocal STD in lead aVL. However, in cases with LCx occlusion proximal to the first obtuse marginal branch, concomitant ischemia of the high lateral zone may lead to cancellation of STD in aVL or even to STE in this lead.11 Involvement of the lateral zone may lead to STD in leads V1–V3/V4 (Fig. 5). This is seen in infarction due to LCx or mid to distal RCA occlusion.11 Right ventricular involvement due to proximal RCA occlusion may cause STE in lead V1, attenuation of STD in leads V2–V3 and results in STE in the right‐sided precordial leads V3R and V4R.11 In relatively rare cases of AMI limited to the lateral zone, there may be minimal or no STE in the inferior leads and the ECG manifestation of ischemia will be reciprocal STD in leads V1–V3.11 In many patients, recording leads V7–V9 (posterior chest leads) may reveal STE. According to the guidelines, patients presenting with STD in leads V1–V3 4 or V1–V4 3 should be considered as having STE‐ACS equivalent and referred for emergent revascularization. However, confusion still exists concerning this pattern. According to the Universal definition of MI, “STD in leads V1–V3 may be suggestive of inferobasal myocardial ischaemia (posterior infarction), especially when the terminal T wave is positive (ST elevation equivalent), however this is nonspecific.”2 However, it has been recently shown that in these cases, the infarction is localized to the lateral segments, and not to the basal inferior segment.18 Therefore the term “lateral” STEMI is more appropriate and it confirms with the Universal Definitions of the LV segments.19 However, the mirror image of the acute phase of STE‐ACS (STE with positive T waves) is STD with negative T waves; thus early on most cases present with STD and negative T waves.20 It is unclear whether in cases with STD extending beyond lead V4 (V5–V6) true lateral STE‐ACS equivalent can be excluded. Moreover, in patients with right bundle branch block (RBBB), STD in leads V1–V3 is common. There are no criteria how to diagnosed or exclude acute lateral STE‐ACS equivalent in patients with complete or incomplete RBBB.
Figure 5.
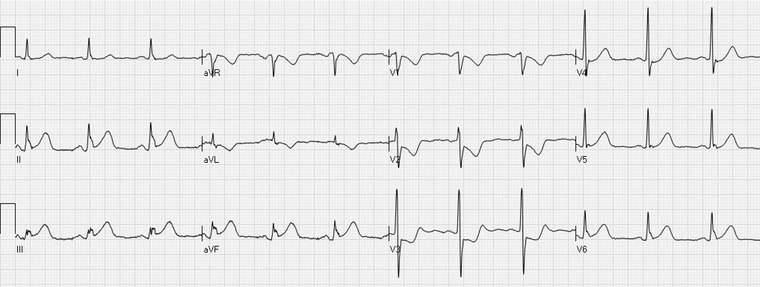
Inferior STE‐ACS. There is ST elevation in the leads II, III, and aVF and reciprocal ST depression in the lead aVL. ST depression in the leads V1–V4 indicates involvement of the lateral segment of the left ventricle.
Although it is commonly taught that the absolute sum of or the number of leads with STE correlates with the size of the ischemic area at risk, this is not always the truth. It should be remembered that the various ECG leads record the vector of the global activation of the heart toward and away of the electrode and not local events. Concomitant ischemia of opposing segments may lead to cancellation of ST deviation in leads facing these segments. For example, occlusion of a short LAD before the first diagonal branch will cause STE in leads I and aVL. However, due to concomitant ischemia of the inferior segments in patients with proximal occlusion of a wrapping LAD (that may cause STD in leads I and aVL), STE may not be present in these leads.11, 14
Changes in the T and U Waves
The first ECG manifestation of acute transmural ischemia is an increase in the amplitude of the T waves.21 In most cases, this change is rapidly followed by STE.15 However, a small percentage of patients may not develop significant ST‐segment deviation. This pattern is seen in patients with chronic subtotal occlusion of the artery who have developed rich collateral circulation.22 The pattern is difficult to recognize, as there are large variations in the amplitude of the T waves in the various leads among normal patients. Moreover, factors other than ischemia (for example, serum potassium) affect the T‐wave amplitude. Occasionally, by comparing to previous ECGs tall peaked T waves can be recognized in a patient with compatible symptoms. It should be remembered that isolated tall peaked T waves without STE is not considered as an indication for emergent reperfusion therapy.
Occasionally patients present with STE and inversion of the terminal portion of the T waves. The significance of this pattern is unclear. Early inversion of the terminal part of the T waves, along with a decrease in STE, is considered as an ECG sign of reperfusion.14, 23 However, it is unclear whether one can assume that the culprit artery is already recanalized in patients presenting with STE and negative T waves and not send the patient for emergent reperfusion therapy. It should be remembered that the guidelines recommend emergent reperfusion therapy in all patients with compatible symptoms that started within 12 hours of presentation (whether or not symptoms have resolved) who have STE (the morphology of the T waves is not mentioned).3, 4
Inversion of the U waves may also be detected during acute ischemia. However, these changes are not so prominent and it is unclear whether they can be used to guide therapy.
NON‐ST ELEVATION ACUTE CORONARY SYNDROME
As abovementioned, in many patients with NSTE‐ACS, ischemia is intermittent. By the time of presentation many patients do not have ongoing active ischemia. Therefore, in many patients the ECG changes are minimal or reflect a reperfusion state (inversion of the terminal portion of the T waves or nonspecific T changes without significant ST‐segment deviation). However, during active ischemia, ECG changes, including ST‐segment deviation and changes in the T‐ and U‐wave morphology may be detected. Therefore, it is important to note whether the ECG was recorded while the patient was asymptomatic or symptomatic. Serial ECG recording during symptoms and after their resolution may reveal subtle changes that otherwise could not be recognized.
Acute subendocardial ischemia due to partial reduction of flow and/or increase of demand causes STD in the leads facing the involved zone. Some clinicians tend to present the 12‐lead ECG as 24‐leads, adding the mirror image of each conventional lead.24 With this approach any STD can be depicted as STE. However, this does not transform the patient into having STE‐ACS, as STE‐ACS is a paradigm of an occlusion of an epicardial coronary artery with ongoing transmural ischemia (see above). It is yet to be shown whether emergent reperfusion therapy is beneficial and cost‐effective in patients with isolated STE in the mirror leads (isolated STD in the conventional leads).
Acute subendocardial ischemia also affects the T‐wave morphology. STD with tall peaked positive T waves is now being recognized as a sign of regional subendocardial ischemia.15, 25, 26 The European STEMI guidelines recommend repeat ECGs or STE monitoring in patients with (prominent) hyper‐acute T waves, which may precede STE.4 On the other hand, it seems that STD in the anterolateral leads (V4–V6) along with negative T waves is associated with worse prognosis than STD with positive T waves in these leads.27
It has been suggested that the morphology of the T wave may assist in differentiating between anterior subendocardial ischemia (due to subtotal LAD occlusion) and lateral transmural ischemia (due to LCx or RCA occlusion) (Fig. 6). However, it should be remembered that T‐wave morphology changes over time and with reperfusion. In many instances the T wave is biphasic (either above the isoelectric line initially with terminal negative portion or initially negative with terminal positive deflection). Different investigators used different definitions for positive or negative T waves, some used the area under the curve to define whether it is positive or negative and some concentrated on the terminal part of the T wave. Also, many authors did not describe their definition of the T wave.
Figure 6.
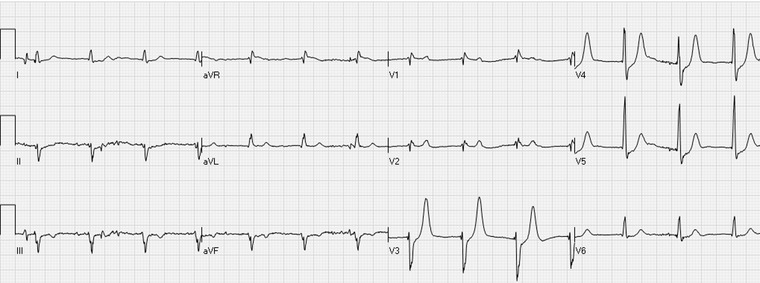
Up‐sloping ST depressions in the leads V3–V5 with prominent, positive T waves. The patient had an occluded left circumflex coronary artery.
Several distinct ECG patterns seen in patients with NSTE‐ACS have been characterized:
-
T‐wave inversion with isoelectric ST segments or minor ST deviation: Overall, in NSTE‐ACS, isolated T‐wave inversion is not considered an ominous sign. Flat/ mild isolated T‐wave inversion, especially in leads with prominent R waves, is usually seen after symptoms resolve and is considered a sign of reperfusion.
It is well documented, that in ACS patients, who present with deep isolated T‐wave inversion in V1 to V3/V4 (the “Wellens’ sign”), a critical stenosis of the LAD coronary artery is found on angiography28 (Fig. 7). By definition, these cases are considered as NSTE‐ACS, but in fact they typically represent an evolutionary pattern of STEMI with spontaneous or therapy‐induced ST resolution. Guidelines do not recommend immediate invasive evaluation of these patients.15, 28 However, these cases have to be controlled carefully, because even though this pattern is seen mainly after symptoms resolve, reocclusion may occur with the appearance of positive T waves or even STE Thus, this pattern (deep negative T wave in V1 to V3–V4), may be potentially considered as a “spontaneously reperfused” anterior STE‐ACS. Nevertheless, currently there is no indication for instituting reperfusion therapy within 60 minutes of arrival, as for classical STE‐ACS.
Up‐sloping STD with positive tall T waves: Up‐sloping STD with positive T waves is commonly seen in persons during tachycardia, even in persons without coronary artery disease and is usually not considered as indicative of myocardial ischemia. However, the same pattern may be seen in patients with NSTE‐ACS at slower heart rates and is increasingly recognized as a sign of regional subendocardial ischemia.25 It has been suggested that when present in the precordial leads, this pattern points to subtotal or total occlusion of the LAD with resulting subendocardial ischemia.26 However, a similar pattern has been described in patients with LCx lesions (Fig. 6).15 It should be remembered that this pattern may be unstable and may evolve to STE if the culprit artery progresses from subtotal to total occlusion or if there are changes in the collateral circulation.29 As patients with ACS might present with reactive tachycardia, and ischemia can be induced because of tachycardia, differentiation between a “normal” up‐sloping STD secondary to tachycardia and regional subendocardial ischemia is important. However, a threshold for heart rate to distinguish between these two entities has not been set.
Diffuse STD in the inferior and anterolateral leads associated with ST elevation in lead aVR: Widespread STD in ≥6 leads, often associated with inverted T waves and STE in lead aVR during episodes of chest pain is a manifestation of diffuse subendocardial ischemia caused by left main‐, left main equivalent‐, or severe three vessel disease‐ related ischemia (Fig. 8).15 The ECG may be normal or show only T‐wave inversion when the patient is asymptomatic. These patients are at extremely high risk for developing cardiogenic shock and/or ventricular fibrillation and urgent coronary angiography has been increasingly recommended for these patients.15 In the guidelines, “left main coronary obstruction—lead aVR STE and lateral STD,” is defined as STD >0.1 mV in 8 or more surface leads coupled with STE in aVR and/or V1 in an otherwise unremarkable ECG. The authors state that this ECG pattern suggests ischemia due to multivessel or left main coronary obstruction, particularly if the patient presents with hemodynamic compromise. When diffuse STD is present, but the T waves are positive, the prognosis is less ominous.15, 25, 27, 30, 31 A similar pattern of diffuse STD with STE in lead aVR is often seen in patients with left ventricular hypertrophy with repolarization change and in patients with cardiomyopathy or intraventricular conduction defects (Fig. 9). In these patients, the ECG is abnormal at baseline; however, with tachycardia or elevated afterload, the magnitude of ST deviation may increase. The usefulness of this pattern for predicting left main, left main equivalent acute ischemia in patients with abnormal baseline ECG has not been established. Some authors have suggested not loading patients presenting with this particular ECG pattern with P2Y12 adenosine diphosphate‐receptor antagonists before coronary angiography, as a large number of these patients may need urgent coronary artery bypass surgery.
Figure 7.
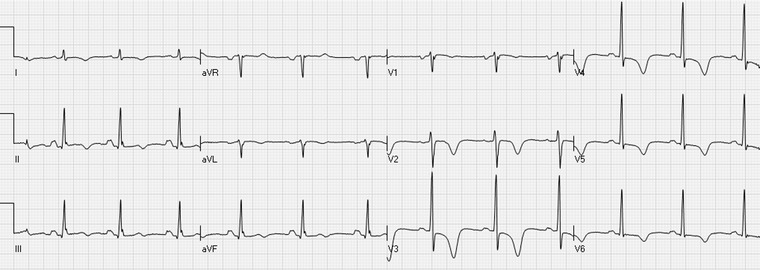
The “Wellens’ sign”: inverted T waves in the precordial leads, maximally in V3–V4. Also leads I, II, and aVF show T‐wave inversions.
Figure 8.
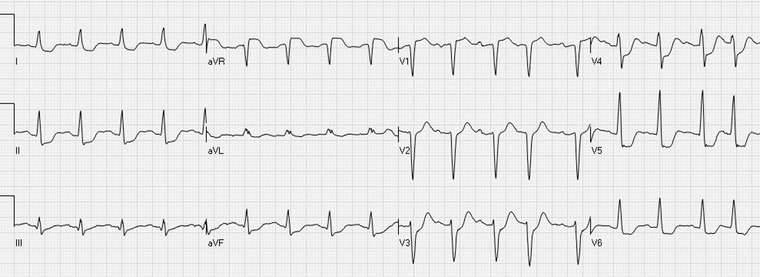
Circumferential subendocardial ischemia: widespread (≥6 leads) ST depressions with inverted T waves maximally in leads V4–V5 and ST elevation in the lead aVR.
Figure 9.
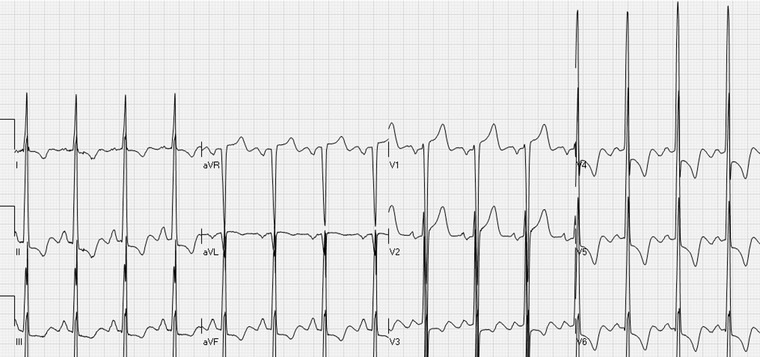
ST elevations in the leads V1–V2 and aVR with widespread ST depressions. ECG signs of left ventricular hypertrophy: deep S waves in the right and high R waves in the left precordial leads and in leads I, II, III, and aVF.
In conclusion, the ECG gives snapshot information about the electrical activation of the heart, which may be affected by active ischemia. Thus, ECG interpretation provides indirect information about the presence, extent, and severity of myocardial ischemia. At times, the changes are typical and clear. In other instances, changes are subtle and might be recognized only when ECG recording is repeated after changes in the severity of symptoms (worsening or resolution of symptoms). ECG interpretation is an essential part of the initial evaluation of patients with symptoms suspected to be related to myocardial ischemia (pain, shortness of breath, dizziness, etc.), along with focused history and physical examination. Availability of prior ECG tracing and repeated ECG enhances the accuracy of reading. Patients with compatible symptoms and STE should be referred for emergent reperfusion therapy (preferentially by primary PCI). On the other hand, certain patterns of NSTE‐ACS may indicate high‐risk and more aggressive approach.
REFERENCES
- 1. Fibrinolytic Therapy Trialists’ (FTT) Collaborative Group . Indications for fibrinolytic therapy in suspected acute myocardial infarction: Collaborative overview of early mortality and major morbidity results from all randomised trials of more than 1000 patients. Lancet 1994;343:311–322. [PubMed] [Google Scholar]
- 2. Thygesen K, Alpert JS, Jaffe AS, et al. Third universal definition of myocardial infarction. J Am Coll Cardiol 2012;60:1581–1598. [DOI] [PubMed] [Google Scholar]
- 3. O'Gara PT, Kushner FG, Ascheim DD, et al. 2013 ACCF/AHA guideline for the management of ST‐elevation myocardial infarction: A report of the american college of cardiology Foundation/American heart association task force on practice guidelines. Circulation 2013;127:e362–425. [DOI] [PubMed] [Google Scholar]
- 4. Task Force on the management of ST‐segment elevation acute myocardial infarction of the European Society of Cardiology (ESC) , Steg PG, James SK, et al. ESC guidelines for the management of acute myocardial infarction in patients presenting with ST‐segment elevation. Eur Heart J 2012;33:2569–2619. [DOI] [PubMed] [Google Scholar]
- 5. Huang HD, Birnbaum Y. ST elevation: Differentiation between ST elevation myocardial infarction and nonischemic ST elevation. J Electrocardiol 2011;44:494.e1,494.e12. [DOI] [PubMed] [Google Scholar]
- 6. Wang K, Asinger RW, Marriott HJ. ST‐segment elevation in conditions other than acute myocardial infarction. N Engl J Med 2003;349:2128–2135. [DOI] [PubMed] [Google Scholar]
- 7. Larson DM, Menssen KM, Sharkey SW, et al. “False‐positive” cardiac catheterization laboratory activation among patients with suspected ST‐segment elevation myocardial infarction. JAMA 2007;298:2754–2760. [DOI] [PubMed] [Google Scholar]
- 8. Sejersten M, Sillesen M, Hansen PR, et al. Effect on treatment delay of prehospital teletransmission of 12‐lead electrocardiogram to a cardiologist for immediate triage and direct referral of patients with ST‐segment elevation acute myocardial infarction to primary percutaneous coronary intervention. Am J Cardiol 2008;101:941–946. [DOI] [PubMed] [Google Scholar]
- 9. Tran V, Huang HD, Diez JG, et al. Differentiating ST‐elevation myocardial infarction from nonischemic ST‐elevation in patients with chest pain. Am J Cardiol 2011;108:1096–1101. [DOI] [PubMed] [Google Scholar]
- 10. Rokos IC, French WJ, Mattu A, et al. Appropriate cardiac cath lab activation: Optimizing electrocardiogram interpretation and clinical decision‐making for acute ST‐elevation myocardial infarction. Am Heart J 2010;160:995–1003. [DOI] [PubMed] [Google Scholar]
- 11. Atar S, Barbagelata A, Birnbaum Y. Electrocardiographic diagnosis of ST‐elevation myocardial infarction. Cardiol Clin 2006;24:343–365. [DOI] [PubMed] [Google Scholar]
- 12. Dowdy L, Wagner GS, Birnbaum Y, et al. Aborted infarction: The ultimate myocardial salvage. Am Heart J 2004;147:390–394. [DOI] [PubMed] [Google Scholar]
- 13. Bayes de Luna A, Wagner G, Birnbaum Y, et al. A new terminology for left ventricular walls and location of myocardial infarcts that present Q wave based on the standard of cardiac magnetic resonance imaging: A statement for healthcare professionals from a committee appointed by the international society for holter and noninvasive electrocardiography. Circulation 2006;114:1755–1760. [DOI] [PubMed] [Google Scholar]
- 14. Birnbaum Y, Ware DL. Electrocardiogram of acute ST‐elevation myocardial infarction: The significance of the various “scores.” J Electrocardiol 2005;38:113–118. [DOI] [PubMed] [Google Scholar]
- 15. Nikus K, Pahlm O, Wagner G, et al. Electrocardiographic classification of acute coronary syndromes: A review by a committee of the international society for holter and non‐invasive electrocardiology. J Electrocardiol 2010;43:91–103. [DOI] [PubMed] [Google Scholar]
- 16. Billgren T, Birnbaum Y, Sgarbossa EB, et al. Refinement and interobserver agreement for the electrocardiographic Sclarovsky‐Birnbaum ischemia grading system. J Electrocardiol 2004;37:149–156. [DOI] [PubMed] [Google Scholar]
- 17. Sejersten M, Birnbaum Y, Ripa RS, et al. Influences of electrocardiographic ischaemia grades and symptom duration on outcomes in patients with acute myocardial infarction treated with thrombolysis versus primary percutaneous coronary intervention: Results from the DANAMI‐2 trial. Heart 2006;92:1577–1582. [DOI] [PMC free article] [PubMed] [Google Scholar]
- 18. Cino JM, Pujadas S, Carreras F, et al. Utility of contrast‐enhanced cardiovascular magnetic resonance (CE‐CMR) to assess how likely is an infarct to produce a typical ECG pattern. J Cardiovasc Magn Reson 2006;8:335–344. [DOI] [PubMed] [Google Scholar]
- 19. Cerqueira MD, Weissman NJ, Dilsizian V, et al. Standardized myocardial segmentation and nomenclature for tomographic imaging of the heart. A statement for healthcare professionals from the cardiac imaging committee of the council on clinical cardiology of the american heart association. Circulation 2002;105:539–542. [DOI] [PubMed] [Google Scholar]
- 20. Porter A, Vaturi M, Adler Y, et al. Are there differences among patients with inferior acute myocardial infarction with ST depression in leads V2 and V3 and positive versus negative T waves in these leads on admission? Cardiology 1998;90:295–298. [DOI] [PubMed] [Google Scholar]
- 21. Dressler W, Roesler H. High T waves in the earliest stage of myocardial infarction. Am Heart J 1947;34:627–646. [DOI] [PubMed] [Google Scholar]
- 22. Sagie A, Sclarovsky S, Strasberg B, et al. Acute anterior wall myocardial infarction presenting with positive T waves and without ST segment shift. electrocardiographic features and angiographic correlation. Chest 1989;95:1211–1215. [DOI] [PubMed] [Google Scholar]
- 23. Atar S, Barbagelata A, Birnbaum Y. Electrocardiographic markers of reperfusion in ST‐elevation myocardial infarction. Cardiol Clin 2006;24:367–376. [DOI] [PubMed] [Google Scholar]
- 24. Wagner GS, Pahlm‐Webb U, Pahlm O. Use of the 24‐lead “standard” electrocardiogram to identify the site of acute coronary occlusion. A review paper. J Electrocardiol 2008;41:238–244. [DOI] [PubMed] [Google Scholar]
- 25. Sclarovsky S, Rechavia E, Strasberg B, et al. Unstable angina: ST segment depression with positive versus negative T wave deflections–clinical course, ECG evolution, and angiographic correlation. Am Heart J 1988;116:933–941. [DOI] [PubMed] [Google Scholar]
- 26. Verouden NJ, Koch KT, Peters RJ, et al. Persistent precordial “hyperacute” T‐waves signify proximal left anterior descending artery occlusion. Heart 2009;95:1701–1706. [DOI] [PubMed] [Google Scholar]
- 27. Atar S, Fu Y, Wagner GS, et al. Usefulness of ST depression with T‐wave inversion in leads V(4) to V(6) for predicting one‐year mortality in non‐ST‐elevation acute coronary syndrome (from the electrocardiographic analysis of the global use of strategies to open occluded coronary arteries IIB trial). Am J Cardiol 2007;99:934–938. [DOI] [PubMed] [Google Scholar]
- 28. de Zwaan C, Bar FW, Wellens HJ. Characteristic electrocardiographic pattern indicating a critical stenosis high in left anterior descending coronary artery in patients admitted because of impending myocardial infarction. Am Heart J 1982;103:730–736. [DOI] [PubMed] [Google Scholar]
- 29. Birnbaum Y, Zhou S, Wagner GS. New considerations of ST segment “elevation” and “depression” and accompanying T wave configuration in acute coronary syndromes. J Electrocardiol 2011;44:1–6. [DOI] [PubMed] [Google Scholar]
- 30. Nikus KC, Eskola MJ, Virtanen VK, et al. ST‐depression with negative T waves in leads V4‐V5–a marker of severe coronary artery disease in non‐ST elevation acute coronary syndrome: A prospective study of angina at rest, with troponin, clinical, electrocardiographic, and angiographic correlation. Ann Noninvasive Electrocardiol 2004;9:207–214. [DOI] [PMC free article] [PubMed] [Google Scholar]
- 31. Nikus KC, Sclarovsky S, Huhtala H, et al. Electrocardiographic presentation of global ischemia in acute coronary syndrome predicts poor outcome. Ann Med 2012;44:494–502. [DOI] [PubMed] [Google Scholar]


