Abstract
Background
We analyzed ventricular repolarization variability in genotyped long QT syndrome (LQTS) patients and in healthy volunteers (HV).
Method
The deltaT50, that is, the temporal variability of ventricular repolarization at 50% of the T‐wave downslope, was analyzed every 15th minute on 175 and 390 Holter electrocardiogram (ECG) recordings from HV and genotyped LQTS patients, respectively. The average deltaT50 and QTcF were calculated in each subject.
Results
DeltaT50 was 2.26 ± 0.71 ms (mean ± SD) in the HV and 5.74 ± 2.30 ms in the LQTS population (P < 0.0001). The sensitivity and specificity of QTcF (cutoff value 450 ms) to discriminate between the LQTS patients and the HV were 51.5% and 98.9%, and for deltaT50 (cutoff value 3 ms) 93.9% and 88.6%, respectively. The combination of both variables improved the diagnosis of the LQTS patients even further. Subgroups of LQTS patients at higher risk of cardiac events (with LQTS3, JLN, QTc > 500 ms or symptoms) had higher deltaT50 than subgroups at lower risk (with LQTS1, QTc < 450 ms or without symptoms). The variation in deltaT50 between day and night was concordant with the risk of symptoms; patients with LQTS1 had higher deltaT50 in the daytime and patients with LQTS3 had higher deltaT50 during the night.
Conclusion
DeltaT50 more accurately distinguished between LQTS patients and HV than QTcF and was higher in LQTS patients with a higher risk of cardiac events. DeltaT50 can be used together with QTcF to improve the diagnosis in patients with the LQTS phenotype and tentatively also be of value for risk assessment in such patients.
Keywords: beat‐to‐beat, QT variability, long QT syndrome, automatic analysis, repolarization
Patients with congenital long QT syndrome (LQTS) have mutations in genes encoding for ion channel proteins of crucial importance for ventricular electrophysiology.1 In general, these mutations result in a reduced repolarization reserve associated with an increased risk of ventricular tachyarrhythmias, in particular torsades de pointes (TdP), manifesting as dizziness and/or syncope or deteriorating into ventricular fibrillation and sudden cardiac death. Treatment with beta‐blockers and restrictions regarding heavy exercise may reduce the risk of cardiac events in these patients, whereas treatment with repolarization‐delaying drugs has the opposite effect.2
Genetic testing is the ultimate diagnostic method for identifying potential mutations underlying the LQTS. However, the presence of a given mutation does not necessarily lead to symptoms and, therefore, the estimation of the risk of developing arrhythmias and symptoms should rather be based on the patient's clinical phenotype.2
The most accepted risk marker of cardiac events in LQTS patients is the presence of a QTc interval >500 ms.3 However, although a prolonged QT interval indicates that the patient does have a reduced repolarization reserve that is associated with the etiology of the disease, it is unspecific as in approximately 25% of the patients the QT interval falls within the normal range.4 In addition, the well‐known difficulty in defining the actual end of the T wave and the fact that the definition varies substantially between individuals makes the QT interval an unreliable diagnostic marker.5 Hence, alternative diagnostic markers are needed and several tentative methods based on characterization of the morphology of the electrocardiogram (ECG) complex6, 7, 8 or on the dynamics of the RR/QT relationship9, 10, 11, 12, 13, 14, 15, 16, 17 have been put forward or are under investigation.18
The primary aim of the present study was to investigate whether deltaT50 would discriminate LQTS patients from HV, particularly patients with QT intervals below 450 ms and, among these, patients without symptoms representing “silent mutation carriers.”3
METHODS
DeltaT50
The development and validation of the deltaT50 method was recently described elsewhere.19 The algorithm for deltaT50 was implemented in the EClysis software20 and measured the time from the intersection of the RS and isoelectric lines to 50% of the T‐wave downslope, that is, the T50 interval, on the single ECG complex. Noise reduction was achieved by using 21 points smoothing, and ECG complexes with a signal‐to‐noise ratio (SNR) of less than 10 were automatically excluded. Beats following a change in the RR interval of more than 150 ms were also excluded.19 The average absolute changes in the T50 interval, deltaT50, of at least 9 beat pairs (1 beat pair = 2 consecutive beats) were subsequently calculated with a precision of 1 ms.19 To exemplify, if deltaT50 was to be measured on 30 consecutive beats, a calculation was made of the average absolute change in the T50 interval of at least 9 beat pairs with an SNR more than 10 and with a change in the RR interval of less than 150 ms.
Study Population
ECGs were downloaded from the Telemetric and Holter ECG Warehouse (THEW, http://www.thew-project.org) of the University of Rochester, New York. There were single recordings from each of 202 healthy individuals and 465 recordings from 298 LQTS patients. The recordings consisted of two or three‐lead Holter ECGs sampled at 200 Hz with an intended duration of 24 hours. Of the 667 ECGs, 175 from the HV and 379 ECGs from 269 of the LQTS patients were analyzed. Analysis of deltaT50 was not possible in the remaining ECGs due to aberrant T‐wave morphology (biphasic or negative T waves), low amplitude and/or noise, too short a duration of the recording, no annotation of the starting time for the recording or atrial fibrillation.
The clinical information in the databases included age and gender and, for the LQTS patients, symptomatic status and beta‐blocker treatment at the time of the recording (Table 1). Symptoms were defined as syncope, malaise, TdP, or aborted cardiac arrest. Multiple ECGs (up to seven) were available in 70 LQTS patients, separated by shorter or longer time periods (days to several years).
Table 1.
Demographic Data for the ECGs Eligible for Analysis of DeltaT50
| Genotype | LQTS1 | LQTS2 | LQTS3 | JLN | HV |
|---|---|---|---|---|---|
| (Total no. of ECG files) | (246) | (145) | (35) | (39) | (202) |
| No. of analyzed ECGs | 217 | 114 | 31 | 28 | 175 |
| No. of subjects | 159 | 77 | 13 | 20 | 175 |
| Age, mean (range) | 27.3 | 23.3 | 15.3 | 19.6 | 37.6 |
| (0–77 years) | (3 months– | (1–48 years) | (10 months– | (12–80 years) | |
| 72 years) | 53 years) | ||||
| Male | 41% | 47% | 68% | 43% | 49% |
| Symptoms | 46% | 60% | 64% | 86% | NA |
| BB therapy | 37% | 48% | 61% | 50% | NA |
| Symptoms during BB therapy | 26% | 38% | 26% | 64% | NA |
BB = beta‐blocker.
Measurements
Every 15th minute of the continuous Holter recording, 1 minute of the recording was imported into EClysis. Of the first 30 beats of each 1‐minute recording, ECG complexes with a SNR of less than 10 or following a change in the preceding RR interval of more than 150 ms were excluded. Subsequently, deltaT50, T‐wave amplitude and SNR were calculated on the remaining 9–29 beat pairs. The average beat‐to‐beat change in the RR interval (delta RR), the average RR interval and the heart rate (HR) were calculated on all 30 beats. The QT interval was measured from the averaged ECG complex (including all 30 beats) by means of the tangent method (QTtang), and the QTcF interval was subsequently calculated according to Fridericia.20
The average of each variable was calculated for the measurements between 3 and 8 p.m. and 1 and 6 a.m., subsequently referred to as daytime and nighttime, respectively. The following sections present the results from the daytime measurements, unless otherwise specified.
Statistics
Linear regression was used to investigate the relationship between deltaT50 and QTcF, HR, deltaRR, T‐wave amplitude, SNR, and age. Student's t‐test was used for comparison of deltaT50 in different subgroups of subjects, and the paired t‐test was used to investigate the diurnal variation in deltaT50. A P‐value <0.05 was considered statistically significant. The sensitivity and specificity of QTcF and deltaT50 as diagnostic tests of the LQTS patients in the present study were determined for several cutoff values of both variables, and the receiver operating characteristics (ROC) were calculated for QTcF, deltaT50, and the combination of QTcF and deltaT50. Areas under the curves of the ROC were calculated to assess the predictive power of the variables.
RESULTS
DeltaT50 and QTcF in Healthy Volunteers and LQTS Patients
The average deltaT50 and QTcF were 2.26 ± 0.71 and 393 ± 20.3 ms in HV and 5.74 ± 2.30 and 461 ± 53.6 ms in the entire LQTS patient population (P < 0.0001 for both variables). The average QTcF and deltaT50 in the LQTS1, LQTS2, LQTS3, and Jervell Lange‐Nielsen (JLN) subgroups are listed in Table 2.
Table 2.
QTcF and DeltaT50 during the Day and at Night in the Healthy Volunteers (HV) and LQTS Patients in the Study
| QTcF(day), | QTcF(night), | DeltaT50(day), | DeltaT50(night), | |
|---|---|---|---|---|
| ms | ms | Ms | ms | |
| HV | 393 ± 20.3 | 408 ± 22.6 (P < 0.0001) | 2.26 ± 0.71 | 1.81 ± 0.93 (P < 0.0001) |
| LQTS1 | 454 ± 44.7 | 467 ± 40.0 (P < 0.0001) | 5.19 ± 2.12 | 4.58 ± 2.06 (P < 0.0001) |
| LQTS2 | 472 ± 56.4 | 513 ± 56.5 (P < 0.0001) | 6.59 ± 2.14 | 6.29 ± 2.48 (P = 0.52) |
| LQTS3 | 457 ± 44.9 | 502 ± 59.4 (P < 0.0001) | 5.89 ± 2.49 | 6.70 ± 2.95 (P = 0.009) |
| JLN | 482 ± 91.5 | 482 ± 75.0 (n.s.) | 6.45 ± 2.75 | 5.47 ± 2.08 (P = 0.0046) |
Shown are mean ± SD. The P values describe the comparisons between measurements during the day and at night.
The individual values of deltaT50 plotted against the corresponding QTcF intervals are shown in Figure 1A. Interindividual differences in deltaT50 could not be explained by differences in HR, deltaRR, T‐wave amplitude, SNR, or age (Figs. 2A–E).
Figure 1.
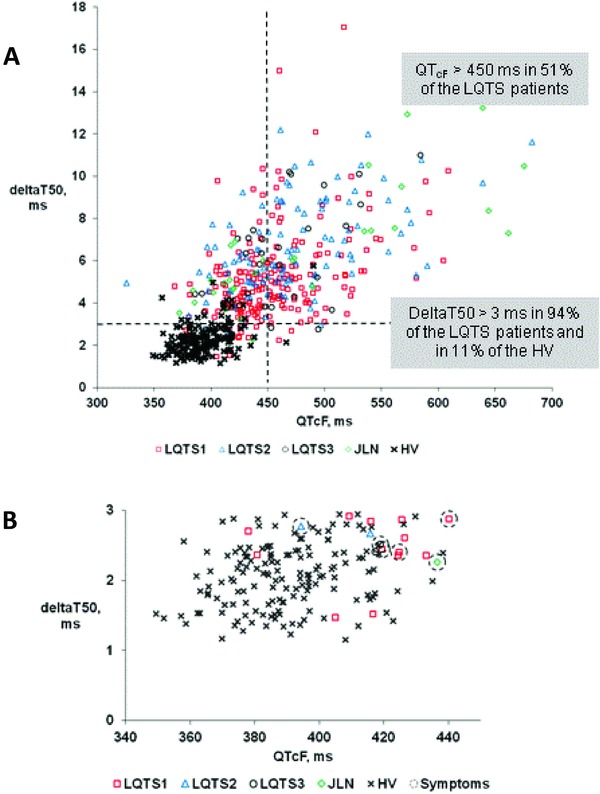
(A) Individual values of deltaT50 during the day versus corresponding values of QTcF in healthy volunteers (HV, filled circles) and in patients with different forms of long QT syndrome, LQTS1, LQTS2, LQTS3, and JLN. (B) The same values as in Panel A, but only for the HV and LQTS patients who had QTcF intervals <450 ms and deltaT50 <3 ms. ECGs annotated with symptoms are marked with a ring.
Figure 2.
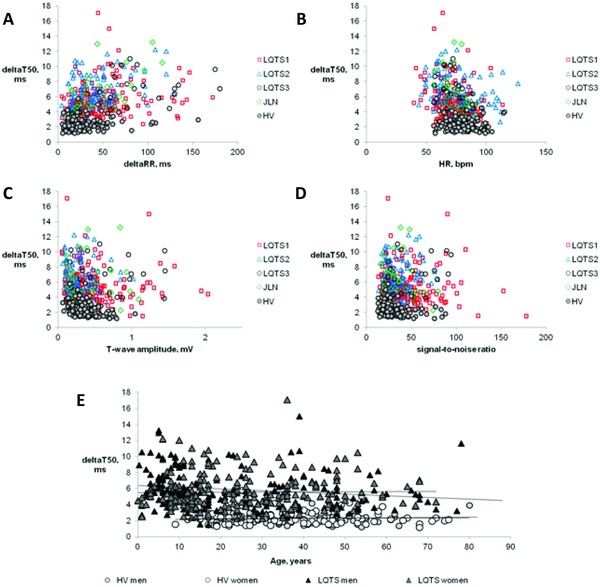
Individual values of deltaT50 during the day plotted versus the corresponding deltaRR interval (Panel A), heart rate (HR, Panel B), T‐wave amplitude (Panel C), and signal‐to‐noise ratio (Panel D) in healthy volunteers (HV) and patients with different types of long QT syndrome, LQTS1, LQTS2, LQTS3, and JLN. Panel E shows deltaT50 plotted against age for the male and female HV and male and female patients with LQTS, together with the regression lines for the respective group of subjects.
There was no statistically significant difference between healthy men and women (2.26 ± 0.65 vs 2.25 ± 0.77 ms). Among the LQTS patients, deltaT50 during the night was significantly higher in males than in females (5.66 ± 2.58 vs 5.04 ± 2.26 ms, P = 0.011). DeltaT50 was significantly higher for each genotype in the LQTS population only in male and not in female LQTS3 patients, and only at night (7.50 ± 2.72 vs 5.32 ± 2.66 ms, P = 0.033).
DeltaT50 measured repeatedly on several occasions in the individual LQTS patient varied irrespective of the presence of symptoms or of treatment with a beta‐blocker. To examine whether the intrasubject variability of deltaT50 was related to variations in QTcF, the largest difference in deltaT50 between measurements in each patient was plotted versus the corresponding difference in QTcF (Fig. 3). The analysis indicated that there was a weak positive correlation between changes in QTcF and deltaT50 but that only 11% of the change in deltaT50 could be explained by a change in QTcF (Fig. 3).
Figure 3.
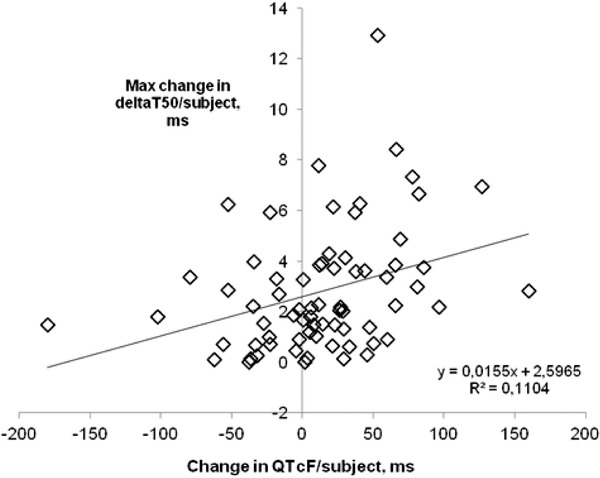
Maximum difference in deltaT50 between two recordings plotted against the corresponding difference in QTcF in LQTS patients with more than one ECG recording to examine the intraindividual correlation between deltaT50 and QTcF. There was a slight positive correlation between the two variables, but only 11% of the change in deltaT50 could be explained by a change in QTcF.
Diagnosis of LQTS Based on QTcF, DeltaT50, and the Combination of Both Variables
The area under the ROC for QTcF, deltaT50, and the combination of both variables as diagnostic tests for LQTS were 0.931, 0.968, and 0.976, respectively. Hence, deltaT50 was more accurate than QTcF in identifying the LQTS patients, and the combination of both QTcF and deltaT50 further improved the strength of the diagnostic test. The sensitivity and specificity of QTcF, deltaT50, and the combination of both as diagnostic markers for LQTS are summarized in Table 3.
Table 3.
QTcF Intervals and DeltaT50 as Diagnostic Markers for LQTS
| Cutoff (ms) | Sensitivity (%) | Specificity (%) | PPV (%) | NPV (%) | |
|---|---|---|---|---|---|
| QTcF | 400 | 93.4 | 68.0 | 86.3 | 82.6 |
| 425 | 76.8 | 95.4 | 97.3 | 65.5 | |
| 450 | 51.5 | 98.9 | 99.0 | 48.5 | |
| DeltaT50 | 2.0 | 99.5 | 38.9 | 77.9 | 97.1 |
| 2.5 | 97.4 | 73.7 | 88.9 | 92.8 | |
| 3.0 | 93.9 | 88.6 | 94.7 | 87.1 | |
| QTcF and DeltaT50 | 400/3 | 88.1 | 92.0 | 96.0 | 78.2 |
| 425/3.0 | 74.1 | 98.3 | 98.9 | 63.7 | |
| QTcF | 410 | 90 | 79.4 | 90.5 | 78.5 |
| DeltaT50 | 3.33 | 90 | 93.7 | 96.9 | 81.2 |
| QTcF and DeltaT50 | 403/2.5 | 90 | 87.4 | 94.0 | 80.5 |
| QTcF | 396 | 95 | 60.0 | 83.7 | 84.7 |
| DeltaT50 | 2.86 | 95 | 85.1 | 93.3 | 88.7 |
| QTcF and DeltaT50 | 453/3.0 | 95 | 88.0 | 94.5 | 89.0 |
PPV = positive predictive value; NPV = negative predictive value.
Among the LQTS patients, 51% had QTcF intervals >450 ms, 94% had deltaT50 >3 ms, and 97% had deltaT50 >2.5 ms (Fig. 1, Table 3). Correspondingly, among the HV, 1% had QTcF >450 ms, 11% had deltaT50 >3 ms, and 26% had deltaT50 >2.5 ms (Fig. 1, Table 3).
It is notable that one of the ECGs from the HV showed aberrant values of both QTcF and deltaT50, namely 490 and 5.76 ms (Fig. 1A).
Features typical for the “silent mutation carriers,” that is a QTcF < 450 ms and no reported symptoms, were found in 24% of the LQTS ECGs. Among these, 92% had a deltaT50 >3 ms and 97% had a deltaT50 >2.5 ms. The majority of the ECGs from LQTS patients with QTcF <450 ms and deltaT50 <3 ms belonged to the LQTS1 genotype (Fig. 1B).
DeltaT50 and Risk of Cardiac Events
DeltaT50 in ECGs from presumed “low‐risk” subgroups, that is, LQTS patients without symptoms, with QTcF <450 ms or belonging to the LQTS1 genotype, was significantly lower than in presumed “high‐risk” subgroups, that is, LQTS patients with symptoms, with QTcF >500 ms, with symptoms during beta‐blocker treatment, or belonging to the JLN genotype (Fig. 4). DeltaT50 in the LQT3 subgroup was significantly higher than in the LQTS patients without symptoms and in those with QTcF <450 ms, but not significantly different from deltaT50 in the LQTS1 patients (Fig. 4). In contrast, in male LQTS3 patients, deltaT50 at night was significantly higher than deltaT50 in the presumed “low‐risk” subgroups (Fig. 4).
Figure 4.
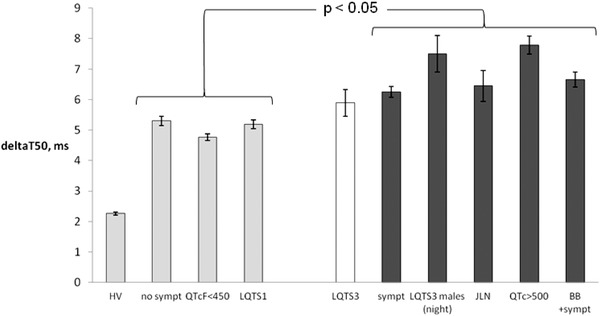
DeltaT50 for the subgroups with lower risk of cardiac events; healthy volunteers (HV), asymptomatic LQTS patients (no sympt), LQTS patients with QTcF <450 ms (QTcF < 450 ms) and patients with LQTS1 (LQTS1) compared to the subgroups with higher risk of cardiac events; patients with LQTS3 (LQTS3), symptomatic LQTS patients (sympt), male LQTS3 patients at night (LQTS3 males (night), patients with JLN (JLN), LQTS patients with QTcF >500 ms (QTcF > 500 ms) and LQTS patients with symptoms during treatment with beta‐blocker (BB + sympt). The groups with dark gray bars, that is, all high‐risk groups except for the patients with LQTS3, had significantly higher deltaT50 than the groups illustrated by light gray bars, that is, the low‐risk groups. Shown are mean ± SEM.
DeltaT50 during Beta Blockade
The effect of beta blockade on deltaT50 was investigated by comparing LQTS patients with symptoms and without treatment with beta‐blocking agents and LQTS patients without symptoms during beta blockade. DeltaT50 did not differ significantly between the two groups of patients (5.89 ± 2.53 vs 5.44 ± 2.32 ms).
Diurnal Variation of DeltaT50
The time point when the Holter recording was started differed between the subjects, from 8 p.m. to 9 a.m., and measurements of deltaT50 could not be obtained both in the daytime and nighttime from 18 ECGs. DeltaT50, QTtang, QTcF, and HR measured every 15th minute for 24 hours are shown for one HV and one LQTS2 patient in Figures 5A and B. There was good correlation between the daytime and nighttime values of deltaT50 in the individual subjects (R2 = 0.75) (Fig. 5C). However, deltaT50 was significantly higher in the daytime than nighttime in the HV, LQTS1, and JLN patients (Fig. 6, Table 2), and significantly lower in the daytime than nighttime in the LQTS3 patients (Fig. 6, Table 2). There was no significant difference between deltaT50 in the daytime and nighttime in the LQTS2 patients (Fig. 6, Table 2). The QTcF interval was shorter in the daytime than the nighttime in all subgroups except the JLN patients (Fig. 6, Table 2).
Figure 5.
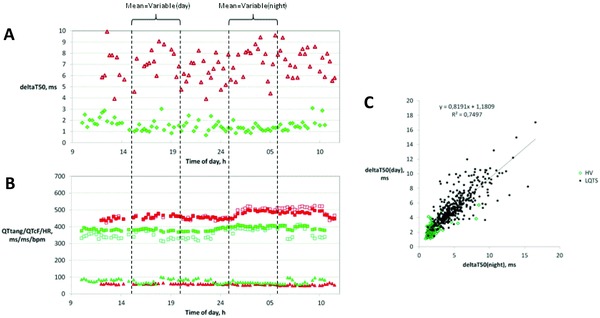
DeltaT50 (Panel A) and QTtang (open squares), QTcF (filled squares), and HR (triangles) (Panel B) were measured once every 15th minute on Holter ECGs recorded over 24 hours. Panels A and B show representative results from one healthy volunteer (green symbols) and one patient with LQTS2 (red symbols). The average deltaT50 and QTcF during the day and at night were calculated from the values between 3 and 8 p.m. and between 1 and 6 a.m., respectively. In Panel C, the individual values of deltaT50 during the day for the healthy volunteers (green symbols) and patients with LQTS (red symbols) are plotted versus the corresponding values of deltaT50 at night, which show that deltaT50 during the day and at night correlated well (R2 = 0.7497).
Figure 6.
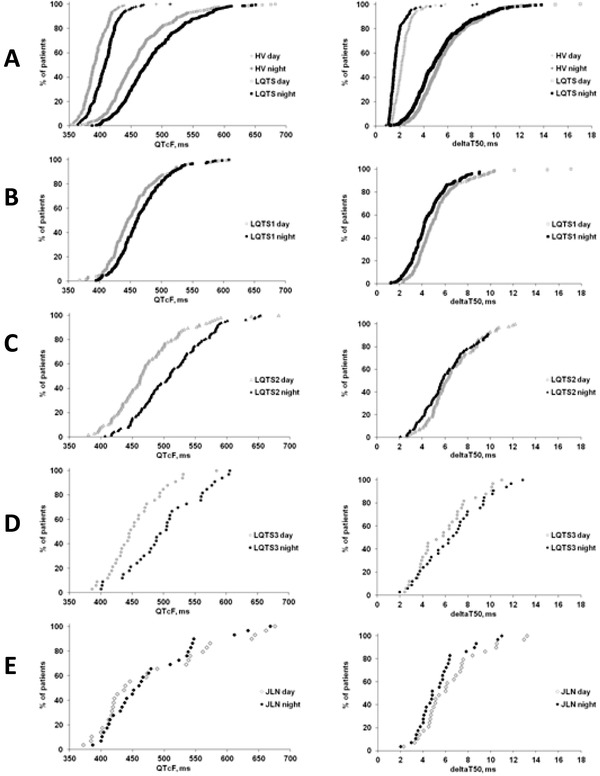
The cumulative frequency of healthy volunteers (HV) and LQTS patients over the range of QTcF intervals (left panels) and deltaT50 values (right panels) measured during the day (gray symbols) and at night (black symbols) in the present study. (A) HV and all LQTS patients; (B) LQTS1 patients; (C) LQTS2 patients; (D) LQTS3 patients; and (E) JLN patients.
DISCUSSION
Despite the name of the syndrome, a significant proportion of LQTS patients have QT intervals that fall within normal ranges. Approximately, 50% of the genotyped LQTS patients in the present study had normal QT intervals at the time of the analysis. However, the channelopathies and the reduced repolarization reserve in LQTS patients may be expressed through other indices than QT interval prolongation per se. In the present study, assessment of the repolarization variability with the deltaT50 method was found to improve the identification of the LQTS patients, including the LQTS patients without symptoms and with normal QT intervals. In addition, subgroups with features (symptoms, male sex and LQTS3, JLN, QTcF >500 ms, and symptoms during beta‐blockade) associated with a higher risk of cardiac events had a higher deltaT50 than the subgroups with lower risk (no symptoms, QTcF <450 ms, LQTS1).
Our results are in accordance with previous findings showing that assessment of the short‐term variability of the QT interval (e.g., STVQT) improved the diagnosis of LQTS patients and that STVQT was higher in symptomatic than in asymptomatic patients.21 However, in our study population, symptoms were reported in patients with a wide range of deltaT50 values, and the precise deltaT50 level that indicated an increased risk of symptoms was not defined. Instead, two levels of deltaT50, 2.5 and 3 ms, were arbitrarily chosen to investigate the ability of deltaT50 to discriminate between HV and LQTS patients. The definition of a “dangerous” deltaT50 level would have to be determined prospectively and be related to the incidence of cardiac events in the individual patient. Of the LQTS patients in the present study who were not identified by means of the QTcF interval or deltaT50, the majority belonged to the LQTS1 subgroup, which is the LQTS genotype with a relatively lower risk of symptoms compared to LQTS2, LQTS3, and JLN.3, 22 Tentatively, the genotyped LQTS patients with normal QT intervals and deltaT50 values may be at relatively lower risk of experiencing cardiac events. In contrast, one HV had deltaT50 and QTcF values clearly outside the normal range, which, although this is speculative, may indicate an undiagnosed repolarization disturbance.
The association between deltaT50 and risk related to phenotype and genotype characteristics were evaluated by comparing deltaT50 in specific subgroups of patients with different relative risks of cardiac events.3, 22, 23, 24 The lowest risk, although more than 10‐fold higher than in unaffected family members, was reported in mutation carriers with normal QTc.23 The incidence of life‐threatening events before the age of 40 was lower among patients with LQTS1 than in those with LQTS2 and LQTS3, and the highest lethality was reported in patients with LQTS3.3, 22 JLN patients belong to a high‐risk group, and LQTS patients with symptoms seem to be at higher risk than those without symptoms.22, 24 LQTS patients with a QTc >500 ms are at high risk, since this was the single most important risk factor in predicting events,3 whereas patients with syncopal episodes occurring during beta‐blocker treatment24 and male patients with LQTS322 represent high‐risk groups irrespective of their QT interval. Indeed, deltaT50 was higher in the high‐risk than the low‐risk groups in the present study, a fact that may imply that the risk of arrhythmias increases with increasing deltaT50. However, in the individual patient, symptoms were associated with deltaT50 values spanning across the whole range, which implies that a small increase in deltaT50 may also signal an arrhythmia risk.
An interesting observation was the difference in the diurnal variation of deltaT50 between the LQTS genotypes, since it appeared to mirror their diurnal variation in the risk of symptoms. Thus, deltaT50 was higher in the daytime than the nighttime in the LQTS1 patients, who usually experience symptoms during sympathetic activation, and, in contrast, higher in the nighttime than daytime in the LQTS3 patients who usually experience symptoms during rest and sleep.25 Symptoms in LQTS2 patients may be triggered both from sympathetic activation and during rest and sleep,25 and the deltaT50 showed no diurnal variation in this group. In contrast, QTcF was shorter in the daytime than nighttime except in the JLN patients. These results emphasize that assessments of the deltaT50 and QTcF provide different and complementary information about cardiac repolarization.
DeltaT50 varied considerably over the 24‐hour Holter recording period in the LQTS patients and also between repeated measurements on different occasions in the same patient. In contrast, deltaT50 in the HV was more stable over time and between repeated measurements.19 The more pronounced variability of deltaT50 in the LQTS patients is most likely an expression of the instability of the cardiac electrophysiology in this type of patient having a reduced repolarization reserve. It also implies that measuring deltaT50 at one single time point for diagnostic purposes may be misleading and that it provides information about the conditions at that particular moment only.
Treatment with beta‐blocking agents reduces the risk of malignant arrhythmias and sudden cardiac death in LQTS patients, mainly in the LQTS1 subgroup.26 An exercise‐induced increase in QTc in LQTS patients was reduced by beta‐blockers, pointing to a protective effect against excessive QT interval prolongation, and could mask the LQTS phenotype during exercise.14 In the present study, however, the ability of deltaT50 to identify patients with LQTS was not concealed by concomitant beta‐blocking therapy. Possibly, the lack of effect of beta‐blockers on deltaT50 may correspond to a significant remaining risk of cardiac events in LQTS patients treated with beta‐blocking agents.26
In the study by Hinterseer,21 the STVQT was estimated from manual measurements of the QT interval on ECG printouts from a relatively small number of subjects. In the present study, the ventricular repolarization variability was addressed by means of the deltaT50 method, allowing automatic measurements19 of large ECG databases imported into the EClysis software. Comparisons between the deltaT50 and the beat‐to‐beat QT‐variability measured with the tangent method using the EClysis software were not done. However, we previously showed that the variability at 20%, 50%, and 80% of the T‐wave downslope was very similar, that is, the whole T‐wave downslope moved in parallel when the QT interval varied.19 The 50% level was chosen since this part of the T‐wave downslope was less sensitive to noise and slightly more robust than the 20% and 80% levels.
In this study, ECGs derived from the THEW database were used for analysis. Needless to say, the availability of specific databases for purposes like this provides excellent opportunities to test new algorithms without the need to recruit new and sufficiently large patient populations that may be more or less difficult to find. The application of the deltaT50 method is currently limited to ECGs with positive T waves, but the impact of signal noise and heart rhythm irregularities is diminished by the built‐in exclusion criteria and the signal smoothing procedure. The deltaT50 method allows for rational analysis of large study populations and may therefore be a valuable tool in future evaluations of increased beat‐to‐beat repolarization variability as a diagnostic tool and risk marker for cardiac events.
LIMITATIONS
A limitation in the present study is that we do not know the exact timing of the ECG recording in relation to reported symptoms among the LQTS patients and we cannot exclude that deltaT50 (and/or QT interval duration) measurements close to the event might have yielded different results.
CONCLUSIONS
In conclusion, beat‐to‐beat repolarization variability measured with the deltaT50 method improved the diagnosis of LQTS patients, both alone and in combination with the QT interval duration. Treatment with beta‐blocking agents did not affect the accuracy of deltaT50 as a diagnostic marker. The tentative value of deltaT50 as a risk marker for cardiac events was indicated by the higher deltaT50 in the subgroups of patients characterized by known risk factors, such as in the LQTS2, LQTS3, and JLN genotypes, QTcF>500 ms, and/or symptoms. The results imply that deltaT50 may be used as an ECG‐based biomarker for diagnosis and risk assessment of patients with LQTS.
REFERENCES
- 1. Bastiaenen R, Behr ER. Sudden death and ion channel disease: Pathophysiology and implications for management. Heart 2011;97:1365–1372. [DOI] [PubMed] [Google Scholar]
- 2. Roden DM. Long‐QT syndrome. N Eng J Med 2008;358:169–176. [DOI] [PubMed] [Google Scholar]
- 3. Priori SG, Schwartz PJ, Napolitano C, et al. Risk stratification in the long‐QT syndrome. N Engl J Med 2003;348:1866–1874. [DOI] [PubMed] [Google Scholar]
- 4. Goldenberg I, Horr S, Moss AJ, et al. Risk for life‐threatening cardiac events in patients with genotype‐confirmed long‐QT syndrome and normal‐range corrected QT intervals. J Am Coll Cardiol 2011;57:51–59. [DOI] [PMC free article] [PubMed] [Google Scholar]
- 5. Goldenberg I, Moss AJ, Zareba W. QT interval: How to measure it and what is “normal.” J Cardiovasc Electrophysiol 2006;17:333–336. [DOI] [PubMed] [Google Scholar]
- 6. Extramiana F, Tatar C, Maison‐Blanche P, et al. Beat‐to‐beat T‐wave amplitude variability in the long QT syndrome. Europace 2010;12:1302–1307. [DOI] [PubMed] [Google Scholar]
- 7. Kanters JK, Graff C, Andersen MP, et al. Long QT syndrome geotyping by electrocardiography: Fact, fiction, or something in between? J Electrocardiol 2006;39:S119–S122. [DOI] [PubMed] [Google Scholar]
- 8. Moss AJ, Zareba W, Benhorin J, et al. T‐wave patterns in genetically distinct forms of the hereditary long QT syndrome. Circulation 1995;92:2929–2934. [DOI] [PubMed] [Google Scholar]
- 9. Krahn AD, Klein GJ, Yee R. Hysteresis of the RT interval with exercise: A new marker for the long‐QT syndrome? Circulation 1997;96:1551–1556. [DOI] [PubMed] [Google Scholar]
- 10. Takenaka K, Tomohiko A, Shimizu W, et al. Exercise stress test amplifies genotype‐phenotype correlation in the LQT1 and LQT2 forms of the long‐QT syndrome. Circulation 2003;107:838–844. [DOI] [PubMed] [Google Scholar]
- 11. Nemec J, Buncova M, Bulkova V, et al. Heart rate dependence of the QT interval duration: Differences among congenital long QT syndrome subtypes. J Cardiovasc Electrophysiol 2004;15:550–556. [DOI] [PubMed] [Google Scholar]
- 12. Couderc JP, Vaglio M, Cia X, et al. Impaired T‐amplitude adaption to heart rate characterizes IKr inhibition in the congenital and acquired forms of the long QT syndrome. J Cardiovasc Electrophysiol 2007;18:1299–1305. [DOI] [PubMed] [Google Scholar]
- 13. Walker BD, Krahn AD, Klein GJ, et al. Burst bicycle exercise facilitates diagnosis of latent long QT syndrome. Am Heart J 2005;150:1059–1063. [DOI] [PubMed] [Google Scholar]
- 14. Wong JA, Gula LJ, Klein GJ, et al. Utility of treadmill testing in identification and genotype prediction in long QT syndrome. Circ Arrhythm Electrophysiol 2010;3:120–125. [DOI] [PubMed] [Google Scholar]
- 15. Viskin S, Postema PG, Bhuiyan ZA, et al. The response of the QT interval to brief tachycardia provoked by standing: A bedside test for diagnosing long QT syndrome. J Am Coll Cardiol 2010;55:1955–1961. [DOI] [PMC free article] [PubMed] [Google Scholar]
- 16. Fossa AA. Assessing QT prolongation in conscious dogs: Validation of a beat‐to‐beat method. Pharmacol Ther 2008;119:13–40. [DOI] [PubMed] [Google Scholar]
- 17. Extramiana F, Denjoy I, Badilini F, et al. Heart rate influences on repolarization duration and morphology in symptomatic versus asymptomatic KCNQ1 mutation carriers. Am J Cardiol 2005;95:406–409. [DOI] [PubMed] [Google Scholar]
- 18. Zareba W. Challenges of diagnosing long QT syndrome in patients with nondiagnostic resting QTc. J Am Coll Cardiol 2010;55:1962–1964. [DOI] [PubMed] [Google Scholar]
- 19. Abrahamsson C, Dota C, Skallefell B, et al. DeltaT50—A new method to assess temporal ventricular repolarization variability. J Electrocardiol 2011;44:477.e1–477.e9. [DOI] [PubMed] [Google Scholar]
- 20. Dota C, Skallefell B, Edvardsson N, et al. Computer‐based analysis of dynamic QT changes: Toward high precision and individual rate correction. Ann Noninvasive Electrocardiol 2002;7:289–301. [DOI] [PMC free article] [PubMed] [Google Scholar]
- 21. Hinterseer M, Beckman B‐M, Thomsen MB, et al. Relation of increased short‐term variability of QT interval to long‐QT syndrome. Am J Cardiol 2009;103:1244–1248. [DOI] [PubMed] [Google Scholar]
- 22. Markiewicz‐Loskot G, Moric‐Janiszewska E, Mazurek U. The risk of cardiac events and genotype‐based management of LQTS patients. Ann Noninvasive Electrocardiol 2009;14:86–92. [DOI] [PMC free article] [PubMed] [Google Scholar]
- 23. Goldenberg I, Horr S, Moss AJ, et al. Risk for life‐threatening cardiac events in patients with genotype‐confirmed long‐QT syndrome and normal‐range corrected QT intervals. J Am Coll Cardiol 2011;57:51–59. [DOI] [PMC free article] [PubMed] [Google Scholar]
- 24. Jons C, Moss AJ, Goldenberg I, et al. Risk of fatal arrhythmic events in long QT syndrome patients after syncope. J Am Coll Cardiol 2010;55:783–788. [DOI] [PubMed] [Google Scholar]
- 25. Sakaguchi T, Shimizu W, Itoh H, et al. Age‐ and genotype‐specific triggers for life‐threatening arrhythmia in the genotyped long QT syndrome. J Cardiovasc Electrophysiol 2008;19:794–799. [DOI] [PubMed] [Google Scholar]
- 26. Moss AJ, Zareba W, Hall J et al. Effectiveness and limitations of β‐blocker therapy in congenital Long‐QT Syndrome. Circulation 2000;101:616–623. [DOI] [PubMed] [Google Scholar]


