

Abstract
Background: The global QT interval, emerging as a standard measurement provided by digital electrocardiographs, is defined by the earliest QRS onset and latest T‐wave offset that occur in any of the standard leads. Differences between global ECG measurements and those from individual ECG leads have implications for the redefinition of normal values, for recognition of disease, and for drug safety. This study sought to quantify the differences between global QT intervals measured from 12 superimposed ECG leads with QT intervals and from single lead complexes, to examine the separate effects of QRS onset and T‐wave offset on these differences, and to examine the reproducibility of these measurements.
Methods: QTo intervals (Q onset to T offset) from 50 digitized ECGs sampled at 500 Hz were examined by computer assisted derivation of representative complexes from standard leads II, V2, and V3, by both baseline and tangent methods. Global QTo intervals were measured from superimposition of the representative complexes of all 12 leads. A time‐coherent matrix of waveform onset and offset points allowed direct comparison of the components of the differences.
Results: Global QTo and Bazett‐adjusted global QTc were greater than each of the baseline and tangent measurements in representative leads II, V2, and V3, with mean differences ranging from 8 to 18 ms. QRS onset was earlier in the global complex than in each of the representative leads, with mean differences of 3–5 ms, whereas T‐wave offset was significantly later in the global complex than in each of the representative leads, with mean differences of 5–11 ms. Remeasurement of all ECGs after an interval of 6 months confirmed the relative magnitudes of the global and individual lead QTo durations and small mean differences between pairs (−0.9 to 2.7 ms). Although global QTo had the largest mean difference (only 2.7 ms), it had the smallest standard deviation of the mean difference and lowest coefficient of variability (1.58%) of all measurements.
Conclusion: Global QT measurements are systematically larger than measurements from representative complexes of individual leads. These differences result from the combined effects of earlier QRS onset and later T‐wave offset in the global complex, with T‐wave offset the more dominant component of the difference.
Keywords: electrocardiogram, QT interval, measurements
Global measurement of the ECG QT interval seeks the earliest QRS onset and latest T‐wave offset in any lead by examining temporally aligned representative complexes of simultaneously acquired leads, whereas single lead QT measurements with reduced noise can be derived from representative complexes, which have been averaged over a number of beats. 1 , 2 , 3 , 4 , 5 Because isoelectric components of waveforms commonly exist in individual leads, the earliest onset of QRS and latest offset of the T wave are not likely to be present in any single ECG lead and global QT intervals should systematically exceed those from individual complexes. 1 , 6 Global measurement of the QT interval is emerging as a standard in automated electrocardiography, and even small differences in measured QT intervals can be clinically relevant. QT interval measurements have important consequences, 7 including a central role in detection of congenital and acquired channelopathies, 8 , 9 , 10 , 11 prediction of risk within populations, 12 , 13 , 14 , 15 , 16 , 17 , 18 , 19 as a marker for potentially fatal arrhythmogenesis, 20 , 21 , 22 and as a critical element in the evaluation of new drugs. 23 , 24 , 25 , 26 , 27 Although it is appreciated that different methods of QT measurement produce different results, 6 , 28 , 29 , 30 , 31 , 32 , 33 the magnitude of difference between physician‐interactive global and single lead measurements in relation to ECG measurement methodology has not been well quantified. Accordingly, we examined QT interval measurements by global complex superimposition and from averaged representative complex methods, using both baseline and tangent methods in the representative complexes, and sought to explain why these differences occur.
METHODS
The study population consists of 50 subjects, with and without disease, whose digital ECGs were acquired at 16‐bit resolution at 500 samples per second, with simultaneous, temporally aligned individual leads (Cardionics ECG Computer Systems, Brussels, Belgium). Signal processing included formation of a representative (averaged) complex from 10 seconds of recording in each lead. After detection of the dominant normal complex with the highest signal‐to‐noise ratio, all additional normal complexes within the 10 seconds of recording undergo a sample‐to‐sample mathematical correlation with this reference beat. Complexes with high correlation values with the reference beat are combined into a single template, with temporal shift when needed to correct for misalignment, to form the representative complex for that lead. Superimposition of all temporally aligned single representative complexes allowed for global determination of earliest waveform onset and latest waveform offset among all leads. An example of 12 superimposed representative complexes, with temporally aligned single representative complexes for lead II and lead V2, is shown in Figure. 1.
Figure 1.
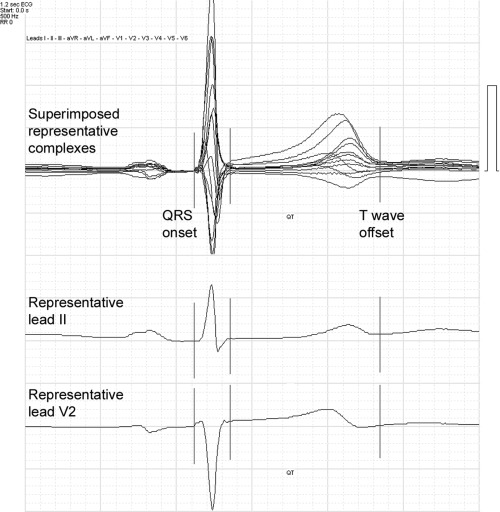
Superimposed representative complexes from 12 leads (top), with temporally aligned individual representative complexes from lead II (middle) and lead V2 (bottom). The lines represent global QRS onset, global QRS offset, and global T‐wave offset as represented by the superimposed complexes. Note that apparent QT in each of the single leads is less than the global QT measurement.
All raw and derived waveforms were analyzed on a control screen with physician‐operated measurement markers for determination of interval durations, at a resolution that allows interpolation of measurements to the nearest 1 ms. Subjects in whom a T wave could not confidently be identified in any single lead of II, V2, or V3 because of low amplitude were excluded from this series (2 of 52 subjects). P‐wave onset, QRS onset, QRS offset, and T‐wave offset were identified for each ECG from global superimposition of all leads, and from simultaneous 10 seconds of data from individual representative leads II, V2, and V3. Both baseline (the visual return of the T wave to baseline level) and tangent (the intersection with baseline of the tangent to the steepest part of the descending T wave) methods were used for the determination of the end of the T wave in the representative complex from each lead.
From the global complex and from each measurement method from each lead, PR interval, QRS duration, and QTo interval (where QTo represents the rate uncorrected interval from QRS onset to T offset) were determined in a physician‐interactive, semiautomated iteration that included computer preplacement with subsequent physician adjustment of waveform onsets and offsets for both superimposed and individual lead representative complexes. Heart rate was calculated from the RR intervals of normal complexes, which was identical for each representative complex and for the global complex because all were derived from the same 10‐second epoch. Calculated heart rates were used to adjust each QTo by means of the widely used Bazett correction to result in a rate‐corrected QTc. The Cardionics reviewing system records all physician‐validated fiducial markings in a 1200 ms wide time‐coherent matrix (where each interpolated sample unit corresponds to 1 ms). Because all leads are recorded simultaneously, this provides an absolute timing track that is constant from lead to lead. From the time‐coherent matrix, global and representative interval durations may be calculated by subtraction of the relevant sample unit (for example, QT interval = T‐wave offset sample point − QRS onset sample point). Relative onsets and offsets of global and individual lead waveforms, and between waveforms, may thus be compared and quantified by examination of their recorded sample points. All measurements were made at MDS Centralized Cardiac Services (MDS Pharma Services, Baillet‐en‐France) by a single, highly experienced cardiologist‐electrocardiographer (BT).
Data were entered into SPSS (version 11) for analysis. Mean values are presented with the standard deviation (SD) as the index of dispersion. The primary analyses were the comparison of QTo and QTc intervals by global measurement and by baseline and tangent measurements in the individual representative complexes. In addition, QRS onset timing and T‐wave offset timing from the measurement matrix were compared to determine the reason for the observed QT differences. All difference between corresponding interval measurements were examined by repeated measures analysis of variance, with the Bonferroni correction for multiple comparison. Differences between global and representative lead II (baseline method) were used to provide a modified Bland–Altman plot, augmented by regression data. Long‐term reproducibilty of measurements was examined by repeating all measurements by the single observer after approximately 4 months. Mean differences between repeated measurements were examined by the paired t‐test. The SD of the mean difference (SD difference) was examined as a measure of reproducibility, along with the coefficient of variability, calculated in percent as 100 × SD difference/average value of the mean values for the 2 measurements. The coefficient of variability normalizes the SD difference for differences in underlying measurement magnitude. Reproducibility was also examined by comparing 90, 95, and 97.5% upper confidence limits of the mean difference.
RESULTS
Global QTo was significantly greater than each of the baseline and tangent measurements in representative leads II, V2, and V3 (Table 1), ranging from 8 to 17 ms mean difference. Similarly, global QTc (rate‐corrected by Bazett relationship) was significantly greater than QTc in each of the individual representative leads (Table 2), ranging from 9 to 18 ms mean difference. QTo and QTc were comparable in limb lead II and in V3 and tended to be greater than in V2 (Tables 1 and 2, Fig. 2). No significant differences were present between mean baseline and tangent measurements of QTo or QTc in any of the individual representative leads. A Bland–Altman type plot relating the differences between global QTo and representative lead II QTo (by the baseline method) in relation to the underlying QTo measurement is shown in Figure 3. This reveals the systematically larger value found for global QTo, but no relation of the differences to the underlying QTo.
Table 1.
QTo Duration (Rate‐Uncorrected), According to Measurement Method
| Method | Mean QT (ms) | SD (ms) | P |
|---|---|---|---|
| Global QTo | 389 | 33 | – |
| Representative QTo II, baseline | 379 | 34 | <0.001 |
| Representative QTo II, tangent | 381 | 34 | <0.001 |
| Representative QTo V2, baseline | 375 | 33 | <0.001 |
| Representative QTo V2, tangent | 372 | 35 | <0.001 |
| Representative QTo V3, baseline | 380 | 33 | <0.001 |
| Representative QTo V3, tangent | 378 | 35 | <0.001 |
P = Significance of difference from Global QTo, by Bonferroni adjusted repeated measures analysis of variance.
Table 2.
QTc Duration (Bazett Rate‐Corrected), According to Measurement Method
| Method | Mean QT (ms) | SD (ms) | P |
|---|---|---|---|
| Global QTc | 415 | 20 | − |
| Representative QTc II, baseline | 405 | 22 | <0.001 |
| Representative QTc II, tangent | 406 | 25 | <0.001 |
| Representative QTc V2, baseline | 400 | 19 | <0.001 |
| Representative QTc V2, tangent | 397 | 26 | <0.001 |
| Representative QTc V3, baseline | 406 | 21 | <0.001 |
| Representative QTc V3, tangent | 404 | 23 | <0.001 |
P = Significance of difference from Global QTc, by Bonferroni adjusted repeated measures analysis of variance.
Figure 2.
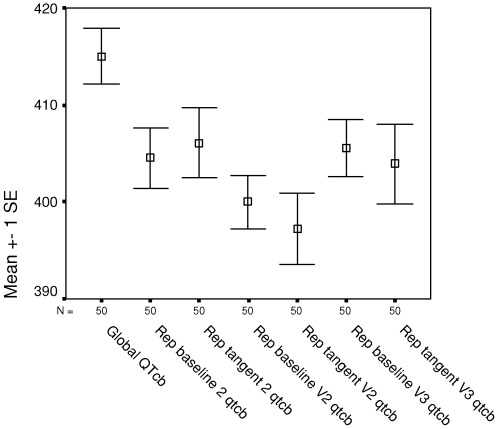
Mean (standard error) Bazett‐corrected QTc from global superimposition and from individual representative leads II, V2, and V3, using baseline and tangent methods of QT measurement. QTob = Bazett corrected QTc; Repbaseline(2, V2, V3) = representative lead (II, V2, V3) by baseline method of QT measurement; Reptangent (2, V2, V3) = representative lead (II, V2, V3) by tangent method of QT measurement.
Figure 3.
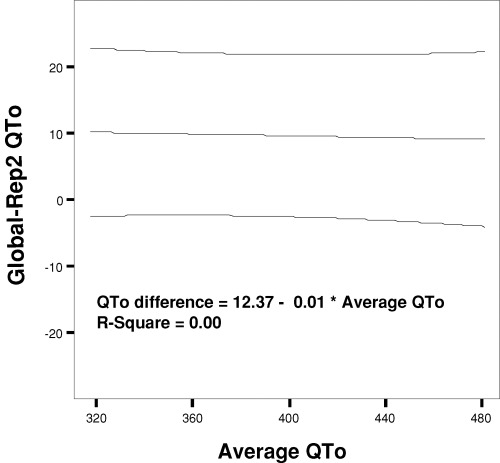
Bland–Altman plot illustrating the relation of the differences between global QTo and representative lead II QTo (baseline method) to underlying QTo value expressed as the average of the two measurements. Data are shown with the mean regression line and 95% boundary. Despite the systematically higher values for global QT, there is no relation of the differences to the underlying QT measurements (R2= 0.00).
From the time‐coherent matrix data, QRS onset was significantly earlier in the global complex than in representative leads II, V2, and V3 (Table 3), with mean differences of 3–5 ms. Further, T‐wave offset was significantly later in the global complex than in each of the individual representative leads (Table 4), with mean differences of 5–11 ms. With respect to each individual lead, the longer global QT occurs as the combined consequence of both earlier global QRS onset and later global T‐wave offset. Thus, in comparison with measurements from representative lead II, the 9.8 ms greater mean global QTo results from both 3.8 ± 4.3 ms earlier QRS onset and 6.0 ± 4.6 ms later T‐wave offset, with the later T‐wave offset component significantly larger than the earlier QRS component (P = 0.019, Fig. 4). Expressed as mean percent contribution to overall QTo difference between global and lead II measurements, the mean 71% T offset component was also significantly longer than the mean 29% QRS onset component (P = 0.021), but with wide overall variation (SD 63% for each, SE 9% for each). As seen from Tables 3 and 4, similar components of difference are apparent for global and representative V3, whereas earlier T offset contributes more to the overall difference in global and representative V2 measurements.
Table 3.
QRS Onset by Matrix Sample Point (ms), According to Measurement Method
| Method | Matrix (ms) | SD (ms) | P |
|---|---|---|---|
| Global QRS onset | 405 | 5 | – |
| QRS onset Representative II, baseline | 409 | 6 | <0.001 |
| QRS onset Representative V2, baseline | 408 | 5 | <0.001 |
| QRS onset Representative V3, baseline | 408 | 6 | <0.001 |
P = Significance of difference from Global QRS onset sample point, by Bonferroni adjusted repeated measures analysis of variance.
Table 4.
QT Offset by Matrix Sample Point (ms), According to Measurement Method
| Method | Matrix (ms) | SD (ms) | P |
|---|---|---|---|
| Global QT offset | 794 | 33 | – |
| QT offset, Representative II, baseline | 788 | 33 | <0.001 |
| QT offset, Representative V2, baseline | 783 | 32 | <0.001 |
| QT offset, Representative V3, baseline | 789 | 32 | <0.001 |
P = Significance of difference from Global QT offset sample point, by Bonferroni adjusted repeated measures analysis of variance.
Figure 4.
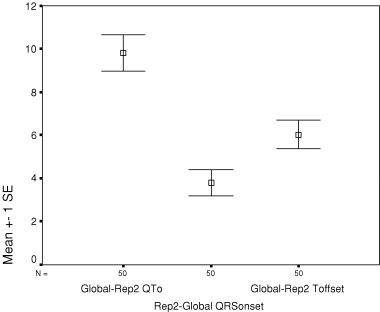
Mean (standard error) difference between global QTo and representative lead II QTo, with components of QTo difference attributable to earlier onset (Rep2‐Global QRSonset) and later offset (Global‐Rep2 Toffset) of global QTo relative to lead II.
Table 5 summarizes intraobserver reproducibility of measurements repeated after an interval of 6 months. Mean differences between pairs were small for all measurements examined in this study (−0.9 to 2.7 ms). Although just above the 2 ms sampling rate of the data, the paired mean differences reached statistical significance for global QTo and for representative lead II measured by the tangent method. Despite the larger paired mean difference, global QTo had the highest reproducibility, as indicated by the smallest SD of the mean difference and lowest coefficient of variability (1.58%) of all measurements. Reproducibility of global QTo was followed closely by the tangents to representative leads V2 and II. Upper confidence bounds of the mean difference between serial measurements are shown in Table 6 for 90, 95, and 97.5% confidence intervals of the difference. All values are <5 ms, lowest for measurements in V2, and highest (as a consequence of larger mean difference) for global QTo. Of note, when repeated measures analysis of variance with post hoc testing was separately applied to the second set of QTo measurements, global QTo remained significantly greater than each of the other measurements, consistent with the findings of the primary analysis.
Table 5.
Reproducibility of QTo Measurements: Mean Difference Between Measurements, Standard Deviation of the Difference, and Coefficient of Variability According to Measurement Method
| Method | Average of Pairs (ms) | Mean Difference Between Pairs (ms) | P (Mean Difference) | SD of Mean Difference (ms) | Coefficient of Variability (%) |
|---|---|---|---|---|---|
| Global QTo | 388 | 2.66 | 0.004 | 6.14 | 1.58 |
| Representative QTo II, baseline | 379 | 0.73 | 0.687 | 12.67 | 3.34 |
| Representative QTo II, tangent | 379 | 2.27 | 0.026 | 6.91 | 1.83 |
| Representative QTo V2, baseline | 375 | −0.12 | 0.919 | 8.32 | 2.22 |
| Representative QTo V2, tangent | 373 | −0.58 | 0.525 | 6.40 | 1.72 |
| Representative QTo V3, baseline | 381 | −0.90 | 0.495 | 9.13 | 2.40 |
| Representative QTo V3, tangent | 378 | 0.60 | 0.649 | 9.28 | 2.45 |
P = Significance of mean difference between paired measurements; coefficient of variability = 100 × SD of mean difference/average of paired measurements.
Table 6.
Reproducibility of QTo Measurements: Mean Difference Between Measurements, With 90, 95, and 97.5% Two‐Tailed Upper Confidence Limit for the Difference, According to Measurement Method
| Method | Mean Difference Between Pairs (ms) | Upper 90% Confidence Limit (ms) | Upper 95% Confidence Limit (ms) | Upper 97.5% Confidence Limit (ms) |
|---|---|---|---|---|
| Global QTo | 2.66 | 4.11 | 4.40 | 4.67 |
| Representative QTo II, baseline | 0.73 | 3.77 | 4.37 | 4.92 |
| Representative QTo II, tangent | 2.27 | 3.92 | 4.25 | 4.55 |
| Representative QTo V2, baseline | −0.12 | 1.85 | 2.24 | 2.60 |
| Representative QTo V2, tangent | −0.58 | 0.94 | 1.24 | 1.51 |
| Representative QTo V3, baseline | −0.90 | 1.29 | 1.73 | 2.12 |
| Representative QTo V3, tangent | 0.60 | 2.80 | 3.24 | 3.63 |
DISCUSSION
As demonstrated by Willems and colleagues, isoelectric components of individual waveforms can alter the apparent onset and offset in individual leads, leading to the increasingly adopted recommendation for simultaneous sampling from independent leads in computerized electrocardiography. 1 With technical advances in signal processing, global measurements of ECG interval durations are now widely used in clinical practice and in clinical investigation. 34 , 35 , 36 When the global QT interval is defined from the earliest QRS to latest T‐wave offset by time‐coherent averaged complex superimpostion of all ECG leads, the duration would be expected to be larger than those derived from single lead measurements. 32 , 37 Thus, normal values for global QT duration should be systematically larger than normal values that were derived earlier from single leads, an evolving phenomenon that is commonly observed by users of automated global algorithms in routine electrocardiography. 31 Even within individual manufacturers of automated electrocardiographs, evolving global algorithms have resulted in significantly longer QT intervals than in prior global algorithms. 38
Our data confirm early observations by Willems et al. 1 and more recent observations by Azie et al. 6 that operator interactive measurement of global QT from time coherent superimposed 12‐lead complexes in normal volunteers result in longer values than those derived with the use of a digitizing tablet in standard single limb lead II. We extend those findings by providing a statistically robust quantification of the differences between global QT rest and in additional single lead representative complexes in a larger number of subjects, measured both by baseline and tangent methods in each lead. Within single leads, no systematic differences were found between baseline and tangent methods of measurement, a distinction that is entirely independent of QRS onset. These findings were all reproducible in the repeat measurement data. It should be noted that our primary findings are shown for rate‐uncorrected QT measurements and are independent of any issues regarding rate correction formulae. Although rate‐corrected QTc values according to the Bazett correction are shown for clinical context, it should be noted that the RR intervals used to correct both the measured global and representative lead QT intervals are from the same 10‐second epoch and are therefore identical for correction of both global and individual lead measurements.
These data have interest beyond technical curiousity because ECG interval measurements have important clinical consequences. Measurement of the QT interval is central to the diagnosis of increasingly numerous forms of acquired and congenital heart disease, 7 including the various long QT syndromes. 8 , 9 , 10 , 11 Automated as well as manual measurement of the QT interval has been used to predict risk of all‐cause and cardiac mortality in a number of recent population studies. 12 , 13 , 14 , 15 , 16 , 17 , 18 , 19 Prolongation of the QT interval has been associated with sudden death after myocardial infarction 39 and with transient or fatal drug‐induced torsades de pointes. 20 , 21 , 22 The QT interval has become a surrogate marker for arrhythmogenic risk in early phase testing of new pharmaceuticals, 23 , 24 , 25 , 26 , 27 and routine evaluation of new drug effects on the QT interval is now mandated by regulatory agencies. 24 , 40 , 41 Detection of QT lengthening in the range of only 5 ms is required for the active control component of a “thorough QT study, 40 and prolongation of QT greater than 10 ms can threaten the continued development of a new drug. 25 , 27 Accordingly, it is necessary to recognize that systematic differences exist between measurement methods, and that these methods are not interchangeable.
In addition, our findings indicate that although most of the difference in QT measurement between global superimposition and single lead methods is explained by later T‐wave offset in another of the superimposed leads, an important contribution to this difference also results from earlier QRS detection in another of the superimposed leads. This is not a result of noise in the high frequency QRS signal. Murray and McLoughlan have previously considered the potential effect of QRS onset measurement error on QT interval duration from noisy single lead tracings, but found the magnitude to be small. 42 The effect of noise in our data is minimized further by the averaging process used in formation of the representative complexes. The larger effect of T‐wave offset is consistent with the well recognized difficulty that exists in the definition and detection of the end of this low frequency waveform, 32 , 33 , 43 as opposed to the simpler detection of the high frequency QRS complex. These differences are highlighted by the much smaller SDs around the time coherent matrix values for QRS onset than for T‐wave offset, as seen in the tables.
Although these observations provide a basis for understanding the magnitude and mechanism of methodological differences in QT determination, our data do not address a number of important questions regarding the practical use of these measurements. We believe that discrepancies between global and single lead representative complexes are likely to be greater in more complex ECG tracings that were not present in our population, such as those with long QT syndrome. On the other hand, our findings are directly applicable to groups with generally normal tracings, such as those involved in early phase drug testing. Unfortunately, the number of subjects in our report precludes any meaningful subdivision into more or less abnormal subgroups, and this distinction will require focused study in a larger series. Because there is no generally accepted electrocardiographic or engineering definition of the QT interval, 27 , 31 , 32 no absolute “gold standard” for this measurement is evident outside of its methodologic context. It can be argued that greatest reproducibility of repeated QT measurements, and greatest sensitivity of repeated measurement to small changes, might serve to best define the most clinical useful method of the QT interval. It is emphasized that our observations are limited to repeat measurement of single ECGs; therefore, our data do not address additional QT interval variability that accompanies repeated ECG recording over time within subjects.
Expert reproducibility is good for all of the QT measurements under the conditions of our study, especially considering the long time interval between repeated measurements. 28 A one‐tailed 95% upper confidence limit of <10 ms for defining a nonsignificant change in corrected QT interval has been endorsed by the US FDA and Health Canada for use in “thorough QT” studies of new drugs. 40 Because the upper confidence limit of paired differences was <5 ms for all QT measurements in the present study, our findings do not strongly suggest that the reproducibility of any one method is necessarily greater or more practical than another in normal subjects. From a theoretical basis, we believe that the global QT in repeated measurements should remain most independent of individual lead noise and variability of lead placement and body position. The small coefficient of variability for serial measurement of global QT provides some support for this position. Because reproducibility of the different measurements may vary in abnormal ECGs, this cannot be extrapolated to drug trials, population studies, or evaluation of individual patients without further clarification.
REFERENCES
- 1. Willems JL, Arnaud P, Van Bemmel JH, et al Assessment of the performance of electrocardiographic computer programs with the use of a reference data base. Circulation 1985;71:523–534. [DOI] [PubMed] [Google Scholar]
- 2. Willems JL, Zywietz C, Arnaud P, et al Influence of noise on wave boundary recognition by ECG measurement programs. Recommendations for preprocessing. Comput Biomed Res 1987;20:543–562. [DOI] [PubMed] [Google Scholar]
- 3. Kors JA, Van Herpen G, Van Bemmel JH. Variability in ECG computer interpretation. Analysis of individual complexes vs analysis of a representative complex. J Electrocardiol 1992;25:263–271. [DOI] [PubMed] [Google Scholar]
- 4. Savelieva I, Yi G, Guo X, et al Agreement and reproducibility of automatic versus manual measurement of QT interval and QT dispersion. Am J Cardiol 1998;81:471–477. [DOI] [PubMed] [Google Scholar]
- 5. Warner RA, Hill NE. Using digital versus analog ECG data in clinical trials. J Electrocardiol 1999;32(Suppl):103–107. [DOI] [PubMed] [Google Scholar]
- 6. Azie NE, Adams G, Darpo B, et al Comparing methods of measurement for detecting drug‐induced changes in the QT interval: Implications for thoroughly conducted ECG studies. Ann Noninvasive Electrocardiol 2004;9:166–174. [DOI] [PMC free article] [PubMed] [Google Scholar]
- 7. Elming H, Brendorp B, Kober L, et al QTc interval in the assessment of cardiac risk. Card Electrophysiol Rev 2002;6:289–294. [DOI] [PubMed] [Google Scholar]
- 8. Moss AJ, Schwartz PJ, Crampton RS, et al The long QT syndrome. Prospective longitudinal study of 328 families. Circulation 1991;84:1136–1144. [DOI] [PubMed] [Google Scholar]
- 9. Hong Y, Rautaharju PM, Hopkins PN, et al Familial aggregation of QT‐interval variability in a general population: Results from the NHLBI Family Heart Study. Clin Genet 2001;59:171–177. [DOI] [PubMed] [Google Scholar]
- 10. Chiang CE. Congenital and acquired long QT syndrome.Current concepts and management. Cardiol Rev 2004;12:222–234. [DOI] [PubMed] [Google Scholar]
- 11. Schwartz PJ, Priori SG, Spazzolini C, et al Genotype‐phenotype correlation in the long‐QT syndrome: Gene‐specific triggers for life‐threatening arrhythmias. Circulation 2001;103:89–95. [DOI] [PubMed] [Google Scholar]
- 12. Schouten EG, Dekker JM, Meppelink P, et al QT interval prolongation predicts cardiovascular mortality in an apparently healthy population. Circulation 1991;84:1516–1523. [DOI] [PubMed] [Google Scholar]
- 13. Dekker JM, Schouten EG, Klootwijk P, et al Association between QT interval and coronary heart disease in middle‐aged and elderly men. The Zutphen Study. Circulation 1994;90:779–785. [DOI] [PubMed] [Google Scholar]
- 14. Algra A, Tijssen JG, Roelandt JR, et al QTc prolongation measured by standard 12‐lead electrocardiography is an independent risk factor for sudden death due to cardiac arrest. Circulation 1991;83:1888–1894. [DOI] [PubMed] [Google Scholar]
- 15. Sharp DS, Masaki K, Burchfiel CM, et al Prolonged QTc interval, impaired pulmonary function, and a very lean body mass jointly predict all‐cause mortality in elderly men. Ann Epidemiol 1998;8:99–106. [DOI] [PubMed] [Google Scholar]
- 16. Elming H, Holm E, Jun L, et al The prognostic value of the QT interval and QT interval dispersion in all‐cause and cardiac mortality and morbidity in a population of Danish citizens. Eur Heart J 1998;19:1391–1400. [DOI] [PubMed] [Google Scholar]
- 17. De Bruyne MC, Hoes AW, Kors JA, et al Prolonged QT interval predicts cardiac and all‐cause mortality in the elderly. The Rotterdam Study. Eur Heart J 1999;20:278–284. [DOI] [PubMed] [Google Scholar]
- 18. Okin PM, Devereux RB, Howard BV, et al Assessment of QT interval and QT dispersion for prediction of all‐cause and cardiovascular mortality in American Indians: The Strong Heart Study. Circulation 2000;101:61–66. [DOI] [PubMed] [Google Scholar]
- 19. Dekker JM, Crow RS, Hannan PJ, et al Heart rate‐corrected QT interval prolongation predicts risk of coronary heart disease in black and white middle‐aged men and women: the ARIC study. J Am Coll Cardiol 2004;43:565–571. [DOI] [PubMed] [Google Scholar]
- 20. Van Haarst AD, Van 't Klooster GA, Van Gerven JM, et al The influence of cisapride and clarithromycin on QT intervals in healthy volunteers. Clin Pharmacol Ther 1998;64:542–546. [DOI] [PubMed] [Google Scholar]
- 21. Morganroth J, Talbot GH, Dorr MB, et al Effect of single ascending, supratherapeutic doses of sparfloxacin on cardiac repolarization (QTc interval). Clin Ther 1999;21:818–828. [DOI] [PubMed] [Google Scholar]
- 22. Yap YG, Camm AJ. Potential cardiac toxicity of H1‐antihistamines. Clin Allergy Immunol 2002;17:389–419. [PubMed] [Google Scholar]
- 23. Haverkamp W, Breithardt G, Camm AJ, et al The potential for QT prolongation and proarrhythmia by non‐antiarrhythmic drugs: Clinical and regulatory implications. Report on a policy conference of the European Society of Cardiology. Eur Heart J 2000;21:1216–1231. [DOI] [PubMed] [Google Scholar]
- 24. Malik M, Camm AJ. Evaluation of drug‐induced QT interval prolongation: Implications for drug approval and labelling. Drug Saf 2001;24:323–351. [DOI] [PubMed] [Google Scholar]
- 25. Shah RR. The significance of QT interval in drug development. Br J Clin Pharmacol 2002;54:188–202. [DOI] [PMC free article] [PubMed] [Google Scholar]
- 26. Gussak I, Litwin J, Kleiman R, et al Drug‐induced cardiac toxicity: Emphasizing the role of electrocardiography in clinical research and drug development. J Electrocardiol 2004;37:19–24. [DOI] [PubMed] [Google Scholar]
- 27. Shah RR. Drugs, QT interval prolongation and ICH E14: The need to get it right. Drug Saf 2005;28:115–125. [DOI] [PubMed] [Google Scholar]
- 28. Sarapa N, Morganroth J, Couderc JP, et al Electrocardiographic identification of drug‐induced QT prolongation: Assessment by different recording and measurement methods. Ann Noninvasive Electrocardiol 2004;9:48–57. [DOI] [PMC free article] [PubMed] [Google Scholar]
- 29. McLaughlin NB, Campbell RW, Murray A. Comparison of automatic QT measurement techniques in the normal 12 lead electrocardiogram. Br Heart J 1995;74:84–89. [DOI] [PMC free article] [PubMed] [Google Scholar]
- 30. McLaughlin NB, Campbell RWF, Murray A. Influence of T wave amplitude on automatic QT measurement. IEEE Comput Cardiol 1995. 1995:777–780. [Google Scholar]
- 31. Xue Q, Reddy S. Algorithms for computerized QT analysis. J Electrocardiol 1998;30(Suppl):181–186. [DOI] [PubMed] [Google Scholar]
- 32. Kautzner J. QT interval measurements. Card Electrophysiol Rev 2002;6:273–277. [DOI] [PubMed] [Google Scholar]
- 33. Murray A, McLaughlin NB, Bourke JP, et al Errors in manual measurement of QT intervals. Br Heart J 1994;71:386–390. [DOI] [PMC free article] [PubMed] [Google Scholar]
- 34. Macfarlane PW, Coleman EN, Pomphrey EO, et al Normal limits of the high‐fidelity pediatric ECG. Preliminary observations. J Electrocardiol 1989;22(Suppl):162–168. [DOI] [PubMed] [Google Scholar]
- 35. Reddy BR, Xue Q, Zywietz C. Analysis of interval measurements on CSE multilead reference ECGs. J Electrocardiol 1996;29(Suppl):62–66. [DOI] [PubMed] [Google Scholar]
- 36. Recommendations for measurement standards in quantitative electrocardiography. The CSE Working Party. Eur Heart J 1985;6:815–825. [PubMed] [Google Scholar]
- 37. Lee KW, Kligfield P, Okin PM, et al Determinants of precordial QT dispersion in normal subjects. J Electrocardiol 1998;31(Suppl):128–133. [DOI] [PubMed] [Google Scholar]
- 38. Kligfield P, Hancock EW, Helfenbein ED, et al Relation of QT interval measurements to evolving automated algorithms from different manufacturers of electrocardiographs. Am J Cardiol 2006;98:88–92. [DOI] [PubMed] [Google Scholar]
- 39. Schwartz PJ, Wolf S. QT interval prolongation as predictor of sudden death in patients with myocardial infarction. Circulation 1978;57:1074–1077. [DOI] [PubMed] [Google Scholar]
- 40. US FDA and Health Canada (ICH Topic E14) . The clinical evaluation of QT/QTc interval prolongation and proarrhythmic potential for non‐antiarrhythmic drugs: Preliminary concept paper, draft 4 (June 10, 2004). Available at: http://www.fda.gov/cder/guidance/6378dft.htm [created October 21, 2004;accessed April 25, 2005] 2004.
- 41. Morganroth J. A definitive or thorough phase 1 QT ECG trial as a requirement for drug safety assessment. J Electrocardiol 2004;37:25–29. [DOI] [PubMed] [Google Scholar]
- 42. Murray A, McLaughlin NB. Variation in the identification of Q wave initiation and its contribution to QT measurement. Physiol Meas 1995;16:39–42. [DOI] [PubMed] [Google Scholar]
- 43. McLaughlin NB, Campbell RW, Murray A. Accuracy of four automatic QT measurement techniques in cardiac patients and healthy subjects. Heart 1996;76:422–426. [DOI] [PMC free article] [PubMed] [Google Scholar]