

Abstract
Background: In long QT syndrome (LQTS), prolonged and heterogeneous ventricular repolarization predisposes to serious arrhythmias. We examined how QT intervals are modified by epinephrine bolus in mutation carriers of three major LQTS subtypes with indefinite QT interval.
Methods: Genotyped, asymptomatic subjects with LQTS type 1 (LQT1; n = 10; four different KCNQ1 mutations), type 2 (LQT2; n = 10; three different HERG mutations), and type 3 (LQT3; n = 10; four different SCN5A mutations), and healthy volunteers (n = 15) were examined. Electrocardiogram was recorded with body surface potential mapping system. After an epinephrine 0.04 μg/kg bolus QT end, QT apex, and T‐wave peak‐to‐end (Tpe) intervals were determined automatically as average of 12 precordial leads. Standard deviation (SD) of the 12 channels was calculated.
Results: Heart rate increased 26 ± 10 bpm with epinephrine bolus, and similarly in all groups. QT end interval lengthened, and QT apex interval shortened in LQTS and normals, leading to lengthening of Tpe interval. However, the lengthening in Tpe was larger in LQTS than in normals (mean 32 vs 18 ms; P < 0.05) and SD of QT apex increased more in LQTS than in normals (mean 23 vs 7 ms; P < 0.01). The increase in Tpe was most pronounced in LQT2, and in SD of QT apex in LQT1 and LQT2.
Conclusions: Abrupt adrenergic stimulation with a moderate dose of exogenous epinephrine affects ventricular repolarization in genotype‐specific fashion facilitating distinction from normals. This delicate modification may help in diagnosing electrocardiographically silent mutation carriers when screening LQTS family members.
Ann Noninvasive Electrocardiol 2011;16(2):172–179
Keywords: LQTS, epinephrine, ventricular repolarization, Tpe interval, QT interval
Congenital long QT syndrome (LQTS) is caused by mutations in different genes coding cardiac ion channel proteins. The most common subtypes LQT1 and LQT2 are caused by mutations in cardiac potassium channels, whereas subtype LQT3 is caused by mutations in cardiac sodium channel. 1 , 2 Delayed and heterogeneous repolarization exposes the patient to torsades de pointes ventricular tachycardia and sudden death. Large variation in QT interval length among the 12 standard electrocardiogram (ECG) leads, called dispersion of repolarization, has been thought to indicate more vulnerable repolarization. 3 Interval between T‐wave apex and end, Tpe interval, has been suggested to signify transmural dispersion of repolarization, which might be a sensitive marker of repolarization. 4 , 5 , 6 , 7
Identification of the disease‐causing mutation confirms the diagnosis of LQTS, but is often unsuccessful, and the diagnosis has to be based on clinical characteristics. 8 , 9 As many of the mutation carriers have normal QT interval at rest, 10 , 11 QT interval dynamics in ambulatory ECG and physical exercise test are looked to assist the diagnosis. 12 , 13 , 14 , 15 Also, administration of natural sympathetic agonist, epinephrine, has been utilized to reveal diagnostic characteristics in ventricular repolarization. Techniques applying epinephrine infusion, the Mayo and the Shimizu protocols, have been advocated. 16 , 17 , 18
We aimed for the first study to use epinephrine as a bolus in examining ventricular repolarization in genotyped LQTS mutation carriers with nondiagnostic ECG phenotype. Multiple precordial ECGs were recorded, and data were measured with automated analysis program in order to achieve high accuracy.
METHODS
Subjects
We included genotyped, asymptomatic LQTS mutation carriers who had normal or nondiagnostic QT interval duration. They were relatives of manifest LQTS patients, otherwise healthy, and had no beta‐blocker or any other medication. The subjects belonged to three LQTS subtype groups consisting of 10 adults, equally male and female. Subjects with LQTS type 1 (LQT1) had four different KCNQ1 mutations, type 2 (LQT2) had three different HERG mutations, and type 3 (LQT3) had four different SCN5A mutations. Fifteen healthy volunteers (eight female) served as a control group. They had no history of syncope, or any cardiovascular disease, and had normal resting ECG and blood pressure.
General
Blood samples for measurements of serum potassium, sodium, creatinine, magnesium, and plasma glucose were taken at the beginning. Blood pressure was measured noninvasively from standard position of arm by using an automatic blood pressure meter (Welch Allyn, Skaneateles Falls, NY). An antecubital vein was cannulated, and physiological saline solution infused. Subjects were lying at a soft bed, and the room was kept silent and dim, in order to achieve restful and comfortable conditions.
Electrocardiogram
We used body surface potential mapping equipment to measure ECG in several precordial channels. Twelve channels were taken for analysis, as shown in Figure 1. ECG was analyzed with an automated program previously validated by our group. 19 , 20 Each ECG lead was first preprocessed by detecting QRS complexes by an amplitude trigger, by determining baseline, and by creating a QRS template. Ventricular premature complexes were rejected. Each QRS‐T deflection was replaced by an averaged QRS‐T deflection including two previous and two following normal heartbeats, using a moving window. After preprocessing, the QRS onset, QT apex and QT end were determined. In case of bifid T waves, the first peak was determined as QT apex. The time between QT apex and QT end intervals was taken as Tpe interval. Finally, intervals were calculated as average of all 12 precordial channels at every heartbeat. The interlead variation was studied by calculating SD of the channels at each heartbeat for QT apex and QT end intervals, signifying dispersion between the leads. At rest, intervals were determined as an average of three consecutive beats, and heart rate‐adjusted QT end interval (QTc) was calculated by using Bazett's formula. 21
Figure 1.

The positions of recording electrodes over anterior chest (black circles; white squares indicate standard chest leads).
After epinephrine administration, QT end and Tpe intervals, and SD of QT apex and QT end were examined at the moment when they were the longest. Because epinephrine caused brief shortening of QT apex, this interval was examined when it was the shortest. At highest heart rate, QT end interval was also adjusted for heart rate by Bazett's formula.
Study Protocol
First, ECG was recorded for 1 minute, and at its end intervals were determined. The subject was given a rapid bolus dose of epinephrine intravenously. After test doses of 0.005, 0.01, 0.02 μg/kg, a study dose of 0.04 μg/kg was given. ECG recording was continued uninterruptedly for 6 minutes, although the heart rate returned to baseline already in less than 90 seconds. The total time for the test was approximately 40 minutes. The test was discontinued in case of arrhythmias (ventricular tachycardia, or 10 or more premature ventricular beats during 1 minute), if systolic blood pressure rose above 200 mmHg, or if T‐wave alternans occurred.
Statistical Analysis
Statistical analyses were carried out using the SPSS PASW Statistics 18 statistical software package (SPSS Inc., Chicago, IL). Data are reported as the mean ± SD. Student's paired t‐test was used to compare phases. Differences between groups were assessed by one‐way analysis of variance coupled with Scheffe's test, and with Mann‐Whitney tests, as appropriate. A P value < 0.05 was considered to signify statistical significance.
The study was approved by the ethical review board of the institution, and was in accordance with the Helsinki Declaration. An informed consent was obtained from all subjects.
RESULTS
General Measures
Study groups were similar in age (LQT1 carriers 36 ± 13 years; LQT2 carriers 42 ± 11 years; LQT3 carriers 34 ± 14 years; and controls 35 ± 9 years). All had normal resting blood pressure, and normal serum potassium, sodium, creatinine, and magnesium, as well as plasma glucose levels.
The four epinephrine doses increased heart rate modestly, with maximum heart rate 80 ±14 bpm after the first, 81 ± 11 bpm after the second, 86 ± 12 bpm after the third, and 90 ± 11 bpm after the fourth dose. All doses were well tolerated, and none of the subjects had arrhythmias exceeding the predefined safety limit. We present the data of the largest dose of 0.04 μg/kg. Smaller doses showed none, or similar, but less pronounced effects.
There was no difference between the groups in heart rate. Neither was there any difference in small increase in blood pressure. Heart rates and blood pressures at rest and after epinephrine are presented in Table 1.
Table 1.
Heart Rate and Blood Pressure at Baseline and after Epinephrine Bolus Injection
| Controls (n = 15) | LQT1 Carriers (n = 10) | LQT2 Carriers (n = 10) | LQT3 carriers (n = 10) | |||||
|---|---|---|---|---|---|---|---|---|
| Baseline | Epinephrine | Baseline | Epinephrine | Baseline | Epinephrine | Baseline | Epinephrine | |
| Heart rate (beats/min) | 62 ± 8 | 89 ± 9* | 67 ± 7 | 92 ± 7* | 65 ± 15 | 90 ± 11* | 64 ± 12 | 88 ± 16* |
| Systolic BP (mmHg) | 126 ± 15 | 127 ± 18 | 124 ± 10 | 125 ± 12 | 129 ± 13 | 129 ± 15 | 123 ± 18 | 129 ± 21 |
| Diastolic BP (mmHg) | 77 ± 9 | 77 ± 9 | 78 ± 8 | 78 ± 9 | 81 ± 8 | 79 ± 9 | 73 ± 8 | 77 ± 11 |
Values are presented as mean ± SD. BP = blood pressure. Statistical significance in comparison to baseline: *P < 0.001.
At baseline, LQTS carriers had slightly longer heart rate‐adjusted QTc intervals than healthy controls (P < 0.05), but they did not differ in Tpe length. In subgroup analysis, LQT2 carriers showed a longer Tpe interval than controls, or other LQTS carriers (P < 0.001; values are given in Table 2).
Table 2.
The QT Intervals, and Standard Deviation of QT End and QT Apex Intervals at Baseline and after Epinephrine 0.04 μg/kg Bolus Injection
| Controls (n = 15) | LQT1 Carriers (n = 10) | LQT2 Carriers (n = 10) | LQT3 Carriers (n = 10) | |||||
|---|---|---|---|---|---|---|---|---|
| Baseline | Epinephrine | Baseline | Epinephrine | Baseline | Epinephrine | Baseline | Epinephrine | |
| QTc interval (ms) | 380 ± 29 | 449 ± 21*** | 413 ± 25 | 477 ± 46*** | 425 ± 33 | 510 ± 64* | 411 ± 32 | 480 ± 40*** |
| QT end interval (ms) | 378 ± 25 | 393 ± 28*** | 394 ± 28 | 409 ± 35* | 413 ± 36 | 460 ± 45*** | 408 ± 50 | 425 ± 50 |
| QT apex interval (ms) | 299 ± 21 | 275 ± 24** | 320 ± 23 | 299 ± 32* | 307 ± 30 | 258 ± 21*** | 333 ± 47 | 294 ± 44** |
| Tpe interval (ms) | 79 ± 8 | 97 ± 15*** | 74 ± 10 | 96 ± 9*** | 106 ± 19 | 150 ± 33** | 75 ± 13 | 105 ± 25** |
| SD of QT end (ms) | 11 ± 8 | 23 ± 14* | 10 ± 7 | 32 ± 21* | 15 ± 16 | 36 ± 20 | 12 ± 11 | 22 ± 16* |
| SD of QT apex (ms) | 12 ± 6 | 18 ± 9 | 10 ± 4 | 33 ± 22** | 17 ± 8 | 47 ± 19*** | 17 ± 10 | 32 ± 22 |
Intervals are presented as mean ± SD.*P < 0.05,**P < 0.01, ***P< 0.001; compared to baseline.
Effects on Ventricular Repolarization
Main Results
In Table 2, we present interval values after epinephrine bolus, and in Table 3 the mean changes in ventricular dispersion parameters. During maximal heart rate, QTc interval was increased in LQTS carriers and also in healthy controls. Tpe interval was lengthened in all groups, but more in LQTS population, separating them from healthy controls (Table 3). The interlead variation in QT apex was also largest in LQTS carriers. The Tpe interval lengthening was pronounced in LQT2 carriers, as also was the interlead variation in QT apex especially in LQT1 and LQT2 carriers.
Table 3.
The Average Change (Δ) of Tpe Interval, and the Average Standard Deviation of QT End and Apex
| Controls (n = 15) | LQTS Carriers (n = 30) | LQT1 Carriers (n = 10) | LQT2 Carriers (n = 10) | LQT3 Carriers (n = 10) | |
|---|---|---|---|---|---|
| Δ Tpe (ms) | 18 | 32* | 23 | 44** | 29 |
| Δ SD of QT end (ms) | 12 | 17 | 22 | 20 | 10 |
| Δ SD of QT apex (ms) | 7 | 23** | 23* | 30** | 15 |
*P < 0.05, **P < 0.01; compared to controls.
Effects within the Groups
Epinephrine lengthened absolute QT end interval in controls, and in LQT1 and LQT2 carriers, but not statistically significantly in LQT3 carriers. Heart rate‐adjusted QTc interval during maximal heart rate was increased. QT apex interval was shortened, and Tpe interval lengthened in all groups. Interlead variation of QT end interval among the 12 precordial ECGs was slightly increased in all groups (P < 0.05, for LQT2 P = 0.055), but of QT apex interval only in LQT1 (P < 0.01) and LQT2 (P < 0.001) groups.
An illustration of changes in heart rate, QT end, QT apex, and Tpe intervals after epinephrine bolus in a LQT2 carrier is presented in Figure 2.
Figure 2.

An example of heart rate behavior, QT apex, QT end, and Tpe intervals in a LQT2 patient. An epinephrine bolus (0.04 μg/kg) was given at the beginning of recording. Note that only 3 minutes of the recording is presented here.
Comparison between the Groups
Similar to resting conditions, LQTS carriers had slightly longer QTc intervals than controls at maximal heart rate (P < 0.05). The Tpe interval and SD of QT apex increased more in LQTS population than in controls (Table 3).
Although LQT2 carriers showed larger increase in QTc interval length (85 ± 83 ms), this was not statistically different from others (64 ± 31 ms in LQT1, 69 ± 38 ms in LQT3, and 69 ± 31 ms in controls). They had a longer absolute QT end interval than controls (P < 0.05), but did not differ statistically from other LQTS carriers. They also had shortest QT apex interval, differing statistically significantly only from LQT1 carriers (P < 0.05).
LQT2 carriers had the longest Tpe interval, separating them from others (P < 0.001 compared to LQT1 carriers or controls; P < 0.01 compared to LQT3 carriers). The absolute change was also largest in LQT2, as seen in Table 3.
The interlead variation of T‐wave apex interval was more pronounced in LQTS population, especially in LQT1 and LQT2. Although LQT1 and LQT2 carriers tended to have a larger dispersion of QT end interval after epinephrine, this was not statistically significant compared to others. Representative examples of interlead variation of QT end and QT apex among the 12 channels in a subject from all four groups are presented in Figure 3.
Figure 3.
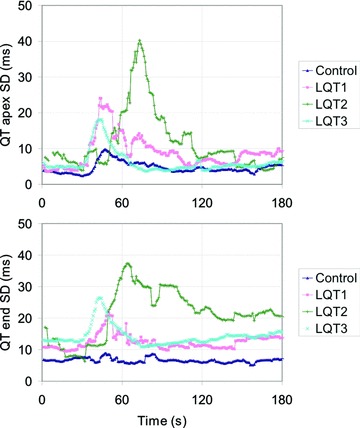
Dispersion of QT apex and QT end among the 12 precordial ECG leads. Representative subjects from each subgroup are presented here, so that slightly later occurring effect in a LQT2 carrier presents individual variation. An epinephrine bolus (0.04 μg/kg) was given at the beginning of recording. Note that only 3 minutes of the recording is presented here.
DISCUSSION
Main Findings
This study highlights alterations in electrocardiographic ventricular repolarization in LQTS mutation carriers with nondiagnostic QT interval duration after a rapid bolus of epinephrine. A moderate dose shortened QT apex interval, and lengthened QT end and Tpe intervals in LQTS gene carriers but also in healthy controls. Noticeable was that the Tpe interval increased more in LQTS mutation carriers than in controls. Also, SD of QT apex interval increased more in LQTS than controls. The influence on Tpe was most pronounced in LQT2 carriers, and SD of QT apex in LQT1 and LQT2 carriers.
Methodological Considerations
We aimed to create a test method to mimic modest sympathetic excitation, in order to investigate sensitive components of ventricular repolarization. Epinephrine is a natural α‐ and β‐adrenoceptor agonist. We decided to use bolus doses, as intravenous infusion is known to produce secondary effects like hypokalemia and hypomagnesemia, 22 which could consistently modify ventricular repolarization.
Comparison to Previous Studies
This is the first study where epinephrine as a bolus only was used to enhance diagnosis of LQTS. Our group has previously found that epinephrine infusion increases QT interval dispersion in symptomatic LQTS patients of mixed genotype. 23
Two protocols with epinephrine infusion with adequate sensitivity and specificity values have been published: the Shimizu protocol and the Mayo protocol. In the protocol by Shimizu, the test begins with an epinephrine bolus of 0.1 μg/kg followed by immediate infusion of 0.1 μg/kg per minute. They have reported lengthening of heart rate‐adjusted QT and Tpe intervals, with more pronounced effects in LQT1 group compared to LQT2. 24 Later, they showed how the protocol may distinguish latent LQT1 mutation carriers, 17 and also help to distinguish LQT2 patients with transient QTc prolongation during peak epinephrine effect. 18 We examined intervals without heart rate correction, because QT interval does not immediately adapt to rapid heart rate elevation. 25
In Mayo protocol, an epinephrine infusion without a bolus is used and QT intervals are not adjusted for heart rate. A low‐dose epinephrine infusion (0.05 μg/kg per minute) caused marked prolongation in absolute QT interval in LQT1 patients and shortening in combined LQT2 and LQT3 groups. At higher doses, infusion caused paradoxical QT prolongation in some controls. The QTc interval showed no discriminative value for diagnosing. 16
Both aforementioned protocols seem to be similarly effective in predicting LQT1 genotype, and the first may help to find LQT2 form. 18 , 26 Our test shows that QT end interval seems to be rigid parameter to examine delicate changes in ventricular repolarization, lacking discriminating ability. There was significant overlapping in the change of QTc interval, even shortening in some subjects. Importantly, QT apex interval was shortened, leading to markedly prolonged Tpe interval. The lengthening of Tpe interval was greater in LQTS carriers, separating them from healthy. In subgroup analysis, LQT2 carriers could be distinguished from others.
The major difference between these previously published epinephrine tests and our test is the dosing of epinephrine. In epinephrine infusion tests, intervals are examined after minutes of infusion, 27 whereas we studied instant effects. Our bolus test with a small epinephrine dose of 0.04 μg/kg is able to reveal LQTS mutation status, particularly in LQT2, whereas epinephrine infusion test by Mayo protocol with larger doses indicate LQT1 subtype.
The Concept of Tpe
The repolarization of the epicardial cells has been proposed to coincide with QT apex, and repolarization of the mid‐myocardial M cells with the QT end, so that the Tpe interval would provide a measure of transmural dispersion of repolarization. 28 In experimental models, β‐adrenergic stimulation has been shown to abbreviate action potential duration of epi‐ and endocardial, but not M cells, leading to accentuation of transmural dispersion of repolarization in LQT1 and LQT2 but not in LQT3. 29 , 30
In this study, interlead dispersion of repolarization among the 12 precordial leads became larger, signifying more chaotic repolarization pattern. This supports that ventricular repolarization is completed variably in different areas of the heart. Probably Tpe interval is not only a marker of transmural but also local differences in repolarization time, and thus adequately reflects repolarization inhomogeneity. Tpe interval may discriminate LQTS carriers under changing physical conditions, as previously shown. 31 , 32
Limitations
The purpose of our study was to examine whether epinephrine bolus test can elicit diagnostic changes in LQTS gene mutation carriers who lack diagnostic QT interval lengthening in ECG. Therefore, the results cannot be readily transferred to patients with marked QT interval prolongation. We decided to determine the first peak of the T wave as QT apex. The bifid T waves, being most common in LQT2 genotype, may increase abnormality of the Tpe. The phenomenon was revealed using multiple ECG leads and an accurate analysis program and may thus not be readily recognized from standard ECG. Larger patient cohorts are needed for validating reference values. Cardiac ultrasonography was not performed in LQTS patients, and therefore left ventricular hypertrophy, which could influence repolarization, was not definitely excluded.
CONCLUSIONS
This is the first study where an injection on modest dose of epinephrine was used to reveal delicate repolarization abnormalities in LQTS carriers who have nondiagnostic ECG phenotype. Tpe interval, signifying the repolarization process itself, is a more sensitive marker than plain QT interval, which measures only the global ending of repolarization. Because of its easy and safe nature, an epinephrine injection test could be used to support affection status in family members of LQTS patients, and to direct molecular genetic analysis in suspected LQTS patients with unknown subtype. Further studies with larger population will allow creating cutoff values for clinical work.
This study was supported by Aarne Koskelo Foundation, and Helsinki University Hospital Research Funds.
REFERENCES
- 1. Lehnart S, Ackerman M, Benson W, et al Inherited arrhythmias. Circulation 2007;116:2325–2345. [DOI] [PubMed] [Google Scholar]
- 2. Zareba W, Cygankiewicz I. Long QT syndrome and short QT syndrome. Prog Cardiovasc Dis 2008;51:264–278. [DOI] [PubMed] [Google Scholar]
- 3. Rautaharju P, Surawicz B, Gettes L. AHA/ACCF/HRS recommendations for the standardization and interpretation of the electrocardiogram. Circulation 2009;119:e241–e250. [DOI] [PubMed] [Google Scholar]
- 4. Shimizu W, Antzelevitch C. Sodium channel block with mexiletine is effective in reducing dispersion of repolarization and preventing torsade de pointes in LQT2 and LQT3 models of the long QT syndrome. Circulation 1997;96:2038–2047. [DOI] [PubMed] [Google Scholar]
- 5. Antzelevitch C, Oliva A. Amplification of spatial dispersion of repolarization underlies sudden cardiac death associated with catecholaminergic polymorphic VT, long QT, short QT and Brugada syndromes. J Int Med 2006;259:48–58. [DOI] [PMC free article] [PubMed] [Google Scholar]
- 6. Antzelevitch C. Drug‐induced spatial dispersion of repolarization. Cardiology J 2008;15:100–121. [PMC free article] [PubMed] [Google Scholar]
- 7. Killeen MJ, Sabir IN, Grace AA, et al Dispersions of repolarization and ventricular arrhythmogenesis: Lessons from animal models. Prog Biophys Mol Bio 2008;98:219–229. [DOI] [PubMed] [Google Scholar]
- 8. Schwarz PJ, Moss AJ, Vincent GM, et al Diagnostic criteria for the long QT syndrome. An update. Circulation 1993;88:782–784. [DOI] [PubMed] [Google Scholar]
- 9. Schwarz PJ, Priori SG, Spazzolini C, et al Genotype‐phenotype correlation in the long QT syndrome. Gene‐specific triggers for life‐threatening arrhythmias. Circulation 2001;103:89–95. [DOI] [PubMed] [Google Scholar]
- 10. Moss AJ, Robinson J. Clinical features of the idiopathic long QT syndrome. Circulation 1992;85:140–144. [PubMed] [Google Scholar]
- 11. Priori SG, Napolitano C, Schwarz P. Low penetrance in the long QT syndrome: Clinical impact. Circulation 1999;99:529–533. [DOI] [PubMed] [Google Scholar]
- 12. Viitasalo M, Oikarinen L, Väänänen H, et al Differentiation between LQT1 and LQT2 patients and unaffected subjects using 24 –hour electrocardiographic recordings. Am J Cardiol 2002;89:679–685. [DOI] [PubMed] [Google Scholar]
- 13. Zhang L, Timothy K, Vincent GM, et al Spectrum of ST‐T wave patterns and repolarization parameters in congenital long QT syndrome. Circulation 2000;102:2849–2855. [DOI] [PubMed] [Google Scholar]
- 14. Schwarzt PJ, Priori SG, Locati EH, et al Long QT syndrome patients with mutation of the SCN5A and HERG genes have differential responses to Na+ channel blockade and to increases in heart rate: Implications for gene‐specific therapy. Circulation 1995;92:3381–3386. [DOI] [PubMed] [Google Scholar]
- 15. Schwarz P. The congenital long QT syndromes from genotype to phenotype: Clinical implications. J Int Med 2006;259:39–47. [DOI] [PubMed] [Google Scholar]
- 16. Ackerman MJ, Khositseth A, Tester DJ, et al Epinephrine‐induced QT interval prolongation: A gene‐specific paradoxical response in congenital long QT syndrome. Mayo Clin Proc 2002;77:413–421. [DOI] [PubMed] [Google Scholar]
- 17. Shimizu W, Takashi N, Takaki H, et al Epinephrine unmasks latent mutation carriers with LQT1 form of congenital long QT syndrome. J Am Coll Cardiol 2003;41:633–642. [DOI] [PubMed] [Google Scholar]
- 18. Shimizu W, Noda T, Takaki H, et al Diagnostic value of epinephrine test for genotyping LQT1, LQT2, and LQT3 forms of congenital long QT syndrome. Heart Rhythm 2004;1:276–283. [DOI] [PubMed] [Google Scholar]
- 19. Oikarinen L, Paavola M, Montonen J, et al Magnetocardiographic QT interval dispersion in postmyocardial infarction patients with sustained ventricular tachycardia: Validation of automated QT measurements. PACE 1998;21:1934–1942. [DOI] [PubMed] [Google Scholar]
- 20. Hekkala AM, Väänänen H, Swan H, et al Reproducibility of computerized measurements of QT–interval from multiple leads at rest and during recovery. Ann Noninvasive Electrocardiol 2006;11:318–326. [DOI] [PMC free article] [PubMed] [Google Scholar]
- 21. Bazett HC. An analysis of the time‐relations of electrocardiograms. Heart 1920;7:353–370. [Google Scholar]
- 22. Darbar D, Smith M, Mörike K, et al Epinephrine‐induced changes in serum potassium and cardiac repolarization and effects of pre‐treatment with propranolol and diltiazem. Am J Cardiol 1996;77:1351–1355. [DOI] [PubMed] [Google Scholar]
- 23. Sun Z‐H, Swan H, Viitasalo M, et al Effects of epinephrine and phenylephrine on QT interval dispersion in congenital long QT syndrome. J Am Coll Cardiol 1998;31:1400–1405. [DOI] [PubMed] [Google Scholar]
- 24. Tanabe Y, Inagaki M, Kurita T, et al Sympathetic stimulation produces a greater increase in both transmural and spatial dispersion of repolarization in LQT1 than LQT2 forms of congenital long QT syndrome. J Am Coll Cardiol 2001;37:911–919. [DOI] [PubMed] [Google Scholar]
- 25. Toivonen L, Helenius K, Viitasalo M. Electrocardiographic repolarization during stress from awakening on alarm call. J Am Coll Cardiol 1997;30:774–779. [DOI] [PubMed] [Google Scholar]
- 26. Vyas H, Hejlik J, Ackerman MJ. Epinephrine QT stress testing in the evaluation of congenital long QT syndrome: Diagnostic accuracy of the paradoxical QT response. Circulation 2006;113:1385–1392. [DOI] [PubMed] [Google Scholar]
- 27. Vyas H, Ackerman MJ. Epinephrine QT stress testing in congenital long QT syndrome. J Electrocardiol 2006;39:107–113. [DOI] [PubMed] [Google Scholar]
- 28. Yan G‐X, Antzelevitch C. Cellular basis for the normal T wave and the electrocardiographic manifestations of the long QT syndrome. Circulation 1998;98:1928–1936. [DOI] [PubMed] [Google Scholar]
- 29. Shimizu W, Antzelevitch C. Cellular basis for the ECG features of the LQT1 form of the long QT syndrome: Effects of b‐adrenergic agonists and antagonists and sodium channel blockers on transmural dispersion of repolarization and torsades de pointes. Circulation 1998;98:2314–2322. [DOI] [PubMed] [Google Scholar]
- 30. Shimizu W, Antzelevitch C. Differential effects of beta‐adrenergic agonists and antagonists in LQT1, LQT2 and LQT3 models of the long QT syndrome. J Am Coll Cardiol 2000;35:778–786. [DOI] [PubMed] [Google Scholar]
- 31. Viitasalo M, Oikarinen L, Swan H, et al Ambulatory electrocardiographic evidence of transmural dispersion of repolarization in patients with long QT syndrome type 1 and 2. Circulation 2002;106:2473–2478. [DOI] [PubMed] [Google Scholar]
- 32. Viitasalo M, Oikarinen L, Swan H, et al Effects of beta‐blocker therapy on ventricular repolarization documented by 24‐h electrocardiography in patients with type 1 long QT syndrome. J Am Coll Cardiol 2006;48:747–753. [DOI] [PubMed] [Google Scholar]