

Abstract
Background: Prolonged QRS duration has been used as a marker for left ventricular (LV) systolic dysfunction (SD) and is used in the evaluation of patients presenting with known or suspected heart failure. The goal of this study was to compare the abilities of QRS duration and simultaneous digital ECG and heart sounds, that is acoustic cardiographic, parameters to identify patients with LV dysfunction.
Methods: Our learning population consisted of 171 patients with possible chronic compensated or mildly decompensated heart failure who presented to an ambulatory cardiology clinic for echocardiographic examination. We defined LVSD as a LV ejection fraction < 50%, and estimated LV filling pressures from diastolic measurements. These patients also had acoustic cardiographic recordings from which we obtained a variety of individual ECG and acoustic cardiographic parameters. We used the product of four of these parameters to obtain a diagnostic score for LV dysfunction. We then compared the diagnostic performances of QRS duration and the score on a test population of patients who presented to an emergency department with possible heart failure.
Results: In the learning population, the sensitivities/specificities of QRS duration ≥120 ms and the score for prediction of LVSD were 51%/92% and 77%/90%, respectively. In the test population, the score remained superior to QRS duration for detecting LVSD as well as acute decompensated heart failure.
Conclusions: Improved identification of LVSD and clinical heart failure can be achieved with a cost‐effective bedside screening tool with the simple combination of simultaneously acquired digital ECG and heart sound data.
Keywords: QRS duration, acoustic cardiography, systolic dysfunction
Since it is commonly associated with heart failure, the detection of left ventricular (LV) systolic dysfunction (SD) is important in a variety of clinical settings. Both invasive and noninvasive techniques such as angiography, echocardiography, and radionuclide studies are used to measure LV systolic function, but they are expensive and often not always readily available. 1 Therefore, because electrical abnormalities, such as QRS prolongation are often associated with hemodynamic impairment, the ubiquitous and less costly electrocardiogram (ECG) is commonly used to suggest the presence of LVSD. For example, prolonged QRS duration (≥120 ms) has been used to evaluate patients with suspected systolic heart failure and is used as a standard selection criterion for cardiac resynchronization therapy. 2
Other investigators have shown that prolonged QRS duration is associated with an adverse prognosis in heart failure 3 , 4 , 5 and in the general population. 6 In addition, prolonged QRS duration is associated with increased LV mass and volume and with advanced LV remodeling in patients with coronary artery disease and poor LV function, 7 , 8 including impaired LV ejection fraction. 9
Although the entire QRS interval has been most widely used, its first portion alone has also been employed. The QR interval, the time in ms from the onset of the QRS to the peak of the R wave (also called the “intrinsicoid deflection” when it is measured in the precordial leads), is part of the Romhilt–Estes criteria for the ECG detection of LV enlargement 10 and is one of the criteria for left bundle branch block (LBBB). Both LV enlargement and LBBB are often associated with LV dyssynchrony and reduced ejection fraction (EF). Despite the above associations, the relationship between ECG and hemodynamic abnormalities is indirect, as evidenced by the fact that patients may have intraventricular conduction defects in the absence of either systolic or diastolic LV dysfunction.
However, other investigators have demonstrated a more direct relationship between abnormal diastolic heart sounds, especially the S3, and LVSD 11 , 12 , 13 , 14 , 15 and elevated LV end‐diastolic pressure. 16 , 17 Systolic time intervals obtained using simultaneous digital ECG and heart sounds data, have also been shown to be associated with low cardiac output, 18 reduced stroke volume, 19 , 20 elevated LV end‐diastolic volume 21 and reduced ejection fraction. 22 A recently developed technology, acoustic cardiography (Audicor, Inovise Medical, Inc., Portland, OR), allows the automated detection of diastolic sounds and the measurement of systolic time intervals in a simple and low‐cost system that uses data acquired in conjunction with the recording of a standard 12‐lead ECG.
The purpose of this study was to compare the ability of the ECG alone versus acoustic cardiographic parameters to detect LV dysfunction in an ambulatory clinic and an emergency department population.
METHODS
Subjects
Learning Set Data from Ambulatory Clinic
We enrolled 175 ambulatory patients (119 men, mean age 64, range 19–88 years) who had been referred to ambulatory cardiology clinics in Switzerland for Doppler echocardiographic evaluation for possible LV dysfunction. Four patients were excluded due to poor quality ECG and/or acoustic cardiographic data. Analysis was completed on the remaining 171 patients.
The local Medical Ethics Commissions of Aargau and Zurich, Switzerland approved the protocol for the study and all patients gave written informed consent prior to enrollment.
Within 1 hour of the Doppler echocardiography, each patient had B‐type natriuretic peptide (BNP) measured (Biosite Triage, Biosite, Incorporated, San Diego, CA) and acoustic cardiographic data recorded using the Audicor® device (Inovise Medical, Inc.).
Doppler Echocardiographic Examination
Each patient had a complete two‐dimensional Doppler echocardiographic examination according to the guidelines of the American Society of Echocardiography. Systolic LV dysfunction was defined as LV ejection fraction of less than 50%. Diastolic function was evaluated by the transmitral LV filling pattern, including maximal E‐ and A‐wave velocities, the E/A ratio, the deceleration time of the E wave, the duration of the A wave, the pulmonary venous flow pattern, and tissue Doppler examination of the lateral mitral annulus for E' and E/E' ratio. Diastolic function was categorized as normal, delayed relaxation, pseudonormal, or restrictive. To identify the presence of elevated LV filling pressure, we used the Doppler echocardiographic findings according to the method described by Ommen and Nishimura. 23
The investigators interpreted the Doppler echocardiographic findings blinded to the BNP, acoustic cardiographic data, and other clinical data.
BNP and Clinical Data
BNP levels were measured in each patient after 30 minutes in the supine position using the Biosite Triage test. Additional clinical data was recorded for each patient by the investigator on a standardized clinical data form.
Acoustic Cardiographic and ECG Data
The Audicor device (Inovise Medical, Inc.) was used for acoustic cardiography. This device uses the standard array of 12‐lead ECG electrodes, but employs unique dual‐purpose sensors in the V3 and V4 positions. These sensors simultaneously acquire V3 and V4 ECG as well as cardiac acoustical data from the region of the LV apex. The Audicor system produces a variety of measurements, including the presence and strength of S3 energy and the electromechanical activation time (EMAT)—the time in ms from the onset of the QRS to the mitral component of the S1 (see Fig. 1). EMAT includes the LV isovolumic contraction period and is the time required for ventricular contraction to close the mitral valve. It is prolonged in the presence of LVSD as indicated by reduced dp/dt.
Figure 1.
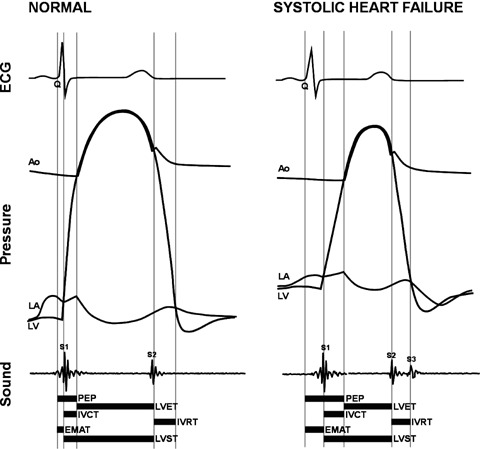
Relationship of traditional systolic time intervals to acoustic cardiographic systolic parameters. Normal versus LVSD EMAT = electromechanical activation time; LA = left atrium; LV = left ventricle; LVET = left ventricular ejection time; LVST = left ventricular systolic time; PEP = preejection period.
We retrospectively evaluated the following parameters of LV function, both individually and in combination with each other:
-
1
S3 Strength: a continuous parameter that is based on a computerized measurement of the magnitude and persistence of acoustical energy in a range of frequencies and in a temporal window compatible with an S3, that is up to 130 ms. after the second heart sound and with a range of values from 0 to 10.
-
2
%EMAT: EMAT/RR Interval, that is the proportion of the cardiac cycle occupied by EMAT
-
3
Left ventricular systolic time (LVST): the interval in ms. between S1 and S2.
-
4
EMAT/LVST : the proportion of systole occupied by EMAT
-
5
QRS duration: a computerized measurement of the global QRS onset to QRS offset from a standard 10‐second 12‐lead ECG recording.
-
6
QR interval : also a computerized measurement on lead V5 from QRS onset to the peak of the R wave (or S wave for QS morphologies).
-
7
A multiplicative combination of four acoustic cardiographic parameters:
-
8
(QRS Duration)* (QR interval)*(S3 Strength)* (%EMAT)
-
9
Other ECG parameters were evaluated including Cornell voltage, Cornell product, spatial vector magnitude constructed from ST segment measurements, and the maximum P negative area from lead V1 or V2 as a measure of atrial overload. 10
Test Population: Emergency Department Patients Presenting with Acute Shortness of Breath
This study design has been described elsewhere in detail 24 and had been approved by the Medical Ethics Committees of the University of Cincinnati and the Cleveland Clinic. In brief, a prospective convenience sample of 399 patients who presented with signs or symptoms of decompensated heart failure (dyspnea, extremity edema, fatigue) were enrolled after providing informed written consent. An acoustic cardiographic recording was performed along with BNP and other standard laboratory and clinical examinations. A subset of these patients (n = 57) had echocardiographic determination of LV ejection fraction. Pertinent clinical data were collected by chart review. Retrospective record review was performed by two cardiology fellows who were blinded to all BNP and heart sound data to determine each patient's final diagnoses, that is heart failure versus nonheart failure, during his acute ED presentation. The final diagnoses were determined to be primary heart failure (n = 151), secondary heart failure (n = 76), or nonheart failure (n = 172).
Statistical Analysis
Descriptive statistics include the frequencies and percentages for categorical data and the mean ± standard deviation for continuous data. We tested the null hypothesis for any differences between groups using the unpaired t‐test for continuous data and chi‐square analysis for dichotomous data. We, a priori chose P values < 0.05 to be statistically significant. In the learning set of clinic data, we analyzed receiver‐operating characteristic (ROC) curves to determine the areas under the curves and the values of the ECG and acoustic cardiographic parameters that produced 90% specificity as well as the sensitivities that were associated that level of specificity. We applied the same value of the multiplicative combination of acoustic electrocardiographic parameters obtained in the learning set of clinic patients to the patients in the test set of ED patients.
To further evaluate the diagnostic performances of each parameter, we also calculated the positive and negative likelihood ratios using the following formulae:
Positive likelihood ratio = sensitivity/(1−specificity)
Negative likelihood ratio = specificity/(1−sensitivity)
Unlike positive and negative predicitive values, diagnostic inferences based on positive and negative likelihood ratios are independent of the prevalence of the abnormality in the population being tested. 27
We performed the statistical analyses using SPSS Version 13.0 (SPSS, Inc., Chicago, IL), Microsoft Excel 2000 (Microsoft, Seattle, WA), and Microsoft Access 2000 (Microsoft).
RESULTS
Table 1 shows the data for the 171 patients who compose the learning set of clinic data for the entire group and for each of the subgroups LV ejection fraction ≥50% versus < 50% and with and without elevated estimated LV filling pressure for all EF and those with LV EF < 50%. It shows that compared to the subgroup with higher ejection fractions, the patients with LVSD had a higher proportion of males, faster heart rates, a higher proportion of LBBB, longer QRS durations and QR intervals, higher values of BNP, greater E/E' ratios, greater estimated LV end‐diastolic pressures, LV mass indices, end‐diastolic diameters, volumes and wall motion scores, a greater prevalence of S3, and greater values of S3 strength and % EMAT.
Table 1.
Learning Set of Clinic Patients, Findings for the Entire Population and for Patients with LV Ejection Fraction ≥50% versus < 50% and Elevated Estimated LV Filling Pressure
| All Patients | EF≥50 | EF < 50 | Elev. LV Filling Pressure with Any EF | Elev. LV Filling Pressure with EF < 50 | |
|---|---|---|---|---|---|
| N | 171 | 85 | 86 | 32 | 27 |
| Left ventricular EF (%) | 48 ± 17 | 63 ± 7 | 34 ± 10∧ | 35 ± 14 | 30 ± 7 |
| Age (year) | 64 ± 13 | 66 ± 13 | 63 ± 12 | 65 ± 12 | 66 ± 12 |
| % Male | 67.8 | 57.6 | 77.9+ | 81.3 | 85.2 |
| Heartrate (bpm) | 65 ± 12 | 63 ± 9 | 68 ± 14+ | 69 ± 15 | 70 ± 16 |
| LBBB % | 12.9 | 1.2 | 24.4∧ | 28.1 | 33.3 |
| QRSdur (ms) | 117 ± 31 | 101 ± 16 | 132 ± 35∧ | 135 ± 39 | 142 ± 38 |
| QR interval in V5 (ms) | 48 ± 19 | 40 ± 6 | 57 ± 23∧ | 63 ± 24 | 66 ± 24 |
| BNP (pg/ml) | 209 ± 374 | 110 ± 174 | 307 ± 481∧ | 665 ± 664 | 697 ± 697 |
| E/A | 1.05 ± 0.69 | 0.97 ± 0.46 | 1.12 ± 0.86 | 1.89 ± 1.01 | 1.95 ± 1.08 |
| E/E′ | 10.1 ± 7.4 | 7.4 ± 3.2 | 10.6 ± 7.3∧ | 14.0 ± 9.9 | 15.1 ± 10.3 |
| Deceleration time (ms) | 239 ± 119 | 237 ± 89 | 241 ± 144 | 153 ± 47 | 154 ± 51 |
| Diastolic filling pattern (%) | |||||
| Normal | 20.5 | 27.1 | 13.9 | 0 | 0 |
| Delayed relaxation | 62.0 | 67.1 | 57.0 | 6.3 | 7.4 |
| Pseudonormal | 12.3 | 5.9 | 18.6 | 65.6 | 59.3 |
| Restrictive | 5.3 | 0 | 10.5 | 5.1 | 5.7 |
| Elevated LVEDP (%) | 18.7 | 5.9 | 31.4* | 28.1 | 33.3 |
| Left ventricular mass index | 117 ± 41 | 103 ± 31 | 127 ± 40∧ | 124 ± 40 | 128 ± 40 |
| Left ventricular end‐diastolic diameter (mm) | 55 ± 10 | 48 ± 4.7 | 62 ± 9.7∧ | 61 ± 11.6 | 65 ± 10.3 |
| Left ventricular end‐diastolic volume (ml) | 133 ± 71 | 91 ± 28 | 175 ± 77∧ | 178 ± 82 | 197 ± 75 |
| Wall motion score (normal ≥26) | 16 ± 8 | 26 ± 1.0 | 11 ± 5∧ | 11 ± 7 | 8 ± 4 |
| S3 present (%) | 21.6 | 10.6 | 32.6∧ | 62.5 | 70.4 |
| S3 strength | 4.4 ± 1.3 | 4.0 ± 0.8 | 4.8 ± 1.5∧ | 5.8 ± 1.7 | 6.1 ± 1.7 |
| %EMAT | 11 ± 3.2 | 9.3 ± 1.9 | 12.3 ± 3.6∧ | 12.7 ± 3.9 | 13.3 ± 3.9 |
*P < 0.05, +P < 0.01, ∧P < 0.001 for LV ejection fraction ≥ 50% versus < 50%.
Abbreviations: EF = ejection fraction; LBBB = left bundle branch block; QRSdur = QRS duration; BNP = B‐type natriuetic peptide; LVEDP = left ventricular end‐diastolic pressure; %EMAT = electromechanical activation time divided by the R to R interval.
Table 1 also shows that patients with elevated estimated LV filling pressure had lower LV ejection fractions, a higher proportion of LBBB, greater QR intervals, LV end‐diastolic diameters and volumes, and S3 Strength.
Table 2 shows the data obtained from the ROC curves of various ECG and acoustic electrocardiographic parameters in the learning set of clinic patients. It shows the areas under the ROC curves and the sensitivities at 90% specificity for detecting LVSD and for detecting elevated estimated LV filling pressures in patients with and without concomitant LVSD. For the detection of LVSD, the performance of QRS duration exceeds that of other ECG parameters, but is inferior to the multiplicative combination of four acoustic cardiographic parameters. Figure 2 shows the ROC curves for detecting LVSD of QRS duration and the multiplicative score, respectively. The curve for QRS duration indicates the diagnostic performances at two different threshold values. Figure 3 shows the ROC curves for detecting elevated LV filling pressure of QRS duration and the multiplicative score, respectively. The curve for QRS duration indicates the diagnostic performances at two different threshold values. In both Figures 2 and 3, the areas under the ROC curves are greater for the multiplicative score than for QRS duration. For detecting elevated estimated LV filling pressure associated with LVSD, the performance of the multiplicative combination of acoustic cardiographic parameters is 99% sensitivity at 90% specificity with an area under the curve of 0.99. (Table 2).
Table 2.
Comparison of Performance of ECG and Acoustic Cardiographic Parameters to Detect LV Systolic Dysfunction and Elevated LV Filling Pressures, All QRS Durations
| For Elevated LV Filling Pressure | ||||||
|---|---|---|---|---|---|---|
| For EF < 50% | All EF | EF < 50% | ||||
| AUC | Sensitivity at 90% Specificity | AUC | Sensitivity at 90% Specificity | AUC | Sensitivity at 90% Specificity | |
| QRS duration | 0.82 | 59% (113 ms) | 0.68 | 39% (151 ms) | 0.87 | 67% (114 ms) |
| QR interval | 0.80 | 55% (47 ms) | 0.77 | 50% (59 ms) | 0.89 | 74% (46 ms) |
| S3 strength | 0.62 | 32% (5.1) | 0.83 | 55% (5.3) | 0.88 | 70% (5.0) |
| % EMAT | 0.78 | 43% (12.3) | 0.68 | 32% (14.4) | 0.83 | 56% (12.4) |
| EMAT/LVST | 0.80 | 48% (0.33) | 0.72 | 40% (0.36) | 0.85 | 62% (0.33) |
| S3 strength* QRS duration | 0.80 | 57% (528) | 0.84 | 50% (672) | 0.97 | 95% (536) |
| Cornell voltage | 0.69 | 34% (2363) | 0.58 | 5% (3483) | 0.75 | 55% (2348) |
| Cornell product | 0.74 | 41% (245148) | 0.59 | 6% (375212) | 0.79 | 40% (252467) |
| Max (P negative area V1, V2) | 0.47 | 6% (6589) | 0.66 | 28% (5726) | 0.62 | 16% (6511) |
| ST segment spatial vector magnitude* | 0.77 | 41% (169) | 0.65 | 15% (243) | 0.82 | 52% (171) |
| QRSdur* Qrint* S3Strength*%EMAT | 0.88 | 77% (199668) | 0.84 | 55% (466666) | 0.99 | 99% (196558) |
*Spatial vector magnitude is the square root of (STJ20_aVF∧2+STJ20_V2∧2+STJ20_V5∧2).
EMAT = electromechanical activation time; %EMAT = EMAT divided by the R to R interval; LVST = left ventricular systolic time.
Figure 2.
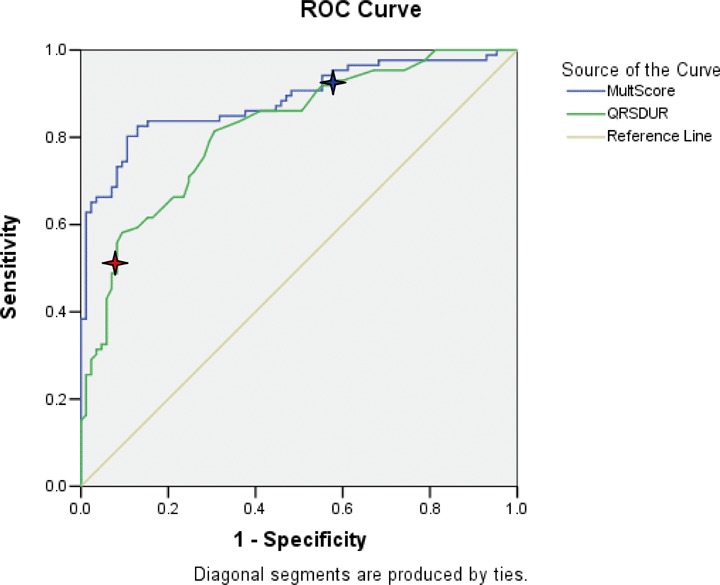
ROC curves for detecting EF < 50% of QRS duration (AUC = 0.82). and multiplicative score (AUC = 0.89). Red star at QRS = 120 ms (Sensitivity 51%, Specificity 92%). Blue star at QRS = 100 ms (Sensitivity 86%, Specificity 59%). Abbreviations for Figure 1: AUC = area under the curve; EF = ejection fraction; MultScore = Multiplicative Score; QRSDUR = QRS duration; ROC = receiver operating characteristic.
Figure 3.
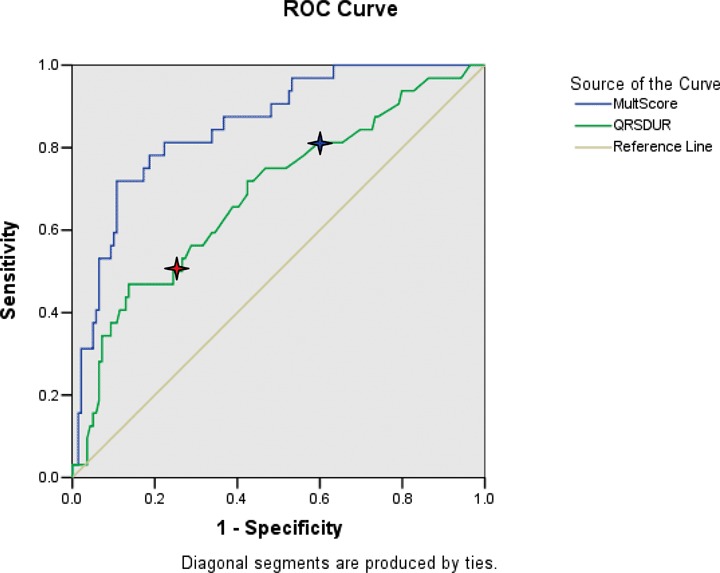
ROC curves for detecting elevated LV filling pressure of QRS duration (AUC = 0.69). and multiplicative score (AUC = 0.84) Red star at QRS = 120 ms (Sensitivity 50%, Specificity 75%). Blue star at QRS = 100 ms (Sensitivity 81%, Specificity 40%). Abbreviations for Figure 1: AUC = area under the curve; LV = left ventricular; MultScore = Multiplicative Score; QRSDUR = QRS duration; ROC = receiver operating characteristic.
Figure 4 shows the quantitative relationship between LV ejection fraction and log(QRS duration) in patients both with and without elevated LV filling pressure. There is a trend for lower EF with longer QRS duration (R2= 0.30). Figure 5 shows the quantitative relationship between Doppler E/A ratio and S3 Strength in patients both with and without elevated LV filling pressure. Figure 6 reveals a strong quantitative relationship between isovolumic relaxation time and QR interval. Figure 7 shows a strong curvilinear relationship between LV ejection fraction and the multiplicative score, with most patients with LV ejection fraction >50% having a score < 200,000.
Figure 4.
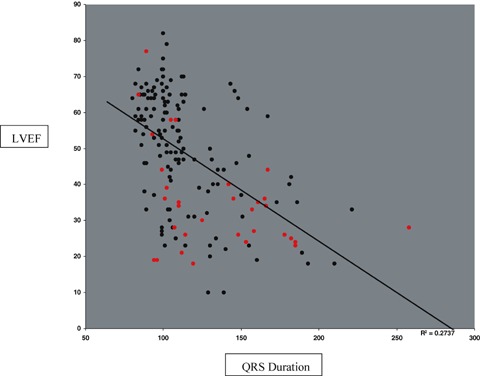
Log(QRS Duration) versus LVEF with red dots indicating those with elevated LV filling pressures (R squared = 0.30).
Figure 5.
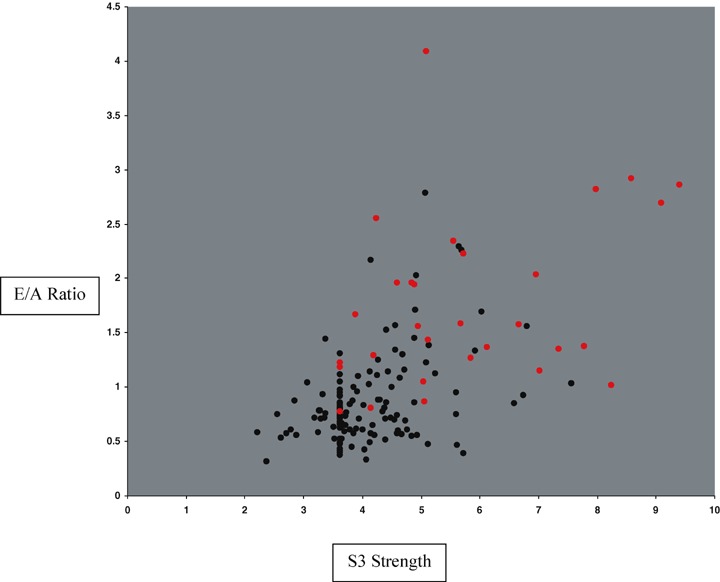
S3 strength (horizontal axis) versus E/A ratio (vertical axis) with red dots indicating those with elevated LV filling pressures.
Figure 6.
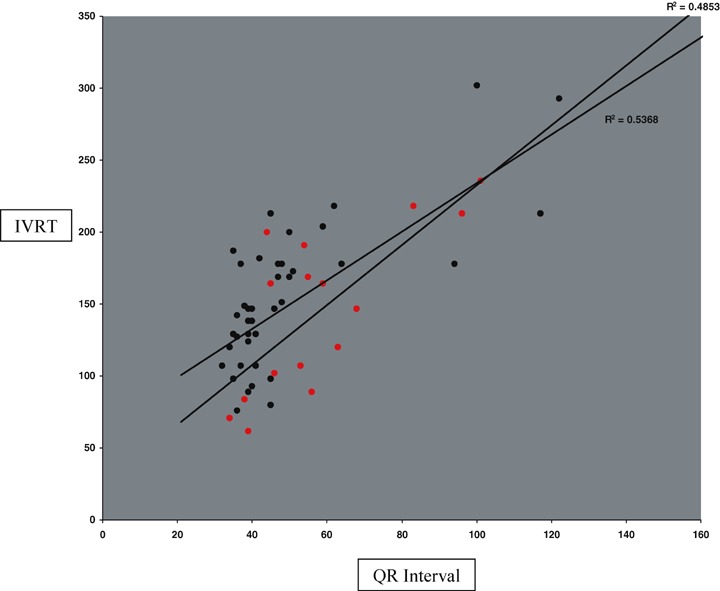
QR interval versus IVRT with red dots indicating those with elevated LV filling pressures.
Figure 7.
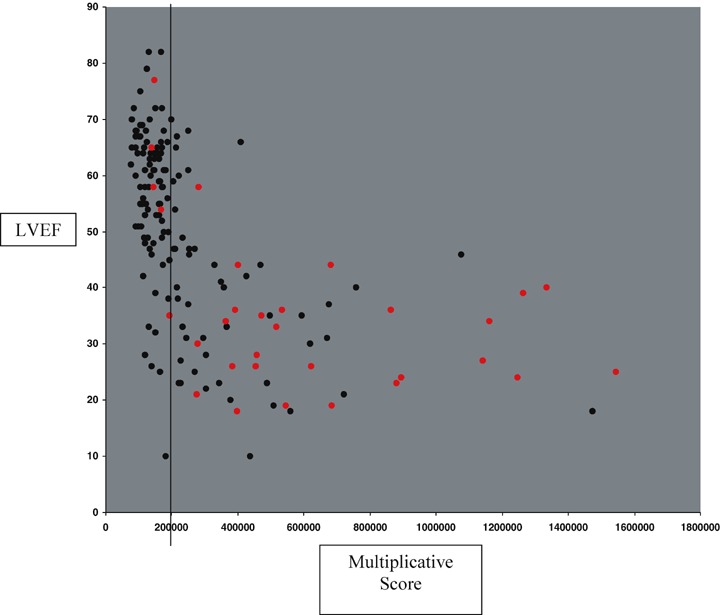
Multiplicative Score versus LVEF with red dots indicating high pressure. Vertical line indicating threshold on learning set for EF < 50%.
Using the diagnostic criterion of QRS duration ≥120 ms in the learning set of 171 subjects identified 46 (53%) of the patients with LVSD while exhibiting 92% specificity. We then determined the incremental diagnostic value of several acoustic cardiac patients by evaluating their performances in the remaining 40 patients who had QRS durations < 120 ms and who therefore would have been missed by the QRS duration criterion. Table 3 shows these results and reveals that at similar specificity, these acoustic cardiographic parameters detected up to 28 (61%) more LVSD patients than those identified by the QRS duration criterion.
Table 3.
Detections of LVSD in Patients with QRS Duration < 120 ms N = 40 Positive, Negative N = 78
| Acoustic Cardiographic Parameter | AUC | Sensitivity at 90% Specificity | Additional LVSD Patients Detected* |
|---|---|---|---|
| S3 Strength | 0.65 | 33% (4.4) | 13 (28%) |
| % EMAT | 0.79 | 38% (12.5) | 15 (33%) |
| QRSdur* Qrint* S3Strength*%EMAT | 0.83 | 70% (166,585) | 28 (61%) |
*Compared to the LVSD patients detected in the entire population by QRS Duration >120 ms.
AUC = area under the receiver operating characteristic curve; EMAT = electromechanical activation time; LVSD = left ventricular systolic dysfunction.
Table 4 displays the findings from the test set of emergency department patients presenting with signs and symptoms of acute decompensated heart failure. For this analysis, the thresholds for QRS duration and the score were those suggested from the learning data for prediction of elevated LV filling pressures. The area under the ROC curve was better for the multiplicative score than for QRS duration (0.78 vs 0.68), largely a result of the improved sensitivity for the score for the detection of a reduced ejection fraction. For prediction of diagnosis of acute decompensated heart failure, the score was superior to QRS duration alone, again largely a result of the improved sensitivity for the score (38% vs 19% at similar specificity of 98%).
Table 4.
Comparison of QRS Duration and the Multiplicative Score to Predict LV Systolic Dysfunction or Elevated Filling Pressure in the Test Set of Emergency Department Patients
| EF < 50% | EF ≥50% | Dx of Acute Decompensated HF | Dx not Acute Decompensated HF | |
|---|---|---|---|---|
| N | 29 | 26 | 151 | 172 |
| LV EF (%) | 30 ± 11 | 57 ± 5∧ | 39 ± 15 | 58 ± 7# |
| QRS dur @ 151 ms | ||||
| AUC | 0.68 | 0.77 | ||
| Sensitivity | 28% | 19% | ||
| Specificity | 96% | 98% | ||
| Positive likelihood ratio | 7.0 | 9.5 | ||
| Negative likelihood ratio | 1.3 | 1.2 | ||
| Score @ 466666 | ||||
| AUC | 0.78 | 0.85 | ||
| Sensitivity | 38% | 35% | ||
| Specificity | 85% | 98% | ||
| Positive likelihood ratio | 2.5 | 17.5 | ||
| Negative likelihood ratio | 1.4 | 1.5 | ||
p < 0.05, #p < 0.01.
DISCUSSION
Our data show that although QRS duration has a moderate association with LVSD, acoustic cardiographic parameters combined in a multiplicative score with QRS duration provides better prediction of reduced LV ejection fraction.
QRS Duration and Detection of Diminished Left Ventricular Ejection Fraction
Prolonged QRS duration has been a traditional marker of LV dyssynchrony and dysfunction. Other investigators have reported that QRS duration ≥100 ms has a sensitivity of 44% with specificity of 84% to predict EF < 45%, 25 and sensitivity of 85% with specificity of 61% in another study for EF < 50%. 26 Using a threshold3120 ms yielded 14% sensitivity and 99% specificity to predict EF < 45% 25 and 76% sensitivity and 90% specificity for EF < 50%. 26 In our study of 171 patients presenting to an outpatient cardiology clinic, QRS duration had a moderate association with LV ejection fraction (see Figs. 2 and 4). At 120 ms, QRS duration had a sensitivity of 51% with specificity of 92% for LV ejection fraction less than 50%, while at 100 ms the sensitivity was 86% with specificity of 59%. The ability of prolonged QRS duration to detect elevated LV filling pressure was worse (at 100 ms, sensitivity 81% and specificity 40%; at 120 ms, sensitivity 50% and specificity 75%).
Impact of S3 Strength and QR Interval
In contrast to QRS duration, S3 Strength had greater area under the ROC curve for elevated LV filling pressure (area under the receiver‐operating characteristic curve [AUC]= 0.82) than for LVSD (AUC = 0.62). The S3 develops during early diastole from vigorous passive filling of the left ventricle. This is shown by the positive relationship between S3 Strength and tissue Doppler E/A ratio revealed in Figure 5. Higher values of S3 Strength occur with higher E/A ratios, reflecting the greater amount of kinetic energy associated with more vigorous LV inflow. The relationship between E/A ratio and elevated LV filling pressure is also shown in Figure 5.
The intriniscoid deflection or QR interval has been used in criteria for ECG detection of LVH and LBBB, both of which are known to be associated with LV dysfunction. The addition of QR interval augments QRS duration for the detection of LVSD and has a strong positive association with isovolumic relaxation time as revealed in Figure 6. There are several possible reasons for this association. First, prolonged QR intervals have been shown to be associated with LV hypertrophy. 9 The relative stiffness of the LV wall in hypertrophy may impair diastolic relaxation. Also, as shown in 1, 2, prolonged QR interval is associated with LVSD and LV systolic and diastolic dysfunction frequently coexist. Third, the greater end‐systolic volume associated with diminished EF provides a greater than normal mass of blood that must be displaced before diastolic filling is completed. All these can decrease the rate with which relaxation occurs.
Multiplicative Score
For the cardiology clinic population, the multiplicative score performed better than QRS duration alone at 90% specificity for EF < 50% (sensitivity = 77% vs 59%), for elevated filling pressures (sensitivity = 55% vs 39%) and for the combination of reduced EF and elevated filling pressure (sensitivity = 99% vs 67%). Figure 7 shows the relationship between the multiplicative score and EF and indicates those patients with elevated filling pressure. The score does not detect many of the patients with elevated filling pressure and preserved ejection fraction. These patients had a high percentage of LV hypertrophy, aortic stenosis, and mitral regurgitation. Thus, the multiplicative score of acoustic electrocardiographic parameters is most effective at detecting patients with LVSD, whether or not there is concomitant elevation of LV filling pressures. In addition, the multiplicative score identifies > 60% of the patients whom the QRS duration criterion had failed to identify.
The multiplicative score when validated in the test set of emergency department patients with signs and symptoms of heart failure had better test characteristics for detection of LVSD than QRS duration alone (see Table 4). More importantly, the multiplicative score was able to detect acute decompensated heart failure better than QRS duration alone at similar specificity (QRSdur AUC = 0.77, 19% sensitivity at 98% specificity vs multiplicative score AUC = 0.85, 35% sensitivity at 98% specificity).
Clinical Significance
The multiplicative score predicted elevated filling pressures (1, 2). Knowing that a patient's LV filling pressures are likely to be elevated increases the confidence with which the physician can attribute a patient's symptoms to decompensated LV failure. Even if a patient is known to have a history of LVSD, determining the multiplicative score upon acute presentation can thus increase the likelihood that the patient will receive appropriate and timely therapy.
Since acoustic cardiographic data can be obtained and algorithmically interpreted very quickly and without the need for specially trained personnel, they can provide clinically relevant point of care diagnostic information even when tests such as the echocardiogram are not immediately available.
Limitations of the Study
Only a minority of the emergency department patients in the test set had echocardiograms performed. As a result, we also validated the multiplicative score and QRS duration against a clinical diagnosis of heart failure.
CONCLUSIONS
While prolonged electrocardiographic QRS duration remains a marker for LVSD, improvements in diagnostic accuracy for LV dysfunction, in particular with elevated filling pressure, can be achieved with a simple score combining additional ECG and heart sound measurements, including S3 strength and EMAT. This may have important treatment implications in patients with known LV dysfunction but whose presentation in the emergency department is unclear. These noninvasive measurements are readily available at the bedside with the acquisition of a standard 12‐lead augmented with two additional acoustic sensors. Therefore, acoustic cardiographic parameters can easily be employed for evaluating patients in a wide variety of clinical settings including the ambulatory clinic, the emergency department, the inpatient environment and the in screening patients for cardiac resynchronization therapy.
Dr. Peacock has served as a consultant and has received research grants from Inovise Medical, Inc.
REFERENCES
- 1. American Heart Association . Heart Disease and Stroke Statistics ‐ 2005 Update. Dallas , TX : American Heart Association; 2005. [Google Scholar]
- 2. Cleland JGF, Daubert J‐C, Erdmann E, et al for the Cardiac Resynchronization‐Heart Failure (CARE‐HF) Study Investigators . The effect of cardiac resynchronization on morbidity and mortality in heart failure. N Engl J Med 2005;352:1539–1549. [DOI] [PubMed] [Google Scholar]
- 3. Kearney MT, Zaman A, Eckberg DL, et al Cardiac size, autonomic function, and 5‐year follow‐up of chronic heart failure patients with severe prolongation of ventricular activation. J Card Fail 2003;9:93–99. [DOI] [PubMed] [Google Scholar]
- 4. Shenkman HJ, Pampati V, Khandelwal AK, et al Congestive heart failure and QRS duration. Chest 2002;528–534. [DOI] [PubMed] [Google Scholar]
- 5. Iuliano S, Fisher SG, Karasik PE, et al QRS duration and mortality in patients with congestive heart failure. Am Heart J 2002;143:1085–1091. [DOI] [PubMed] [Google Scholar]
- 6. Desai AD, Yaw TS, Yamazaki T, et al Prognostic significance of quantitative QRS duration. Am J Med 2006;600–606. [DOI] [PubMed] [Google Scholar]
- 7. De Winter O, Van de Veire N, Van Heuverswijn F, et al Relationship between QRS duration, left ventricular volumes and prevalence of nonviability in patients with coronary artery disease and severe left ventricular dysfunction. Eur J Heart Failure 2006;275–277. [DOI] [PubMed] [Google Scholar]
- 8. Dhingra R, Nam BH, Benjamin EJ, et al Cross‐sectional relations of electrocardiographic QRS duration to left ventricular dimensions. J Am Coll Cardiol 2005;685–689. [DOI] [PubMed] [Google Scholar]
- 9. Farzad J, Mohammad MS, Karimi EP. Prediction of left ventricular dysfunction in basis of ventricular depolarization time and electrical axis in patients with left bundle branch block, Euro 2006 Prevent.
- 10. De Vries SO, Heesen WF, Beltman FW, et al Prediction of the left ventricular mass from the electrocardiogram in systemic hypertension. Am J Cardiol 1996;77(11):974–978. [DOI] [PubMed] [Google Scholar]
- 11. Reddy PS. The third heart sound. Int J Cardiol 1985;7(3):213–221. [DOI] [PubMed] [Google Scholar]
- 12. Stevenson LW, Perloff JK. The limited reliability of physical signs for estimating hemodynamics in chronic heart failure. Jama 1989;261(6):884–888. [PubMed] [Google Scholar]
- 13. Sloan A. Cardiac gallop rhythm. Medicine 1958;37:197–215. [DOI] [PubMed] [Google Scholar]
- 14. Drazner MH, Rame JE, Stevenson LW, et al Prognostic importance of elevated jugular venous pressure and a third heart sound in patients with heart failure. N Engl J Med 2001;345:574–581. [DOI] [PubMed] [Google Scholar]
- 15. Drazner MH, Rame JE, Dries DL. Third heart sound and elevated jugular pressure as markers of the subsequent development of heart failure in patients with asymptomatic left ventricular dysfunction. Am J Med 2003;114:431–437. [DOI] [PubMed] [Google Scholar]
- 16. Shah PM, Gramiak R, Kramer DH, et al Determinants of atrial (S4) and ventricular (S3) gallop sounds in primary myocardial disease. N Engl J Med 1968;278(4):753–758. [DOI] [PubMed] [Google Scholar]
- 17. Glower DD, Murah RL, Olsen CO, et al Mechanical correlates of the third heart sound. J Am Coll Cardiol 1992;19(2):450–457. [DOI] [PubMed] [Google Scholar]
- 18. Weissler AM, Harris WS, Schoenfield CD. Bedside technics for the evaluation of ventricular function in man. Am J Cardiol 1969;23:577. [DOI] [PubMed] [Google Scholar]
- 19. Stack RS, Sohn YH, Weissler AM. Accuracy of systolic time intervals in detecting abnormal left ventricular performance in coronary artery disease. Am J Cardiol 1981;47:603–609. [DOI] [PubMed] [Google Scholar]
- 20. Weissler AM, Harris HS, Schoenfeld CD. Systolic time intervals in heart failure in man. Circulation 1968;37:149–159. [DOI] [PubMed] [Google Scholar]
- 21. Garrard CL, Weissler AM, Dodge HT. The relationship of alterations in systolic time intervals to ejection fraction in patients with cardiac disease. Circulation 1970;62:455–462. [DOI] [PubMed] [Google Scholar]
- 22. Lewis RP, Rittgers SE, Forester WF, et al A critical review of the systolic time intervals. Circulation 1977;56:146. [DOI] [PubMed] [Google Scholar]
- 23. Ommen SR, Nishimura RA. A clinical approach to the assessment of left ventricular diastolic function by Doppler echocardiography: Update 2003. Heart 2003;89(Suppl III):iii18–iii23. [DOI] [PMC free article] [PubMed] [Google Scholar]
- 24. Collins SP, Lindsell CJ, Peacock WF, et al The combined utility of an S3 heart sound and B‐type natriuretic peptide levels in emergency department patients with dyspnea. J Card Fail 2006;12:286–292. [DOI] [PubMed] [Google Scholar]
- 25. Murkofsky RL, Dangas G, Diamond JA, et al A Prolonged QRS Duration on Surface Electrocardiogram Is a Specific Indicator of Left Ventricular Dysfunction. J Am Coll Cardiol 1998;476–482. [DOI] [PubMed] [Google Scholar]
- 26. Kruger S, Filzmaier K, Graf J, et al QRS prolongation on surface ECG and brain natriuretic peptide as indicators of left ventricular systolic dysfunction. J Intern Med 2004;206–212. [DOI] [PubMed] [Google Scholar]
- 27. Weissler AM. A perspective on standardizing the predictive power of noninvasive cardiovascular tests by likelihood ratio computation: 2. Clinical applications. Mayo Clin Proc 1999;74:1072–1087. [DOI] [PubMed] [Google Scholar]