

Abstract
Background: At present atrial electrophysiology can only be assessed by invasive study. This limits available data in humans concerning atrial electrophysiologic changes in disease and in response to intervention. Indirect evidence suggests that the signal‐averaged P wave (SAPW) may provide noninvasive markers of atrial electrophysiology but no direct evaluations that measure both refractoriness and conduction time have been reported.
Methods: We investigated 9 patients attending for diagnostic electrophysiological studies (4 male; mean age 35.7 years). A 20‐pole catheter was positioned in the right atrium; a decapole catheter was placed in the coronary sinus. Atrial effective refractory period (AERP) and conduction times were measured at the lateral and septal right atrium and the left atrium during sinus rhythm (SR) and at pacing cycle lengths of 600, 500, and 400 ms. Simultaneous SAPW recordings were taken during SR and pacing at 600 ms. Intravenous flecainide (2 mg/kg) was given after which the protocol was repeated.
Results: Flecainide slowed conduction significantly at all sites (P < 0.05). During baseline measurements, rate adaptation of AERP was observed (P < 0.02 at the septum). Flecainide increased filtered P wave duration (P < 0.05) and reduced P wave energies (P < 0.05). Negative correlation was observed between P wave energies and conduction time with an inverse relationship between high‐frequency energy and left atrial AERP.
Conclusions: The SAPW provides a noninvasive marker of atrial electrophysiology.
Keywords: Signal‐averaged P wave, remodeling, atrial fibrillation, flecainide
Recent advances in our understanding of the pathogenesis of atrial fibrillation (AF) suggest that it is a complex phenomena comprising a substrate that may variously involve conduction delay and also changes in atrial refractoriness which is modified by the arrhythmia itself, a process termed remodeling. 1 Moreover, the importance of the interaction between triggers for the arrhythmia, particularly those from the pulmonary veins, and this underlying substrate is increasingly recognized. 2 While various therapeutic advances have increased our ability to offer treatments for drug refractory AF, success rates are modest and our ability to predict which patient will respond to which therapeutic maneuver is limited.
AF is associated with a number of well‐defined electrophysiological abnormalities of the atria. These include a reduction in the refractory period, an increase in the dispersion of the refractory period and a reduction in conduction velocity of the atrial impulse. 1 , 2 , 3 These parameters combine to reduce the wavelength and to promote reentry. At the same time, investigation of the high‐resolution signal‐averaged P wave (SAPW) has indicated that changes in quantitative measures of its duration and energy content are present in patients with paroxysmal AF and after cardioversion from persistent AF and can predict those individuals at risk of developing the arrhythmia after coronary bypass surgery. 4 , 5 , 6 , 7 , 8 , 9 , 10 , 11
The above implies that there may be a relationship between parameters measured noninvasively from the surface P wave and indices of underlying atrial electrophysiology. This hypothesis is supported by indirect data concerning the effects of drug intervention on SAPW parameters and by serial evaluations of the SAPW after cardioversion from persistent AF. 6 , 12 If direct evidence of a relationship between the SAPW and changes in underlying atrial electrophysiology were evident then this technique would afford a useful noninvasive clinical method for the serial evaluation of the atria after therapeutic interventions as well as for the identification of subsets of patients with AF that may respond to different interventions or drugs.
We have therefore sought to correlate variables measured by invasive electrophysiological testing with those measured simultaneously from the SAPW and to record the effects of an acute change in atrial electrophysiology on both invasive and noninvasive measurements.
METHODS
Patient Selection
Consecutive patients attending for diagnostic electrophysiological studies (EPS) without planned progression to radiofrequency ablation were screened. Patients were excluded if they had a history of ventricular dysrhythmia, ischemic heart disease, antegrade conducting accessory pathway, or a structurally abnormal heart. Of 18 eligible patients 3 wished to proceed to radiofrequency ablation directly following diagnostic studies, 3 developed AF during the diagnostic study, in 2 the diagnostic study exceeded the time allowed for the research protocol, and in 1 the research protocol was abandoned at the patient's request. The characteristics of the remaining 9 patients are presented in Table 1.
Table 1.
Characteristics of the Patients Studied
| Gender | Age (years) | Diagnosis |
|---|---|---|
| Male | 34 | Left‐sided concealed accessory pathway |
| Female | 30 | AV nodal duality |
| Male | 48 | Left‐sided concealed accessory pathway |
| Female | 30 | Left atrial tachycardia |
| Female | 42 | Normal electrophysiological study |
| Female | 45 | Normal electrophysiological study |
| Male | 44 | Normal electrophysiological study |
| Male | 28 | Normal electrophysiological study |
| Female | 20 | Atrioventricular nodal reentrant tachycardia |
Electrophysiological Study
Antiarrhythmic drugs were stopped at least 5 half‐lives before EPS. None of the patients had received amiodarone. Diagnostic EPS was undertaken in a nonsedated postabsorptive state after written informed consent was obtained. The studies were not performed under conditions of autonomic blockade. Following local anesthesia four catheters were passed via the right femoral vein under fluoroscopic guidance to the heart. Quadrapole diagnostic catheters (Cordis‐Webster, Inc., Diamond Bar, CA, USA) were positioned in the high right atrium, right ventricular apex, and His‐bundle position. A deflectable decapole catheter (C.R. Bard, Inc., Lowell, MA, USA) was positioned in the coronary sinus (CS). Following a standard diagnostic study the high right atrial catheter was removed and a 20‐pole halo catheter (Irvine Biomedical, Inc., Irvine, CA, USA (H‐21)) introduced to lie around the tricuspid valve annulus. Intracardiac stimulation was achieved with a programmable stimulator (EPMedical Co., Ltd., Budd Lake, NJ, USA (EP3)) using a pulse width of 2 ms and amplitude of twice the diastolic threshold.
Measurement of Conduction Times
Conduction times were measured from intracardiac signals recorded during sinus rhythm (SR) or constant atrial pacing. The earliest signal on the Halo catheter during SR was determined and the conduction time measured to the lateral right atrium (Halo poles 1 and 2), the septum (Halo poles 19 and 20), and the left atrium (from CS poles 9 and 10 to poles 1 and 2). Similar measurements were made during constant atrial pacing from the Halo poles exhibiting the earliest signal during SR.
Measurement of Atrial Effective Refractory Period
During SR atrial effective refractory period (AERP) was measured at the lateral right atrium (Halo poles 1 and 2), the septum (Halo poles 19 and 20), and left atrium (CS poles 1 and 2). Sensed extra stimuli were introduced at an initial coupling interval of 160 ms at amplitude of twice the diastolic threshold. The coupling interval was increased initially in 5 ms and subsequently 2 ms increments until atrial capture was accomplished. AERP for the site in question was the longest coupling interval of an atrial premature stimulus that failed to capture. Constant atrial pacing was performed as described above using a second stimulator and AERP measurements repeated. Each AERP measurement was performed three times and the average taken.
SAPW Recording
SAPWs were collected according to our previously described method. 7 Careful skin preparation and positioning of silver–silver chloride electrodes in an orthogonal manner preceded EPS. Derived analogue signals were amplified 10,000 times and band pass filtered between 1 and 300 Hz. One lead exhibiting the most obvious P wave was then further band pass filtered between 20 and 50 Hz and used as a trigger to align subsequent P waves for signal averaging. The analog data were sampled at 1 KHz with 12‐bit resolution. Approximately 600 beats were stored to disc for subsequent offline analysis.
AERP and conduction time were measured during SR and during constant atrial pacing at cycle lengths of 600, 500, and 400 ms. Simultaneous SAPW recordings were made during SR and during constant atrial pacing at 600 ms. The experimental protocol was repeated after intravenous administration of flecainide acetate (3M Health Care Loughborough, UK) at a dose of 2 mg per kg or 140 mg, whichever was the lesser value, at a rate of 10 mg/min.
Analysis of SAPW Recordings
Stored P waves were analyzed offline according to our previously described method. 7 During signal averaging the “window” for signal acquisition was identified by voltage threshold triggering using the R wave of the signal selected as the trigger channel. P waves were then aligned by template matching to an evenly spaced 30‐point P wave derived template; thus achieving true P wave triggered averaging. An algorithm that automatically determined the most frequently occurring P wave morphology was used to select the averaging template. P waves failing to match this morphology were rejected. Approximately 200 beats were averaged for each patient. After signal averaging the pacing spike was removed from signals recorded during atrial pacing to prevent filter ringing in response to the high transient signal.
The derived P wave signals were high pass filtered at 40 Hz using a 30‐term finite impulse response filter and a vector magnitude plot constructed. The beginnings and ends of P waves were determined automatically as the points at which the P wave vector magnitude rose above and returned to within three standard deviations, respectively, of the background level of noise. These limits were used to determine the P wave duration. Spectral analysis comprised Fourier transformation of the entire unwindowed P wave after filtering at a high pass of 15 Hz. The resultant frequency spectra were summed algebraically from each orthogonal lead to give estimates of the total power per frequency band from 20, 30, 40, 60, and 80 to 150 Hz. Thus P20 is the summation of the power found in frequency bands between 20 and 150 Hz. Figure 1 is a representative sample of the power density spectrum and filtered P wave before (left) and after (right) flecainide during SR.
Figure 1.
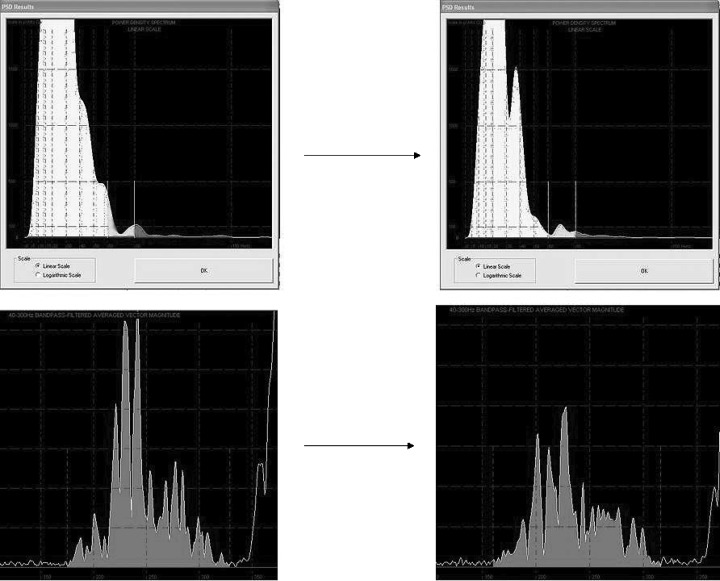
Power density spectrum and filtered P wave before and after the administration of flecainide. Graphic examples of data from the same patient. Power density spectra are displayed on top with lines after the bulk of the spectra marking first 60 Hz and then 80 Hz on each graph. The high‐frequency components after the lines are clearly seen to diminish after flecainide. Time‐domain surface filtered P wave duration is observed to prolong in the corresponding images below.
Statistical Analysis
The data were inspected for normality with the Anderson–Darling test. Data with a normal distribution were analyzed by a paired Student's t‐test. Data that were not normally distributed were analyzed by the Wilcoxon signed rank test. Multiple variables were analyzed using a Kruskal–Wallis test or one‐way ANOVA for normally distributed data. Correlation coefficients were calculated by Spearman rank correlation. A P value of <0.05 (2‐tailed) was considered significant.
RESULTS
Conduction Times
Conduction times during SR and during constant atrial pacing before and after flecainide administration are demonstrated in Table 2. There was no significant change in conduction times with decreasing pacing cycle length. Flecainide induced a significant slowing of conduction during SR, at all pacing cycle lengths and at all sites measured; there was no use dependence observed.
Table 2.
Conduction Times Before and After Flecainide Administration
| Before Flecainide | After Flecainide | |||||
|---|---|---|---|---|---|---|
| Lateral | Septal | LA | Lateral | Septal | LA | |
| SR | 46.56 | 31.36 | 24.89 | 64.72* | 37.83 | 31.06* |
| 4.07 | 4.87 | 2.03 | 6.01 | 6.06 | 2.61 | |
| 600 | 56.89 | 44.00 | 26.69 | 62.33* | 51.78* | 29.78* |
| 4.00 | 5.71 | 2.57 | 4.86 | 7.54 | 3.02 | |
| 500 | 54.39 | 44.11 | 26.06 | 63.67* | 52.72* | 28.72* |
| 4.43 | 6.15 | 2.54 | 4.8 | 7.77 | 2.82 | |
| 400 | 52.67 | 48.6 | 22.67 | 60.08* | 57.5* | 26.67* |
| 7.31 | 8.6 | 2.83 | 8.79 | 10.5 | 3.63 | |
| P (column) | 0.416 | 0.281 | 0.875 | 0.974 | 0.280 | 0.820 |
Mean values for conduction times measured during sinus rhythm and at different pacing cycle lengths to lateral right atrium, septal right atrium, and left atrium (SEM is represented below conduction time in ms). The one‐way Anova test was used to identify significant row and column differences. *P < 0.05 compared to value before flecainide using paired t‐test.
Refractory Periods
At baseline normal rate‐adaptation of refractory periods was observed at all three sites; however, this only reached significance at the septum (Table 3). After flecainide administration rate‐adaptation was attenuated somewhat with relative lengthening of the refractory period at 500‐ms cycle length. This effect of flecainide was evident at all sites; adaptation returned at 400‐ms pacing cycle length. Flecainide administration resulted in a modest prolongation of AERP at all sites and at all pacing cycle lengths; this reached significance at the lateral right atrium. The data were examined for a change in dispersion of refractoriness following flecainide; no significant change was evident, the distribution of left atrium > right atrial lateral wall > right atrial septum persisted after flecainide.
Table 3.
Refractory Periods Before and After Administration of Flecainide
| Before Flecainide | After Flecainide | |||||||
|---|---|---|---|---|---|---|---|---|
| Lateral | Septal | LA | P (row) | Lateral | Septal | LA | P (row) | |
| SR | 215.2 | 206.3 | 283.9 | 0.000 | 237.8 | 201.6 | 291.1 | 0.002 |
| 7.5 | 12.1 | 13.5 | 10.8 | 13.9 | 19.8 | |||
| 600 | 200.6 | 183.4 | 271.6 | 0.000 | 217.7* | 185.1 | 273.4 | 0.000 |
| 10.4 | 9.7 | 9.4 | 9.9 | 12.6 | 13.3 | |||
| 500 | 190.2 | 171.5 | 262.0 | 0.000 | 218.6* | 191.9 | 276.4 | 0.002 |
| 11.1 | 7.7 | 10.4 | 8.9 | 17.1 | 18.1 | |||
| 400 | 175.3 | 155.8 | 247.9 | 0.005 | 205.9* | 155.1 | 255.7 | 0.002 |
| 19.2 | 11.6 | 17.9 | 15.6 | 11.7 | 19.7 | |||
| P (column) | 0.147 | 0.014 | 0.322 | 0.266 | 0.306 | 0.748 | ||
Mean atrial effective refractory periods measured during sinus rhythm and at different pacing cycle lengths at lateral right atrium, septal right atrium, and left atrium (SEM is represented below AERP in ms). The one‐way Anova test was used to identify significant row and column differences. *P < 0.05 compared to value before flecainide using paired t‐test.
Signal‐Averaged P Wave
Values for P wave duration and energy were similar when measured during SR and during constant atrial pacing at 600‐ms cycle length. During SR flecainide induced significant lengthening of P wave duration and a significant fall in P wave energy. Similar findings were evident during constant atrial pacing (Table 4).
Table 4.
Signal‐Averaged P Wave Variables Before and After Administration of Flecainide
| Sinus Rhythm | Constant Pacing at 600 ms | |||||||||||
|---|---|---|---|---|---|---|---|---|---|---|---|---|
| PWD | P20 | P30 | P40 | P60 | P80 | PWD | P20 | P30 | P40 | P60 | P80 | |
| Pre | 137 | 37.96 | 23.43 | 11.24 | 3.97 | 1.85 | 142 | 44.12 | 25.96 | 10.25 | 4.12 | 1.85 |
| 3.69 | 11.4 | 6.58 | 3.44 | 0.93 | 0.40 | 6.52 | 11.0 | 6.72 | 1.48 | 0.79 | 0.23 | |
| Post | 149 | 26.51 | 16.17 | 8.09 | 2.30 | 0.75 | 149 | 34.81 | 17.93 | 8.48 | 2.34 | 0.98 |
| 3.27 | 5.73 | 4.10 | 1.03 | 0.45 | 0.16 | 10.2 | 6.16 | 4.41 | 1.56 | 0.41 | 0.23 | |
| P (column) | 0.04 | 0.024 | 0.009 | 0.044 | 0.024 | 0.024 | 0.320 | 0.009 | 0.013 | 0.193 | 0.009 | 0.042 |
P wave duration (ms) and energies (μV2 s −1) during sinus rhythm and constant atrial pacing at a cycle length of 600 ms. P20 represents energy contained within frequency band 20–150 Hz; P30, between 30 and 150 Hz etc. Significance between values measured before and after flecainide administration is assessed by the Wilcoxon rank sum test. Median values are shown with SEM displayed below.
Correlation
During SR modest negative correlation was observed between P wave frequency bands and conduction times in the left atrium (for P80, ρ=−0.54 (P = 0.02); P60, ρ=−0.49 (P < 0.04); and P20, ρ=−0.47 (P = <0.05)). PWD was positively correlated with conduction time in the left atrium (ρ= 0.49 (P < 0.04)). Inverse correlation was observed between lateral wall refractory periods and high‐frequency P wave energy bands (for P80, ρ=−0.55 (P < 0.02)). During constant atrial pacing a similar pattern of correlation was observed between P wave variables and indices derived from the left atrium (for LA, AERP and P80 ρ=−0.51 (P < 0.03)).
DISCUSSION
To our knowledge this is the first study to correlate surface P wave parameters and atrial electrophysiologic parameters. We have demonstrated significant change in parameters derived from the SAPW during sinus and paced rhythms in response to flecainide. Energy content of all frequency bands reduced significantly after the administration of flecainide and we observed a significant increase in P wave duration during SR. Simultaneous invasive observations demonstrated significant slowing of atrial conduction times at all sites measured and prolongation of AERP, statistically significant at the right atrial lateral wall. Correlation sought between P wave variables and the electrophysiological changes induced by flecainide suggests positive correlation with P wave duration, an inverse relationship between AERP and high‐frequency energy content and an inverse relationship between low‐frequency energy and conduction times.
It is generally accepted that the surface electrogram can in some way reflect the electrophysiologic properties of the myocardium. 13 This ability has been utilized in the examination of ventricular late potentials, small amplitude, high‐frequency signals located at the terminal portion of the QRS complex. 14 Low‐frequency components of the filtered electrogram have been linked to conduction velocity in the atrium and ventricle. 6 , 15 , 16 A number of studies demonstrate high‐frequency components of the electrogram that are increased with fractionation within the myocardium; 13 , 17 , 18 however, it does not follow that it is necessary to have fractionation to produce high‐frequency components in surface potentials. Smith et al. elegantly demonstrated the presence of relative high‐frequency content of signal‐averaged ECG waveforms in the healthy myocardium of patients with the Wolff–Parkinson–White syndrome (WPW). 19 In addition they demonstrated relatively more high‐frequency components in the WPW patients compared to a control group with ventricular dysrythmia. The authors point to complexities in the activation sequence to explain their findings, suggesting that high‐frequency content reflects the amount of time that multiple complex wavefronts are present.
Thus, conduction velocity may be reflected in low‐frequency signals, complexity of activation sequences reflected in high‐frequency signals. Previous studies examining the frequency spectra of the SAPW in a population of patients with paroxysmal AF have demonstrated marked differences in the high‐frequency components of the P wave when compared with controls with normal atria. 20 , 21 Sotalol, a drug known to effect action potential duration (APD) but not conduction velocity, resulted in a relative decrease in high‐frequency energy components of the SAPW without change in low‐frequency energy; this is consistent with the lack of effect on conduction velocity. 6 Increasing APD prolongs refractoriness raising the possibility that high‐frequency energy is a marker of refractoriness of the atria. Studies post cardioversion have linked high‐frequency energy to refractoriness but as conduction velocity is not known to change after cardioversion this parameter was not examined. 9 , 12
Flecainide's action on sodium and potassium channels results in marked conduction slowing and APD prolongation, respectively; this has been associated with increased refractoriness; 22 however, flecainide's action on AERP is thought to be minimal. 23 , 24 , 25 As we observed a significant and consistent change in refractory period and conduction times with flecainide, we would expect a marked change in low‐frequency energy (in contrast to the effects described with sotalol) and a change in the high‐frequency components consistent with the altered refractoriness of the atria and the previous data derived from sotalol. 6 Our results appear to support this hypothesis.
How May Refractoriness be Reflected in High‐Frequency Content?
The work of Smith et al. have shown us that high‐frequency signals are present in normal myocardium and postulate that this reflects the complexity of signals in the ventricle. 19 One may expect to find such complexity in the atria with structures such as Bachmanns Bundle, the Crista Terminalis, and the posterior triangle of Koch 26 presenting pivot points for activation wavefront collision and sources for such complex signals. Prolongation of the APD and depression of conduction by flecainide have been shown to increase the conduction times around such pivot points; 27 , 28 this would reduce the number of multiple complex wavefronts present in the atrium and in turn reduce the number of high‐frequency signals. In the atria of subjects with sinus node disease or PAF we would expect areas of heterogeneous conduction and distribution of refractoriness resulting in a greater degree of complexity of activation wavefronts and fractionated potentials, this in turn would increase the high‐frequency energy content of the SAPW. This has been observed in previous studies of this technique in paroxysmal AF. 6 , 7 , 21
What are the Clinical Applications of this Technique?
The implications of this research are that we are afforded a technique for noninvasive evaluation of atrial electrophysiologic parameters. Low‐frequency energy appears to be a fairly consistent marker of general conduction velocity; high frequency reflects parameters contributing to complexity of activation wavefronts and fractionation such as refractoriness and APD independent of conduction. This technique could be used as a simple noninvasive measure of atrial response to therapeutic interventions in AF, as a guide to dosing of antiarrhythmic medications and as a pure research tool in atrial electrophysiology. Its utility as a measure of atrial change over time may provide a basis for risk evaluation in cohorts at risk of AF or as a measure of reverse remodeling in response to some intervention. This has already been demonstrated in patients post coronary artery bypass grafting. 11 , 29 As a large proportion of AF is asymptomatic, the SAPW may be used as a screening method in other cohorts such as stroke patients or patients presenting with palpitations. This should be further investigated with prospective clinical studies in patients with PAF treated with flecainide or propafenone to examine the ability of SAPW changes to predict response. A study with pure class III agents such as dofetilide may complement the results of this study.
Study Limitations
We used a drug that appeared to change both conduction times and AERP. Therefore, we cannot be entirely sure as to the relative contributions of each to change in P wave derived parameters. Moreover, Spurrell's work has already demonstrated a relationship with acute change in refractory period following cardioversion from AF. 12 We have now demonstrated the same change in P wave parameters suggesting that this is an effect on refractoriness, not just conduction times.
The population studied did not have AF; the effect on refractory period may be more pronounced in remodeled atria and more closely resemble the changes observed in clinical studies of the SAPW. Further studies using pure class III agents appear warranted to confirm the observations of Spurrell and ourselves.
The study cohort is relatively small, but the observed data are consistent within the group and consistent with clinical findings suggesting that real effects are being measured.
CONCLUSIONS
In subjects undergoing diagnostic electrophysiological study, flecainide slowed atrial conduction and prolonged AERP. SAPW analysis noninvasively reflected these changes in atrial electrophysiology. Low‐frequency energy was related to conduction while high‐frequency energies were an inverse marker of AERP and conduction time.
The SAPW affords a noninvasive method for the evaluation of atrial electrophysiology. Further investigations of the application of this methodology both to AF research and to clinical practice are warranted.
REFERENCES
- 1. Shimizu A, Centurion OA. Electrophysiological properties of the human atrium in atrial fibrillation [Review][129 refs]. Cardiovasc Res 2002;54: 302–314. [DOI] [PubMed] [Google Scholar]
- 2. Jais P, Haissaguerre M, Shah DC, et al A focal source of atrial fibrillation treated by discrete radiofrequency ablation [see comments.]. Circulation 1997;95: 572–576. [DOI] [PubMed] [Google Scholar]
- 3. Lau CP, Tse HF. Electrical remodelling of chronic atrial fibrillation [Review][17 refs]. Clin Exp Pharmacol Physiol 1997;24: 982–983. [DOI] [PubMed] [Google Scholar]
- 4. Aytemir K, Aksoyek S, Ozer N, et al Atrial fibrillation after coronary artery bypass surgery: P wave signal averaged ECG, clinical and angiographic variables in risk assessment. Int J Cardiol 1999;69: 49–56. [DOI] [PubMed] [Google Scholar]
- 5. Opolski G, Scislo P, Stanislawska J, et al Detection of patients at risk for recurrence of atrial fibrillation after successful electrical cardioversion by signal‐averaged P wave ECG. Int J Cardiol 1997;60: 181–185. [DOI] [PubMed] [Google Scholar]
- 6. Stafford PJ, Cooper J, De Bono DP, et al Effect of low dose sotalol on the signal averaged P wave in patients with paroxysmal atrial fibrillation. Br Heart J 1995;74: 640. [DOI] [PMC free article] [PubMed] [Google Scholar]
- 7. Stafford PJ, Robinson D, Vincent R. Optimal analysis of the signal averaged P wave in patients with paroxysmal atrial fibrillation. Br Heart J 1995;74: 418. [DOI] [PMC free article] [PubMed] [Google Scholar]
- 8. Aytemir K, Aksoyek S, Yildirir A, et al Prediction of atrial fibrillation recurrence after cardioversion by P wave signal‐averaged electrocardiography. Int J Cardiol 1999;70: 15–21. [DOI] [PubMed] [Google Scholar]
- 9. Stafford PJ, Kamalvand K, Tan K, et al Prediction of maintenance of sinus rhythm after cardioversion of atrial fibrillation by analysis of serial signal‐averaged P waves. Pacing Clin Electrophysiol 1998;21: 1395. [DOI] [PubMed] [Google Scholar]
- 10. Guidera SA, Steinberg JS. The signal‐averaged P wave duration: A rapid and noninvasive marker of risk of atrial fibrillation [see comments]. J Am Coll Cardiol 1993;21: 1645–1651. [DOI] [PubMed] [Google Scholar]
- 11. Klein M, Evans SJ, Blumberg S, et al Use of P‐wave‐triggered, P‐wave signal‐averaged electrocardiogram to predict atrial fibrillation after coronary artery bypass surgery [see comments]. Am Heart J 1995;129: 895–901. [DOI] [PubMed] [Google Scholar]
- 12. Spurrell P, Stafford P, Kamalvand K, et al The signal averaged P wave: A non‐invasive marker for atrial remodeling following DC cardioversion of atrial fibrillation in man? Heart 1999;81. [Google Scholar]
- 13. Ellis WS, Auslander DM, Lesh MD. Fractionated electrograms from a computer model of heterogeneously uncoupled anisotropic ventricular myocardium. Circulation 1995;92: 1619–1626. [DOI] [PubMed] [Google Scholar]
- 14. Steinbigler P, Haberl R, Bruggemann T, et al Postinfarction risk assessment for sudden cardiac death using late potential analysis of the digital Holter electrocardiogram. J Cardiovasc Electrophysiol 2002;13: 1227–1232. [DOI] [PubMed] [Google Scholar]
- 15. David D, Naito M, Michelson E, et al Intramyocardial conduction: A major determinant of R‐wave amplitude during acute myocardial ischemia. Circulation 1982;65: 161–167. [DOI] [PubMed] [Google Scholar]
- 16. Piccolo E, Raviele A, Delise P, et al The role of left ventricular conduction in the electrogenesis of left ventricular hypertrophy. An electrophysiologic study in man. Circulation. 1979;59: 1044–1055. [DOI] [PubMed] [Google Scholar]
- 17. Shan Z, Van Der Voort PH, Blaauw Y, et al Fractionation of electrograms and linking of activation during pharmacologic cardioversion of persistent atrial fibrillation in the goat. J Cardiovasc Electrophysiol 2004;15: 572–580. [DOI] [PubMed] [Google Scholar]
- 18. Lesh MD, Spear JF, Simson MB. A computer model of the electrogram: What causes fractionation? J Electrocardiol 1988;21(Suppl.):S69–S73. [DOI] [PubMed] [Google Scholar]
- 19. Smith WM, Vidaillet HJ Jr, Worley SJ, et al Signal averaging in Wolff–Parkinson–White syndrome: Evidence that fractionated activation is not necessary for body surface high‐frequency potentials. Pacing Clin Electrophysiol 2000;23: 1330–1335. [DOI] [PubMed] [Google Scholar]
- 20. Dilaveris PE, Gialafos EJ, Sideris SK, et al Simple electrocardiographic markers for the prediction of paroxysmal idiopathic atrial fibrillation. Am Heart J 1998;135: 733–738. [DOI] [PubMed] [Google Scholar]
- 21. Stafford PJ, Turner I, Vincent R. Quantitative analysis of signal‐averaged P waves in idiopathic paroxysmal atrial fibrillation. Am J Cardiol 1991;68: 755. [DOI] [PubMed] [Google Scholar]
- 22. Wang ZG, Pelletier LC, Talajic M, et al Effects of flecainide and quinidine on human atrial action potentials. Role of rate‐dependence and comparison with guinea pig, rabbit, and dog tissues. Circulation 1990;82: 274–283. [DOI] [PubMed] [Google Scholar]
- 23. Estes NA, Garan H, Ruskin JN. Electrophysiologic properties of flecainide acetate. Am J Cardiol 1984;53: 26B–29B. [DOI] [PubMed] [Google Scholar]
- 24. Hellestrand KJ, Bexton RS, Nathan AW, et al Acute electrophysiological effects of flecainide acetate on cardiac conduction and refractoriness in man. Br Heart J 1982;48: 140–148. [DOI] [PMC free article] [PubMed] [Google Scholar]
- 25. Katritsis D, Rowland E, O'Nunain S, et al Effect of flecainide on atrial and ventricular refractoriness and conduction in patients with normal left ventricle. Implications for possible antiarrhythmic and proarrhythmic mechanisms. Eur Heart J 1995;16: 1930–1935. [DOI] [PubMed] [Google Scholar]
- 26. Papageorgiou P, Monahan K, Boyle NG, et al Site‐dependent intra‐atrial conduction delay. Relationship to initiation of atrial fibrillation. Circulation 1996;94: 384–389. [DOI] [PubMed] [Google Scholar]
- 27. Danse PW, Garratt CJ, Mast F, et al Preferential depression of conduction around a pivot point in rabbit ventricular myocardium by potassium and flecainide. J Cardiovasc Electrophysiol 2000;11: 262–273. [DOI] [PubMed] [Google Scholar]
- 28. Pinto JM, Graziano JN, Boyden PA. Endocardial mapping of reentry around an anatomical barrier in the canine right atrium: Observations during the action of the Class IC agent, flecainide. J Cardiovasc Electrophysiol 1993;4: 672–685. [DOI] [PubMed] [Google Scholar]
- 29. Stafford PJ, Kolvekar S, Cooper J, et al Signal averaged P wave compared with standard electrocardiography or echocardiography for prediction of atrial fibrillation after coronary bypass grafting. Heart 1997;77: 422. [DOI] [PMC free article] [PubMed] [Google Scholar]