

Abstract
Background: The aim of the study was to evaluate the contribution of relative lead strengths to exercise‐induced ECG changes (ST depression) to predict the degree of myocardial ischemia as compared to the angiograms. This was accomplished by comparing the magnitude of ST depression to the ST/R ratio. Studies have shown that the diagnostic strength of a lead is directly related to the R wave amplitude 1 and that sensitivity is significantly improved.
Methods: Three hundred patients, who underwent treadmill exercise testing and coronary angiography revealing significant coronary narrowing (≥70% luminal diameter narrowing), were studied, along with 150 patients clear of significant coronary artery disease (<70% luminar diameter narrowing). Our goal was to determine the correlation between the relative lead strengths, using a constructed ST/R ratio, to exercise induced ECG changes (ST depression) to predict the presence of myocardial ischemia as compared to angiographic findings. Using a cutoff of 0.1 for the ST/R ratio, our data were compared to the sensitivity and specificity of 1.0 mm ST depression.
Results: Overall sensitivity was improved for the ST/R ratio (84% vs 78%), while specificity was slightly decreased (81% vs 92%) in comparison to standard ST depression. When differentiating between R wave amplitudes, those with R wave ≤ 10 mm showed significantly improved sensitivity (88% vs 54%) and a minor decrease in specificity (90% vs 92%). In those with R wave ≥ 20 mm, the sensitivity of ST depression was higher (88% vs 71%) but the ST/R ratio was much more specific (88% vs 46%). No significant difference was observed when differentiating between male and female patients.
Conclusion: We found that the correction of ST depression for R wave amplitude results in improved sensitivity in patients with low R waves and specificity in patients with very tall R waves (R ≥ 20 mm).
Keywords: exercise testing, ischemia, R waves
METHODS
Although exercise testing is a popular approach to the diagnosis and evaluation of coronary artery disease, the ST response has suffered from a lack of sensitivity and specificity. A number of ways to improve waveform recognition have been used with some success in improving sensitivity, but many of these methods are not widely available. It has been noted that the diagnostic strength of the lead is a function of the R wave amplitude. We therefore undertook this study to examine the ratio of the ST to R wave amplitude in comparison with coronary disease identified at angiography.
Four hundred fifty patients who had both a coronary angiogram and a treadmill stress test within 3 months of each other were included in this study. The patients were referred for evaluation of known or suspected coronary disease. Fifty‐seven women and 243 men comprised the study cohort. Exclusions were as follows: corrective procedure completed between the two test dates, ST elevation prior to exercise, left bundle branch block, left ventricular hypertrophy, and myocardial infarction less than 1 month from the test date. Our study group was compared to a control group of 34 women and 116 men, randomly selected from the hospital database, who have had angiographic evidence of no coronary artery narrowing or less than 70% luminar diameter narrowing.
All patients underwent a standard Ellestad exercise protocol, 2 which starts with an initial 10% grade and a speed of 1.7 miles per hour for 3 minutes. The speed then increases to 3, 4, and 5 miles per hour for 2 min each over the next 6 minutes without a grade increase. Then after the first 9 minutes the grade increases to 15% while the speed remains the same. Ninety‐five percent of our patients were unable to progress past the 9th minute. Tests were discontinued because of increasing chest pain, serious ectopy, onset of 2nd or 3rd degree heart block, progressive drop in blood pressure, patient fatigue, and significant ST segment depression as evaluated by the attending cardiologist.
A standard 12‐lead system was used with the Mason‐Likar electrode location. 3 Recordings were continuously taken from rest through peak exercise to full recovery. All the tracings were taken at 25 mm/s paper speed. The ST‐segment was measured in 3 complexes without significant baseline shift. All measurements were made in ms from a baseline established by the PQ junction with the ST depression being measured at 70 ms post J point. Immediately after exercise, R wave amplitude was recorded for use in the constructed ST/R ratio in the lead with the greatest ST depression. The patients' electrocardiographic (ECG) measurements were taken without knowledge of the clinical information or angiographic results. Horizontal, downsloping, and slowly upsloping ST segments were measured.
From the above measurements the ECG response was graded as abnormal or normal by the following criteria: (1) ST depression of at least 1 mm was considered abnormal; and (2) ST/R ratios of at least 0.1 were considered abnormal. The leads used for these measurements are illustrated in Figure 1. The angiograms were reviewed by a cardiovascular radiologist who was not part of this study. The lesion diameter was measured by calipers in at least two views. A 70% or greater diameter narrowing was considered significant for coronary artery disease.
Figure 1.

Leads used for measurement.
RESULTS
The distribution of the findings according to the number of vessels involved is depicted in Table 2. In Table 3, it can be seen that there is a 4% greater sensitivity for the ST/R ratio than for the conventional ST depression, and a decrease in specificity from 92% to 81%. Differentiation between males and females shows slightly higher sensitivity and specificity values for males. The sensitivity of 1 mm ST Depression and 0.1 ST/R ratio were 78% and 82% for males as opposed to 76% and 81% for females. Similarly the specificities were 92% and 83% for males, and 85% and 78% for females.
Table 2.
Distribution of Findings (n = 450)
| Disease | 0 | 1 | 2 | 3 | ||||
|---|---|---|---|---|---|---|---|---|
| No. | % | No. | % | No. | % | No. | % | |
| Negative ST Depression | 135 | 90 | 15 | 20 | 35 | 30 | 16 | 15 |
| Abnormal ST Depression | 15 | 10 | 52 | 80 | 83 | 70 | 89 | 85 |
| Negative ST/R ratio | 121 | 81 | 17 | 22 | 19 | 16 | 6 | 8 |
| Abnormal ST/R ratio | 29 | 19 | 60 | 78 | 99 | 74 | 99 | 92 |
| Total | 150 | 77 | 118 | 105 | ||||
Table 3.
| ST Depression | ST/R Ratio | |||||
|---|---|---|---|---|---|---|
| Males | Females | Overall | Males | Females | Overall | |
| Sensitivity | 78% | 76% | 78% | 82% | 81% | 82% |
| Specificity | 92% | 85% | 90% | 83% | 78% | 81% |
| Patients with R wave amplitude < 10 mm (n = 220, 169 males/51 females) | ||||||
| Sensitivity | 53% | 56% | 54% | 87% | 88% | 88% |
| Specificity | 92% | 91% | 92% | 88% | 94% | 90% |
| Patients with R wave amplitude > 20 mm (n = 80, 74 males/6 females) | ||||||
| Sensitivity | 86% | 89% | 88% | 70% | 71% | 71% |
| Specificity | 66% | 70% | 66% | 87% | 88% | 88% |
In patients with an R wave equal to or less than 10 mm, the sensitivity of the ST depression was 54% and increased to 88% using the ratio. By calculating the ratio, the specificity decreased to 90% from 92%. When testing the measurements in the male and female subgroups sensitivities were 53% and 87% for males, and 56% and 88% for the female group for ST depression and ST/R ratio respectively. The specificity of our male subgroup was 92% and 88%, as opposed to 91% and 94% for the female subgroup.
In patients with tall R waves equal to or greater than 20 mm, the sensitivity was low for the ST/R ratio (71%) compared to the conventional ST depression (88%), but the specificity was much higher (88% vs 46%). Similar results were obtained when we evaluated the male and female subgroups. The sensitivities were 86% and 70% in males, while females showed sensitivities of 89% and 71% for ST Depression and ST/R ratio respectively. Increased specificities were also evident in the two subgroups, with the males showing an increase from 67% to 87% and females from 70% to 88%. See Figure 2 for depiction of patients with short and tall R waves.
Figure 2.
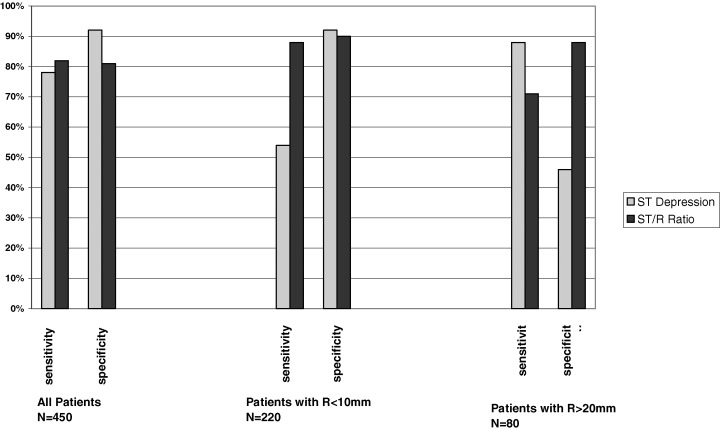
Sensitivity and Specificity according to R wave amplitude.
DISCUSSION
It is truly remarkable that although ECG changes were first recognized as markers for ischemia about 1918, 4 here almost 90 years later we are still discovering that there is more to learn in this area. In the last few years numerous articles point out new ECG markers that have utility. 5 , 6 , 7 , 8
This study indicates that the accuracy of ST interpretation can be improved by the use of the ST/R ratio. The use of 1 mm of ST depression lacks both sensitivity and specificity, and the logic of correcting for the total voltage of the lead seems elementary. In the total population, when using the ST/R ratio, the sensitivity was improved by 4% and specificity remained fairly high.
In those with low‐voltage R waves, the sensitivity was markedly increased. Figure 2 illustrates the effect of R wave amplitude on the ST/R ratio using 1.0 mm ST depression. When the R wave is very tall, there are many false positives but few false negatives, and correcting the ST for R wave amplitude reduces the number of false positives. When the R wave is small, there are many false negatives but few false positives. It would appear that it is worth giving up sensitivity in patients with tall R waves to improve the specificity and increase the sensitivity in those with short R waves.
Santinga et al, 9 who may have been the first to report on the effect of lead strength in 98 patients who had coronary angiograms and concluded that high‐voltage leads would increase the number of false positives if 1 mm of ST depression remained the standard. They also found that using 0.5 mm of ST depression when evaluating the unipolar V5 lead increased sensitivity without loss of specificity. Our population with taller R waves confirmed Santinga's data revealing a marked reduction in specificity with ST depression (46%). This was improved by the ST/R ratio, but at the cost of a modest drop in sensitivity (71%).
Hakki 10 reported that the sensitivity of exercise testing in subjects with R wave amplitude less than 11 mm was only 8%; considerably less than that in subjects with a greater R wave magnitude where the sensitivity was 49%. Thus, in this group, there is a need for an alternative method of evaluating ST changes. In patients with reduced R wave voltage, the specificity holds up quite well, although the very high specificity of the routine ST measurement must be recognized as the possible equivalent of a 2 mm ST depression seen in stronger leads.
Detrano 11 adjusted ST depression for R wave amplitude and found that the sensitivity was significantly improved at a specificity of 0.94, but if lower specificities were selected there was little difference between the R wave‐corrected ST ratio and the conventional ST depression. He reported that accounting for R wave amplitude was only useful when the ST depression was 1.5 mm or more. Hollenberg's 12 score and a similar iteration by Vergari 13 are improved by correcting ST changes for R wave amplitude. Our findings confirm the previous reports but the sensitivity and specificity are somewhat improved.
Our differentiation between males and females in each subgroup did not show any statistically significant difference. The increased tendency for false positive ST response was first noted in women by Scherlis and associates, 14 as early as 1950 and confirmed by Lepeschkin and Surawicz 15 in 1958 and Astrand 16 in 1965. In all studies, we must remember that the population under scrutiny determines the findings. Most reported series analyzing ST depression in women are from cardiac centers where women with chest pain syndromes are sent for angiography. Thus, the symptoms and signs determine the sampling. When women with chest discomfort, for whatever cause, come to undergo angiography, they are likely to have been screened with an exercise test. If the test is normal, few are sent for angiography. Consequently the sampling favors those with ST depression. Our study is guilty of the same bias. We must note that most studies evaluating ST changes in women are based on ST Depression. Even though our study was not originally oriented towards differentiation in terms of male and female population, the results support a similar incidence when evaluation for the ST/R ratio. In our study group only 19% were females, of which 90% had an R wave <10 mm. That could explain the similarity in the sensitivity values between the male and female subgroups of the <10 mm R wave group. Similarly in the selection process of our control group, no particular effort was made to include similar numbers of males and females for a more sensitive analysis and comparison between the two. Moreover, the average age of our population (61.5 years) could be the reason for the lower false positive rates in the females. Data by Wu suggests that young women with low prevalence of CAD and a high estrogen level show a higher prevalence of exercise‐induced ST Depression than do men. This trend reverses in patients older than 45, which is the range of our population, which would translate to a decreased false positive rate and a higher reliability of both the ST depression and ST/R ratio.
LIMITATIONS
A number of limitations of this study should be enumerated. The retrospective approach results in a selection bias based on the fact that all patients were believed by their attending physician to have a high enough probability of disease that they were referred for angiography. As previously mentioned the symptoms and signs determine the sampling. When women or men with chest discomfort, for whatever cause, come to undergo angiography, they are likely to have been screened with an exercise test. If the test is normal, few are sent for angiography. Consequently the sampling favors those with ST depression. Our study is guilty of the same bias.
Most recently, physicians have chosen an added modality to the exercise test, such as stress echocardiography or nuclear imaging as the first screening tool and a more sensitive decision as to whether an angiogram is further needed or not. This practice could improve the discrepancy between study and control groups. It is important to mention that in our collected data, which ranged from 1998 to 2003, we do have nuclear imaging data for the most recent years (2000–2003). A future approach could be to evaluate the ST/R ratio and ST Depression changes in both men and women and compare them to both the nuclear imaging and coronary angiography results.
Our data suggests that the correction of ST depression for R wave amplitude has ultimate logic and is especially useful in patients with low precordial R waves. It also suggests that the higher number of false positive tests in those with very tall R waves can be reduced significantly. We believe that calculating the ST/R ratio should be routine when the exercise ECG is evaluated.
REFERENCES
- 1. Hollenberg M, Go J Jr, Massie BM, et al. Influence of R‐wave amplitude on exercise‐induced ST depression: Need for a "gain factor" correlation when interpreting stress electrocardiograms. Am J Cardiol 1985;56:13–17. [DOI] [PubMed] [Google Scholar]
- 2. Ellestad MH. Stress Testing: Principles and Practices, 3rd Edition. Philadelphia , FA Davis,1985. [Google Scholar]
- 3. Mason RE, Liker I. A new system of multiple lead electrocardiography. Am Heart J 1966;31:196 [DOI] [PubMed] [Google Scholar]
- 4. Bousfield G. Angina pectoris: Changes in electrocardiogram during paroxysm. Lancet 1918;2:457. [Google Scholar]
- 5. Miranda CP, Lehmann KG, Froelicher VF. Correlation between resting ST segment changes, exercise testing, coronary angiography, and long term prognosis. Am Heart J 1991;122:1617–28. [DOI] [PubMed] [Google Scholar]
- 6. Michaelides AP, Boudoulas H, Vyssoulis GP, et al. Exercise induced S‐wave prolongation in anterior left descending coronary stenosis. Am J Cardiol 1992;70:1407–11. [DOI] [PubMed] [Google Scholar]
- 7. Pandya A, Ellestad MH, Crump R. Time course of changes in P wave duration during exercise. Cardiology 1996;87:343. [DOI] [PubMed] [Google Scholar]
- 8. Elliott SE, Miller CW, Armstrong WT Jr, et al. The use of the digital computer in the study of patients during exercise induced stress. Am Heart J 1970;79:215. [DOI] [PubMed] [Google Scholar]
- 9. Santinga JT, Brymer JF, Smith F, et al. The influence of lead strength on the ST changes with exercise electrocardiography (correlative study with coronary arteriography). J Electrocardiol 1977;10:387. [DOI] [PubMed] [Google Scholar]
- 10. Hakki AH, Iskandrian SD, Kutalek, et al. R‐wave amplitude: A new determinant of failure of patients with coronary artery disease to manifest ST segment depression during exercise. J Am Coll Cardiol 1984;3:1155. [DOI] [PubMed] [Google Scholar]
- 11. Detrano R, Salcedo E, Passalacqua M, et al. Exercise electrocardiographic variables: A critical appraisal. J Am Coll Cardiol 1986;8:836. [DOI] [PubMed] [Google Scholar]
- 12. Hollenberg M, Budge WR, Wisniski JA, et al. Treadmill score quantifies electrocardiographic response to exercise and improves test accuracy and reproducibility. Circulation 1980;61:276. [DOI] [PubMed] [Google Scholar]
- 13. Vegari J, Hakki AH, Heo J, et al. Merits and limitations of quantitative treadmill exercise score. Am Heart J 1987;114:819. [DOI] [PubMed] [Google Scholar]
- 14. Scherlis L, Sandberg AA, Wener J, et al. Effects of single and double two step exercise tests upon electrocardiogram of 200 normal persons. J Mt Sinai Hosp 1950;7:242–253. [PubMed] [Google Scholar]
- 15. Lepeschkin E, Surawicz B. Characteristics of true positive and false positive results of electrocardiographic Masters two step tests. N Engl J Med 1958;258:511–520. [DOI] [PubMed] [Google Scholar]
- 16. Astrand I. Electrocardiograms recorded twice within an 8 year interval in a group of 204 women and men. Acta Med Scand 1965;178:27–39. [PubMed] [Google Scholar]
- 17. Weiner DA, Ryan JT, McCabe CH, et al. Correlations among history of angina, ST segment response and prevalence of coronary artery disease in the Coronary Artery Surgery Study. N Engl J Med 1979;301:230. [DOI] [PubMed] [Google Scholar]
- 18. Greenberg PS, Ellestad MH. Comparison of the multivariate analysis and CADENZA systems for determination of the probability of coronary artery disease. Am J Cardiol 1984;53:493. [DOI] [PubMed] [Google Scholar]
- 19. Deckers JW, Rensing BJ, Tijssen JGP, et al. A comparison of methods of analyzing exercise tests for diagnosis of coronary artery disease. Br Heart J 1989;62:438. [DOI] [PMC free article] [PubMed] [Google Scholar]
- 20. Ellestad MH. Role of atrial repolarization in false‐positive exercise tests. J Am Coll Cardiol 1991;18:136. [DOI] [PubMed] [Google Scholar]
- 21. Chaitman BR, Bourassa MG, Wagniart P, et al. Improved efficiency of treadmill exercise testing using a multiple lead system. Circulation 1978;57:71. [DOI] [PubMed] [Google Scholar]
- 22. Ellestad MH, Crump R, Surber M. The significance of lead strength on ST changes during treadmill stress tests. J Electrocardiol 1992;25(suppl 31‐34). [DOI] [PubMed] [Google Scholar]
- 23. Martin CM, McConahay DR. Maximal treadmill exercise electrocardiography: Correlations with coronary arteriography and cardiac hemodynamics. Circulation 1972;46:956–962. [DOI] [PubMed] [Google Scholar]