

Abstract
Background: QT prolongation as can be induced by drugs, signals the risk of life‐threatening arrhythmias. The methodology of QT measurement in the modular ECG analysis system (MEANS) is described.
Methods: In the simultaneously recorded leads of the standard 12‐lead electrocardiogram (ECG), the QRS complexes are detected by a spatial velocity function. They are typed as dominant or nondominant, and a representative complex per lead is obtained by averaging over the dominant complexes. QRS onset and T end are determined by a template technique, and QT is measured. MEANS performance was evaluated on the 125 ECGs of the common standards for quantitative electrocardiography (CSE) multilead database, of which the waveform boundaries have been released.
Results: MEANS detected correctly all 1445 complexes of the CSE library, with one false‐positive detection due to a sudden baseline jump. All dominant complexes were correctly typed. The average of the differences between MEANS and reference was less than 2 ms (=1 sample) for both QRS onset and T end, and 2.1 ms for QT duration. The standard deviation of the differences was 3.8, 8.4, and 10.4 ms, respectively.
Conclusions: A standard deviation of 10.4 ms for QT measurement seems large when related to the regulatory requirement that a prolongation as small as 5 ms should be detected. However, QT variabilities as encountered in different individuals will be larger than when measured in one individual during pharmacological intervention. Finally, if the U wave is part of the total repolarization, then T and U form a continuum and the end of T becomes questionable.
Keywords: ECG computer program, QT interval, QT prolongation, long QT, U wave
The QT interval in the electrocardiogram (ECG) carries important diagnostic and prognostic information. 1 Prolongation or shortening of the QT interval may have several causes. Drug‐induced or congenital QT prolongation is a risk marker for the occurrence of life‐threatening arrhythmias. 2 , 3 In these days, for each newly developed drug a dedicated clinical study has to be performed to assess its potential for QT prolongation. In these so‐called “thorough QT” studies, precise measurement of the QT interval is of paramount importance because regulatory agencies require that changes in the QT interval as small as 5 ms should be detected. 4
Computerized measurement of the QT interval has several advantages over manual assessment: computer programs do not suffer from fatigue and intraobserver variability and offer substantial savings in time and money. Moreover, recent studies show that a majority of health care practitioners “cannot recognize a long QT when they see one.” 5 , 6 , 7
Here we describe the methodology of QT measurement in the modular ECG analysis system (MEANS), 8 of which the origins date back to the early 1970s. 9 , 10 MEANS provides a rhythm analysis and a morphological interpretation of the standard 12‐lead ECG or the (reconstructed) vectorcardiogram (VCG). As its name suggests, MEANS has a modular setup, 11 in which each software module carries out a well‐defined ECG‐processing task. In the following, we will focus on the signal‐analysis modules that are involved in QT measurement. The performance of the different MEANS algorithms has been evaluated on the common standards for quantitative electrocardiography (CSE) multilead database. 12 We will review these performance results, and finally discuss some inherent limitations in assessing the QT interval.
METHODS
MEANS takes as its input the simultaneously recorded leads of the standard 12‐lead ECG or the VCG. Typically, the signals are sampled at a rate of 500 Hz, for a duration of 10 s, but other sampling rates and recording durations can be handled by MEANS as well. For QT measurement, MEANS performs the following processing steps: signal conditioning; QRS detection; QRS typing; construction of a representative P‐QRS‐T complex; and waveform recognition. We will briefly describe each of these steps.
Signal Conditioning
ECG records may be disturbed by different types of artifacts: powerline interference, baseline wander, muscle noise, spikes, and amplitude saturation. MEANS incorporates algorithms to detect and, in as much as possible, correct these artifacts. Prior to QRS detection, powerline interference is routinely corrected using the incremental estimation filter proposed by Mortara 13 and further investigated by others. 14 , 15
Excessive noise is detected by using the residuals of a simple moving average filter. Residuals from QRS complexes are discarded in the noise‐detection procedure. The exponentially weighted sum of the absolute values of the residuals determines the amount of noise; a value of 35 μV proved to be an acceptable threshold to consider noise as excessive.
For baseline wander correction, MEANS uses a linear interpolation method which approximates the baseline by straight lines between isoelectric levels estimated from the interval preceding each QRS onset. Since baseline correction may introduce new distortions, leads with minimal or no baseline wander are not corrected. 14
Sudden baseline shifts or spikes are judged to be present if the first derivative of one of the lead signals exceeds a certain threshold value.
QRS Detection
The QRS detector of MEANS operates on multiple simultaneously recorded leads. 16 The simultaneous leads are transformed to a detection function, which brings out the QRS complexes among the other parts of the signal. The detection function used in MEANS is the spatial velocity, defined as
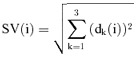 |
where dk (i) = xk(i + 1) − xk(i − 1) are approximations of the first derivates of the VCG leads X, Y, and Z. If only the 12‐lead ECG is available, the VCG leads are reconstructed from the ECG leads by linear transformation. 17 The detection signal is gauged against an adaptable threshold to detect the occurrence of a QRS complex. The threshold is set as a fraction of the average of the local extrema in the spatial velocity which were labeled as QRS complexes. Once a potential QRS complex is detected, further heuristic criteria are applied to exclude false‐positive detections, for example, by requiring a minimum time lag between adjacent QRS locations.
QRS Typing
QRS typing is essentially a clustering task followed by a classification task, as the case requires. The clustering attempts to distinguish between different types, or families, of QRS complexes. Within one family the complexes are similar in QRS morphology. If more than one type has been detected, the classification task is to determine which one is the dominant type, that is, the family of complexes to be used for the morphological analysis. To determine whether two complexes are of the same type, the clustering method in MEANS uses a decision tree that involves two similarity measures, reflecting similarity in shape and in power. 16
Constructing a Representative Complex
MEANS uses coherent or ensemble averaging of the dominant complexes to obtain a representative complex. This technique computes the average of the time‐aligned complexes at each sample point, and has been shown to yield optimal noise reduction for Gaussian distributed noise. 18 Since the average is vulnerable for outliers, it is imperative that complexes affected by sudden baseline shifts or other major disturbances are excluded from averaging. In particular, MEANS incorporates an algorithm for ST‐T typing, 14 and excludes complexes with largely deviating ST‐T segments from averaging.
Waveform Recognition
Waveform, or boundary, recognition deals with the determination of inflectional points (P onset, P end, QRS onset, QRS end, and T end) in the representative complex. Since isoelectric segments in the initial or terminal parts of a wave may yield differences between leads in the location of inflectional points, the true wave onsets and offsets should be determined across multiple leads. MEANS therefore uses the spatial velocity SV(i), as defined above, as its detection function for waveform recognition. To further reduce the noise in the representative complexes from which the spatial velocity is constructed, MEANS applies an adaptive Gaussian filter. 19 The frequency characteristics of the filter are dependent on the estimated curvature of the signal to be filtered. A curvature estimate is obtained by fitting a polynomial function. The width of the filter is then adjusted according to the curvature, where low curvature (e.g., in the PR interval) implies a low‐frequency cutoff, and a high curvature (e.g., in the QRS complex) a cutoff at higher frequencies.
The actual boundary detection is done by matching the detection function with a template. The template method takes into account information on the time–amplitude distribution of the detection function in a window around the inflectional point. 20 A template is constructed from a learning set of detection functions, SVl(i), l = 1, …, L, in which the wave boundaries were marked by a human observer. After normalization of the spatial velocities, a time–amplitude window is defined as
in which io is the wave‐recognition marking of the observer, and the indices n =− N, …, M and λ=λ1, …, λ2 determine the window size. A template is then constructed according to
To determine the boundary point in a new ECG, the template is cross‐correlated with a time–amplitude window of the ECG:
The boundary point is then that point where C(i) is maximal.
For QRS onset determination, the amplitude thresholds λ1 and λ2 are initially set at 2.6% and 3.6% of the maximal spatial velocity. If the correlation is greater than 80% of the maximum attainable value, the correct QRS onset is assumed to have been found. If not, both thresholds are increased by a step of 1% and the procedure is repeated until the correlation exceeds 80% or a threshold limit is reached. In the latter case, MEANS cannot perform a reliable waveform recognition.
For the determination of the end of the T wave, λ1 and λ2 are fixed. For high heart rates the template differs from that for lower heart rates, to take care of the P‐on‐T phenomenon occurring at higher heart rates. When the correlation is less than 80% of the maximum, MEANS enters a thresholding algorithm to locate the minimum of the spatial velocity, which is then taken as the end of the T wave.
Evaluation
The QRS detection and typing and the waveform recognition of MEANS were evaluated on the multilead database that was collected in the CSE project. 12 , 21 This database comprises 250 ECGs with 15 simultaneously recorded leads―the 12 standard ECG leads and the Frank XYZ leads. The median waveform‐recognition results of 11 ECG and six VCG programs participating in the CSE study were taken as the reference. A group of five cardiologists reviewed a random set of about 20% of the cases in a two‐round process, and it was shown that the median of the program results was almost identical to the median results of the referees. 12 The 250 ECGs in the database were divided over two sets of 125 cases. About 75% of the ECGs in each set had abnormalities, such as infarctions, hypertrophies, or bundle branch blocks, with their accompanying T‐wave abnormalities. 22 The waveform reference results of one set have been made public; 22 the results of the other set remain under lock and key at the CSE coordinating center for independent testing. Here we will only use the set for which the reference points were released. Two of the 125 cases had an artificial pacemaker and were not analyzed.
RESULTS
We assessed the performance of the MEANS algorithms for QRS detection and typing, and for waveform recognition on the CSE multilead data set. It should be noted that the CSE library has not been used for training the MEANS algorithms, and thus acts as an independent test set.
QRS Detection and Typing
MEANS correctly identified all 1445 QRS complexes in the multilead library. There was one false‐positive detection due to a sudden baseline jump. The MEANS performance for QRS typing on the same data set is shown in Table 1. All dominant complexes (type 1) were correctly typed. The one false‐positive QRS detection was erroneously classified as type 4 (not shown in the table).
Table 1.
QRS‐typing Results of MEANS for 123 ECGs from the CSE Multilead Database
| Reference | Computer | ||
|---|---|---|---|
| Type 1 | Type 2 | Type 3 | |
| Type 1 | 1401 | 0 | 0 |
| Type 2 | 0 | 38 | 1 |
| Type 3 | 0 | 0 | 5 |
Type 1 is the dominant type of QRS complex in each ECG, types 2 and 3 are non‐dominant types.
Waveform Recognition
Table 2 shows the performance results of MEANS for QRS onset, T end, and the QT interval. For each inflectional point, mean and standard deviation of the differences between MEANS and the reference are first calculated for all ECGs, and subsequently for the ECGs remaining after removal of outliers, defined as the 2% (for QRS onset) or 3% (for T end) cases with the most extreme differences. The latter procedure was adopted in the CSE project 12 and has been included here for ease of comparison with other studies. Mean differences for both QRS onset and T end are less than 2 ms (i.e., one sample point at 500 Hz sampling rate). More importantly, the standard deviations of the differences are well within the tolerance limits that were deemed acceptable in the CSE project (6.5 ms for QRS onset, 30.6 ms for T end). 23 The standard deviation of the differences in the QT interval is 13.3 ms. Figure 1 shows a Bland–Altman plot 24 of the differences between the QT‐interval measurement of MEANS and the reference. It appears there is no systematic variation of the differences with the mean.
Table 2.
Differences (in ms) in QRS Onset, T Offset, and QT Interval between MEANS and the Reference Standard for the CSE Multilead Database
| No Outliers Removed | Outliers Removed | |||
|---|---|---|---|---|
| n | Mean (SD) | n | Mean (SD) | |
| QRS onset | 123 | −1.7 (5.4) | 121 | −1.2 (3.8) |
| T end | 123 | 1.0 (11.2) | 119 | 0.6 (8.4) |
| QT interval | 123 | 2.7 (13.3) | 119 | 2.1 (10.4) |
Figure 1.
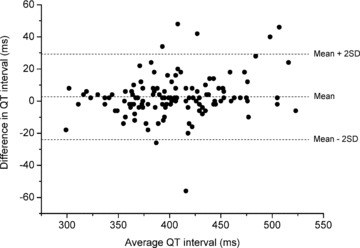
Difference against mean of MEANS and reference QT measurement on 123 ECGs.
DISCUSSION
We have described the MEANS processing steps that are involved in the determination of the QT interval. Our method of choice for the recognition of boundary points is template matching. In the CSE project, the performance of this method was compared with that of 13 other ECG and VCG computer programs, incorporating a variety of waveform‐recognition algorithms. Based on all 250 cases of the multilead library, but after removal of outliers, standard deviations of the differences between programs and reference ranged from 2.6 to 6.4 ms for QRS onset, and from 6.2 to 24.2 ms for T end, with a median of 3.4 and 13.2 ms, respectively. 25 For the QT interval, standard deviations varied between 6.4 and 15.8 ms (median 10.6 ms). 12 These values may be compared with the MEANS standard deviations of 3.8 ms for QRS onset, 8.4 ms for T end, and 10.4 ms for QT interval reported in this study.
All ECG and VCG computer programs that participated in the CSE project used detection functions derived from multiple simultaneously recorded leads. Single‐lead approaches for waveform recognition have extensively been studied, 26 but few were validated on the CSE multilead database. In one such study, 27 wave boundary points were located in each individual lead with a threshold detection algorithm and were then combined over the leads to yield overall onsets and offsets. Reported standard deviations of the differences, after removal of outliers, were 4.2 ms for QRS onset and 16.5 ms for T end. 27 The relatively large value for the end of the T wave suggests that waveform‐recognition approaches that use a detection function based on multiple leads perform better than a single‐lead approach.
The influence of noise on the MEANS waveform recognition has also been assessed in the CSE project. 28 Different types of high‐ and low‐frequency noise were added to each of 10 noise‐free recordings. Mains interference and baseline wander had no significant effect on the boundary detection of MEANS. Increasing amounts of high‐frequency noise caused an outward shift of QRS onset and T end, although to a lesser extent than most of the other programs in the study. 28 We may conclude that the MEANS waveform recognition works well in a noisy environment.
MEANS has been used in epidemiological studies to assess the predictive value of a variety of ECG parameters, 29 , 30 , 31 including the (corrected) QT interval. 32 , 33 , 34 The measurement program has been the basis for MCMEANS, 35 , 36 a program that classifies an ECG according to the Minnesota Code 37 and has also been used in several prognostic studies. 38 , 39 , 40 MEANS has not yet been used in thorough QT studies, and considering its standard deviation for QT measurement of 13.3 ms, one may wonder whether MEANS (or any other program) can reliably detect QT prolongations as small as 5 ms, as required by the regulatory guidelines. 4 However, these figures cannot simply be compared. For the CSE database, the standard deviations are based on measurements in ECGs of different individuals. In thorough QT studies, interval differences between ECGs of the same individual as a function of pharmacological intervention are assessed. As intraindividual ECG variability is generally much smaller than interindividual variability, lower standard deviations are to be expected in the case of serial QT‐interval comparison. How low these values will be for MEANS is to be further investigated.
Determination of T offset is clearly the most intricate part of QT measurement. The end of the T wave is ill‐defined because the T wave tapers off more or less gradually to the baseline. Also the T may have a very low amplitude, or have a following P wave superimposed on it. The T wave may also be trailed by a U wave, which is mostly regarded as a nuisance, obscuring the end of T. 41 However, the U wave deserves more attention than this. It has been argued by our group that the repolarization of the myocardium in its totality is only completed at the end of U. 42 , 43 T and U form a continuum, in which case searching for the common end of the T wave is not pertinent, in the same way as it is impossible to ask for the common end of a Q wave in the QRS. This means that our ideas about QT duration and prolongation, whether drug‐induced or congenital, may have to be reassessed.
Conflicts of Interest: The Department of Medical Informatics has a license agreement with Welch Allyn for the use of MEANS.
REFERENCES
- 1. Elming H, Sonne J, Lublin HK. The importance of the QT interval: A review of the literature. Acta Psychiatr Scand 2003;107:96–101. [DOI] [PubMed] [Google Scholar]
- 2. Haverkamp W, Breithardt G, Camm AJ, et al The potential for QT prolongation and proarrhythmia by non‐antiarrhythmic drugs: Clinical and regulatory implications. Report on a policy conference of the European Society of Cardiology. Eur Heart J 2000;21:1216–1231. [DOI] [PubMed] [Google Scholar]
- 3. Collins KK, Van Hare GF. Advances in congenital long QT syndrome. Curr Opin Pediatr 2006;18:497–502. [DOI] [PubMed] [Google Scholar]
- 4. The Clinical Evaluation of QT/QTc Interval Prolongation and Proarrhythmic Potential for Non‐Antiarrhythmic Drugs: E14. Geneva , International Conference on Harmonization of Technical Requirements for Registration of Pharmaceuticals for Human Use, 2005.
- 5. LaPointe NM, Al‐Khatib SM, Kramer JM, et al Knowledge deficits related to the QT interval could affect patient safety. Ann Noninvasive Electrocardiol 2003;8:157–160. [DOI] [PMC free article] [PubMed] [Google Scholar]
- 6. Al‐Khatib SM, Allen LaPointe NM, Kramer JM, et al A survey of health care practitioners’ knowledge of the QT interval. J Gen Intern Med 2005;20:392–396. [DOI] [PMC free article] [PubMed] [Google Scholar]
- 7. Viskin S, Rosovski U, Sands AJ, et al Inaccurate electrocardiographic interpretation of long QT: The majority of physicians cannot recognize a long QT when they see one. Heart Rhythm 2005;2:569–574. [DOI] [PubMed] [Google Scholar]
- 8. Van Bemmel JH, Kors JA, Van Herpen G. Methodology of the modular ECG analysis system MEANS. Methods Inf Med 1990;29:346–353. [PubMed] [Google Scholar]
- 9. Van Bemmel JH, Duisterhout JS, Van Herpen G, et al Push‐button VCG/ECG processing system In Zywietz C, Schneider B. (eds.): Computer Application on ECG and VCG Analysis. Amsterdam , North‐Holland, 1973, pp. 112–130. [Google Scholar]
- 10. Talmon JL, Van Bemmel JH. Modular software for computer‐assisted ECG/VCG interpretation In Anderson J, Forsythe JM. (eds.): Medinfo 1974. Amsterdam , North‐Holland, 1974, pp. 653–657. [Google Scholar]
- 11. Talmon JL, Van Bemmel JH. The advantage of modular software design in computerized ECG analysis. Med Inform 1986;11:117–128. [DOI] [PubMed] [Google Scholar]
- 12. Willems JL, Arnaud P, Van Bemmel JH, et al A reference data base for multilead electrocardiographic computer measurement programs. J Am Coll Cardiol 1987;10:1313–1321. [DOI] [PubMed] [Google Scholar]
- 13. Mortara DW. Digital filters for ECG signals In Ostrow HG, Ripley KL. (eds.): Computers in Cardiology 1977. New York , IEEE Comput Soc, 1977, pp. 511–514. [Google Scholar]
- 14. Talmon JL. Pattern Recognition of the ECG. A Structured Aanalysis [dissertation]. Amsterdam , Free University, 1983. [Google Scholar]
- 15. McManus CD, Neubert KD, Cramer E. Characterization and elimination of AC noise in electrocardiograms: A comparison of digital filtering methods. Comput Biomed Res 1993;26:48–67. [DOI] [PubMed] [Google Scholar]
- 16. Kors JA, Talmon JL, Van Bemmel JH. Multilead ECG analysis. Comput Biomed Res 1986;19:28–46. [DOI] [PubMed] [Google Scholar]
- 17. Kors JA, Van Herpen G, Sittig AC, et al Reconstruction of the Frank vectorcardiogram from standard electrocardiographic leads: Diagnostic comparison of different methods. Eur Heart J 1990;11:1083–1092. [DOI] [PubMed] [Google Scholar]
- 18. Rompelman O, Ros HH. Coherent averaging technique: A tutorial review. Part 1: Noise reduction and the equivalent filter. J Biomed Eng 1986;8:24–29. [DOI] [PubMed] [Google Scholar]
- 19. Talmon JL, Kors JA, Van Bemmel JH. Adaptive Gaussian filtering in routine ECG/VCG analysis. IEEE Trans Acoustics Speech Signal Process 1986;34:527–534. [Google Scholar]
- 20. Van Bemmel JH, Talmon JL, Duisterhout JS, et al Template waveform recognition applied to ECG‐VCG analysis. Comput Biomed Res 1973;6:430–441. [DOI] [PubMed] [Google Scholar]
- 21. Willems JL, Arnaud P, Van Bemmel JH, et al Common standards for quantitative electrocardiography: Goals and main results. CSE Working Party. Methods Inf Med 1990;29:263–271. [PubMed] [Google Scholar]
- 22. Willems JL. Common standards for quantitative electrocardiography. CSE Multilead Atlas. Measurement Results—Data Set 3. Leuven , ACCO, 1988. [Google Scholar]
- 23. The CSE Working Party . Recommendations for measurement standards in quantitative electrocardiography. Eur Heart J 1985;6:815–825. [PubMed] [Google Scholar]
- 24. Bland JM, Altman DG. Statistical methods for assessing agreement between two methods of clinical measurement. Lancet 1986;i:307–310. [PubMed] [Google Scholar]
- 25. Willems JL. Common Standards for Quantitative Electrocardiography. 6th CSE Progress Report. Leuven , ACCO, 1986. [Google Scholar]
- 26. Kohler BU, Hennig C, Orglmeister R. The principles of software QRS detection. IEEE Eng Med Biol Mag 2002;21:42–57. [DOI] [PubMed] [Google Scholar]
- 27. Laguna P, Jane R, Caminal P. Automatic detection of wave boundaries in multilead ECG signals: Validation with the CSE database. Comput Biomed Res 1994;27:45–60. [DOI] [PubMed] [Google Scholar]
- 28. Willems JL, Zywietz C, Arnaud P, et al Influence of noise on wave boundary recognition by ECG measurement programs. Recommendations for preprocessing. Comput Biomed Res 1987;20:543–562. [DOI] [PubMed] [Google Scholar]
- 29. Kors JA, De Bruyne MC, Hoes AW, et al T axis as an indicator of risk of cardiac events in elderly people. Lancet 1998;352:601–605. [DOI] [PubMed] [Google Scholar]
- 30. Kardys I, Kors JA, Van Der Meer IM, et al Spatial QRS‐T angle predicts cardiac death in a general population. Eur Heart J 2003;24:1357–1364. [DOI] [PubMed] [Google Scholar]
- 31. Kors JA, Rijnbeek P, Van Herpen G, et al Spatial repolarization parameters for predicting cardiac death in the elderly. J Electrocardiol 2004;37(Suppl):198–200. [DOI] [PubMed] [Google Scholar]
- 32. De Bruyne MC, Hoes AW, Kors JA, et al Prolonged QT interval predicts cardiac and all‐cause mortality in the elderly. The Rotterdam Study. Eur Heart J 1999;20:278–284. [DOI] [PubMed] [Google Scholar]
- 33. Straus SM, Kors JA, De Bruin ML, et al Prolonged QTc interval and risk of sudden cardiac death in a population of older adults. J Am Coll Cardiol 2006;47:362–367. [DOI] [PubMed] [Google Scholar]
- 34. Aarnoudse AJ, Newton‐Cheh C, De Bakker PI, et al Common NOS1AP variants are associated with a prolonged QTc interval in the Rotterdam Study. Circulation 2007;116:10–16. [DOI] [PubMed] [Google Scholar]
- 35. Kors JA, Van Herpen G, Wu J, et al Validation of a new computer program for Minnesota coding. J Electrocardiol 1996;29(Suppl):83–88. [DOI] [PubMed] [Google Scholar]
- 36. Kors JA, Crow RS, Hannan PJ, et al Comparison of computer‐assigned Minnesota Codes with the visual standard method for new coronary heart disease events. Am J Epidemiol 2000;151:790–797. [DOI] [PubMed] [Google Scholar]
- 37. Prineas RJ, Crow RS, Blackburn H. The Minnesota Code Manual of Electrocardiographic Findings. Boston , John Wright‐PSG, 1982. [Google Scholar]
- 38. Diercks GF, Hillege HL, Van Boven AJ, et al Relation between albumin in the urine and electrocardiographic markers of myocardial ischemia in patients without diabetes mellitus. Am J Cardiol 2001;88:771–774. [DOI] [PubMed] [Google Scholar]
- 39. Roger VL, Killian JM, Weston SA, et al Redefinition of myocardial infarction: Prospective evaluation in the community. Circulation 2006;114:790–797. [DOI] [PubMed] [Google Scholar]
- 40. Ammar KA, Makwana R, Jacobsen SJ, et al Impaired functional status and echocardiographic abnormalities signifying global dysfunction enhance the prognostic significance of previously unrecognized myocardial infarction detected by electrocardiography. Ann Noninvasive Electrocardiol 2007;12:27–37. [DOI] [PMC free article] [PubMed] [Google Scholar]
- 41. Surawicz B. U wave: Facts, hypotheses, misconceptions, and misnomers. J Cardiovasc Electrophysiol 1998;9:1117–1128. [DOI] [PubMed] [Google Scholar]
- 42. Ritsema van Eck HJ, Kors JA, Van Herpen G. The elusive U wave: A simple explanation of its genesis. J Electrocardiol 2003;36(Suppl):133–137. [DOI] [PubMed] [Google Scholar]
- 43. Ritsema van Eck HJ, Kors JA, Van Herpen G. The U wave in the electrocardiogram: A solution for a 100‐year‐old riddle. Cardiovasc Res 2005;67:256–262. [DOI] [PubMed] [Google Scholar]