Abstract
Heart rate variability (HRV) is significantly associated with average heart rate (HR), therefore, HRV actually provides information on two quantities, that is, on HR and its variability. It is difficult to conclude which of these two plays a principal role in the HRV clinical value, or in other words, what is the HR contribution to the clinical significance of HRV. Moreover, the association between HRV and HR is both a physiological phenomenon and a mathematical one. The physiological HRV dependence on HR is determined by the autonomic nervous system activity, but the mathematical one is caused by the nonlinear relationship between RR interval and HR. By employing modification methods of the HRV and HR relationship, it is possible to investigate the HR contribution to the HRV clinical value. Recent studies have shown that the removal of the HR impact on HRV makes HRV more predictive for noncardiac death, however, the enhancement of this impact causes HRV to be a better predictor of cardiovascular mortality. Thus, HR seems to constitute a cardiovascular factor of the HRV predictive ability. HR also influences the reproducibility of HRV, therefore, HR changes should be considered when one compares HRV measurements in a given patient. This review summarizes methodological aspects of investigations of the HRV and HR interaction as well as latest observations concerning its clinical utility. The issues discussed in this article should also refer to any other heart rate dynamics analysis which indices are significantly associated with HR.
Keywords: heart rate, heart rate variability, autonomic nervous system, risk prediction, mortality
Heart rate variability (HRV) has been extensively investigated for many years in both clinical and experimental settings and turns out to be a valuable predictor of adverse outcomes in various diseases.1, 2, 3, 4, 5 Average heart rate (HR) is another risk factor which proved to be especially efficient in predicting cardiovascular events.6, 7, 8 It is commonly known that HRV is significantly associated with HR,9, 10 therefore, HRV actually provides information on two quantities, that is, on HR and its variability.11, 12 It is hard to conclude which of these two plays a principal role in the HRV prognostic value, or in other words, what is the HR contribution to prognostic power of HRV.12 This is even more important, since HR is a therapeutic target and recently new options of such a treatment have been implemented to the clinical practice7, 13, 14, 15—therefore, our understanding of the HRV dependence on HR becomes relevant for future therapeutic studies. This review summarizes methodological aspects of the investigation of the HRV and HR interaction as well as results of latest research concerning this issue.
PHYSIOLOGICAL AND MATHEMATICAL INTERACTION BETWEEN HRV AND HR
The association between HRV and HR is both a physiological phenomenon and a mathematical one. The physiological HRV dependence on HR is determined by the autonomic nervous system activity, that is, the higher parasympathetic nervous system activity, the slower HR and higher HRV.9, 10 It has been demonstrated in experimental studies that at least a part of the heart rate dependency of HRV may be a result of intrinsic properties of the sinus node, that is, the cycle length of sinoatrial myocytes is a nonlinear function of neuromediator concentration.16, 17 Consequently, the same degree of vagal activity causes higher RR interval prolongation at longer baseline RR intervals, resulting in higher HRV.16, 17, 18 On the other hand, the mathematical HRV dependence on HR is caused by the nonlinear (inverse) relationship between RR interval and heart rate.19, 20, 21, 22 Due to this mathematical rule, the standard HRV analysis may be mathematically biased, particularly if patients differ in their average heart rate (Fig. 1). To overcome it, one should calculate the variability of RR intervals corrected for the average RR interval (RR). In order to do that, one should divide the RR interval tachogram by the corresponding average RR—alternatively, one may divide standard deviation of RR intervals by average RR (i.e., calculation of coefficient of variation) or one can divide HRV power spectrum (or its components) by the average RR squared.19, 20, 21, 22 Such modifications do not remove any physiological differences in HRV between heart rhythms with different average HRs, it merely removes the mathematical bias.20 An example of how the mathematical rules may influence the HRV analysis results (when comparing patients with different average HR), is depicted in Figure 2.
Figure 1.
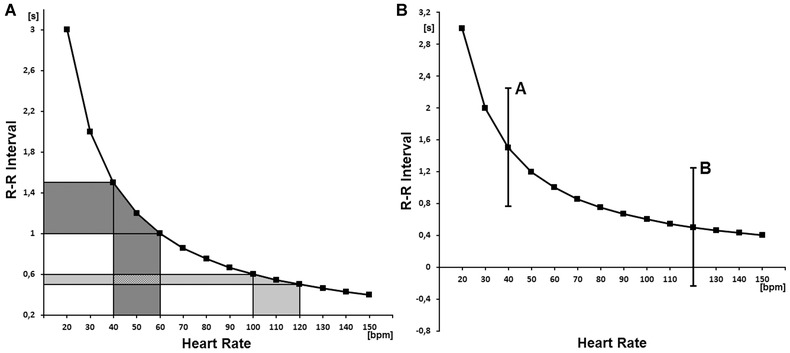
(A) the nonlinear (mathematical) relationship between RR interval and heart rate is depicted. One can see that the oscillations of a slow average heart rate (x‐axis, dark gray area) result in much greater oscillations of RR intervals (y‐axis, dark gray area) than the same oscillations of a fast average heart rate (light gray area). As a consequence, the variability of RR intervals is higher for the slow average heart rate than for the fast one, despite the fact that the variability of heart rate is the same. (B) the relationship between RR interval and heart rate with two hypothetical examples of RR interval oscillations (i.e., A and B) are presented. It is shown that the fluctuations of RR intervals may be potentially quite high for a slow average HR (A), however, such fluctuations are not possible for a fast average HR (B) since the RR intervals should have become negative.
Owing to the above phenomena, the standard analysis of heart rate variability may be mathematically biased. Reprinted with modification from Sacha.19
Figure 2.
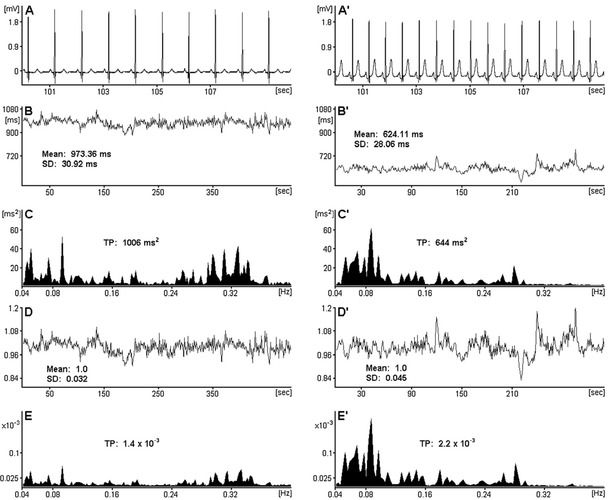
ECG segments and HRV analysis performed in patients with a slow average heart rate, that is, 62 bpm (panels A, B, C, D, E) and with a fast one, that is, 96 bpm (panels A′, B′, C′, D′, E′). In panels (for both patients respectively): (A, A′) 10‐second ECG segments; (B, B′) RR interval tachograms (512 heartbeats) and their means as well as standard deviations (SDs); (C, C′) HRV spectra estimated from the respective signals from panels B and B′ with the frequency band: 0.04–0.4 Hz and corresponding total powers (TPs) in this range; (D, D′) RR interval tachograms corrected for the respective average RR, with their means and SDs; (E, E′) HRV spectra estimated from the respective corrected signals from panels D and D′ with the frequency band: 0.04–0.4 Hz and corresponding TPs in this range (due to the division by an average value, the corrected tachograms and spectra become unitless). One can see that SD and TP calculated from actual RR intervals are greater for the patient with slow than fast average HR, however after the correction for HR, it turns out that the truth is different, that is, the fast rhythm is more variable in this case. Reprinted from Sacha and Pluta.20
It has been shown that the correction of HRV for the average HR is especially essential during the activation or inhibition of cardiac autonomic neural regulation which change HR—by employing such correction, one may differentiate between physiologically and mathematically mediated changes in HRV.23 Melenovsky et al. demonstrated that metoprolol‐induced changes of HRV and baroreflex sensitivty became insignificant after they were normalized to the same cycle length, suggesting that the improvement of cardiac autonomic control after beta‐blockade could be explained by a change of heart rate.18 Billman evaluated the effects of HR on the HRV response to various autonomic interventions in a canine model.23 All interventions that accelerated HR provoked large decrease in HRV even after correction for the accompanying increases in mean HR, while interventions that reduced HR yielded mixed results, that is, baroreceptor reflex activation provoked increases in HRV even after correction for the reflexively mediated reductions in HR, while, in contrast, beta‐adrenergic receptor blockade reduced rather than increased RR interval variability after correction for the drug‐induced HR reductions.23
There are also other physiological maneuvers which may provoke HRV changes associated with HR alterations, for example, head‐up tilt test or controlled respiration. However, it remains to be established to what extent the HRV changes during these interventions are physiologically and mathematically determined—by correction for the prevailing HR one is able to differentiate these two essentially different effects.
MODIFICATIONS OF HRV AND HR INTERACTION
The modification methods of the HRV and HR relationship has been recently further developed and now it turns out to be possible to completely remove the HR influence on HRV (even the physiological one), moreover, it is also possible to enhance the HRV dependence on HR.11 Such an approach enables us to investigate the HR contribution to the clinical value of HRV and we may explore which of the two quantities, that is, HR or its variability, really matters in terms of the patients prognosis.12 Shortly, to weaken or strengthen the HRV dependence on HR, one should respectively divide or multiply the RR interval tachograms (or HRV spectra) by the corresponding average RR (Fig. 3). The mechanism of such modifications is simple, that is, by division by the average RR, the HRV of slow HR is attenuated while that of fast HR is boosted and consequently HRV loses its dependence on HR; conversely, multiplication by the average RR amplifies the association between HRV and HR—the resulting HRV presents much higher dependence on HR than standard HRV.11 The higher power of average RR is used, the stronger effect on the HRV/HR dependence is made (Fig. 4). Such an approach may be applied to any heart rate dynamics index which is significantly correlated with HR—in such instances the RR interval tachograms should rather be modified before a given index is calculated.11
Figure 3.
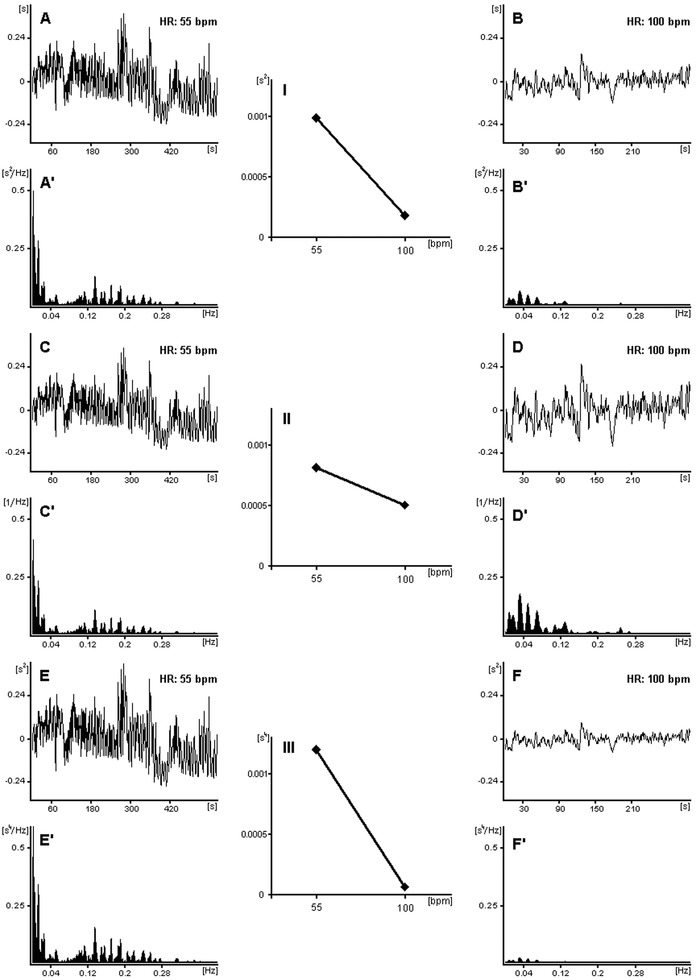
The mechanism of modifications of the HRV dependence on HR is presented: the RR interval tachograms with different HR (i.e., 55 and 100 bpm) and their respective power spectra are shown: (A, A′ and B, B′) standard tachograms and their spectra; (C, C′ and D, D′) tachograms and their spectra after division by their corresponding average RR (power spectra were divided by average RR squared); (E, E′ and F, F′) tachograms and their spectra after multiplication by their average RR (power spectra were multiplied by average RR squared). In panels I, II, and III, the dependencies of total powers of the respective HRV spectra on HR are exhibited, that is, (I) the standard HRV dependence on HR; (II) the weakened dependence; (III) the strengthened dependence. One can see that after the division by average RR, HR has little influence on HRV (II) and conversely, after the multiplication by average RR, HRV is more dependent on HR (III) than the standard HRV (I). The higher power of average RR is employed, the stronger effect on the HRV/HR dependence is achieved. By using the above modifications one may weaken or strengthen the HR influence on HRV. To facilitate the comparison of the fluctuation amplitudes, the mean values have been subtracted from the respective tachograms in panels A, B, C, D, E, and F. Reprinted from Sacha et al.11
Figure 4.
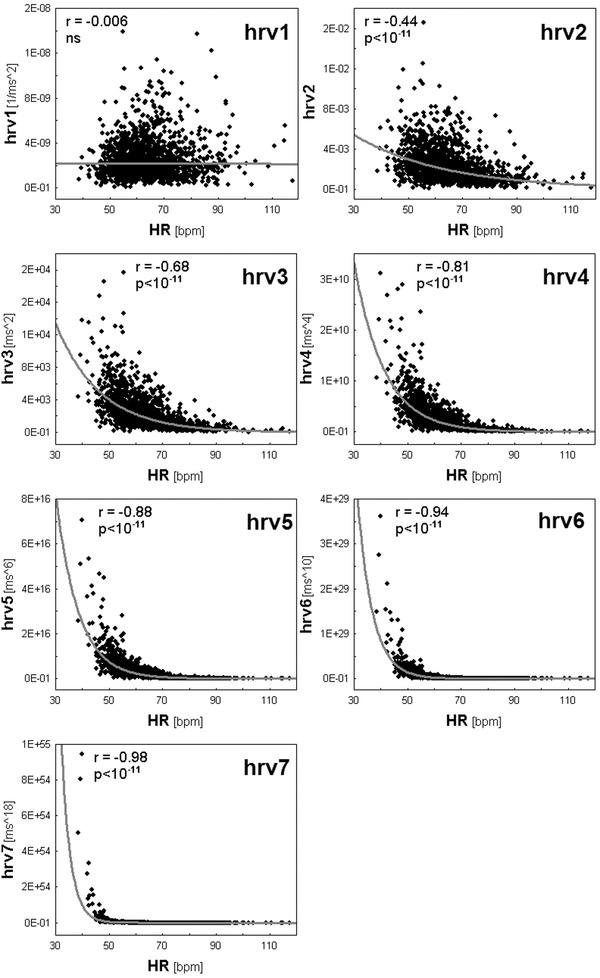
Spearman correlations between total powers (TPs) of HRV spectra and HR are shown. TPs of HRV spectra were modified as follows: hrv1—by division of standard TP by average RR to the power 4; hrv2—by division of standard TP by average RR squared; hrv3—standard TP; hrv4—by multiplication of standard TP by average RR squared; hrv5—by multiplication of standard TP by average RR to the power 4; hrv6—by multiplication of standard TP by average RR to the power 8; and hrv7—by multiplication of standard TP by average RR to the power 16. One can see the TP dependence on HR increases from hrv1 to hrv7; hrv1 is completely independent on HR, whereas in the following cases this dependence progressively increases up to the extremely high level in the case of hrv7. Reprinted with modification from Sacha et al.11
Importantly, if one calculates an average HRV index from different segments of ECG (e.g., from Holter recording), one should first calculate average standard HRV index (mean index of all segments) and then modify it by division or multiplication by the global average RR (mean RR of all segments). The division or multiplication for each segment separately (and then averaging) may create the situation where a single RR interval segment with unusually slow or fast HR determines the results for a given patient—it is especially likely if one employs high powers of average RR.11
HR CONTRIBUTION TO HRV CLINICAL VALUE
There is a robust body of evidence that HR is a strong risk factor for cardiovascular mortality,6, 7, 8 whereas HRV provides insights into general autonomic changes associated with different disease states.1, 2, 3, 4, 5 Recent analysis of the modified HRV, among a population of almost 1500 patients after myocardial infarction (MI), has revealed that if HRV is getting more dependent on HR, its predictive power increases for cardiac death, while it decreases for noncardiac one.12 Conversely, when losing its dependence on HR, the HRV is losing its prognostic power for cardiac death, but gaining its power for noncardiac one (Fig. 5A).12 Hence, the HR contribution to HRV prognostic power seems to be different for different outcomes, that is, positive for cardiac death but negative for noncardiac one, in other words, HR looks like to be a cardiovascular factor of the HRV predictive value. By using HRV highly dependent on HR (i.e., hrv7 in Fig. 5A), one may potentially find patients presenting higher cardiac risk than noncardiac one, but, with the HRV independent on HR (i.e., hrv1 in Fig. 5A), one may identify patients being predominantly at high noncardiac risk. In multivariate models, the modified HRVs proved to be independent risk factors of the respective modes of death, moreover, their specific ability to predict cardiac and noncardiac death was validated in another post‐MI population of almost 1000 patients.12
Figure 5.
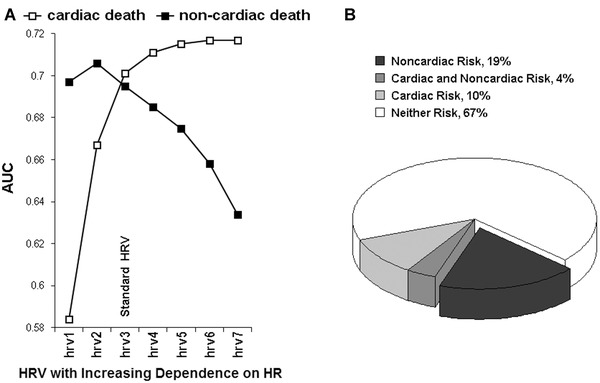
(A) the predictive powers (AUC, area under receiver–operator characteristic curves) of HRV (i.e., very low frequency component of HRV spectrum) modified with respect to HR are depicted. The case of hrv3 corresponds to standard HRV; in the cases of hrv1 and hrv2, the HRV dependence on HR was weakened but it was strengthened in cases of hrv4, hrv5, hrv6, and hrv7—HRV was modified according to the method described in Figure 4. As HRV is getting more dependent on HR (i.e., from hrv1 to hrv7), its predictive power increases for cardiac death, while it decreases for noncardiac death. Of note: hrv1 (which is completely HR independent) is a stronger predictor of noncardiac than cardiac death and conversely; hrv7 (which is highly HR dependent) is more powerful in predicting cardiac than noncardiac death; hrv3 (which is a standard HRV) is equally effective in both modes of death, that is, actually predicts all‐cause death. (B) The proportions of patients at risk of noncardiac and cardiac death stratified according to hrv1 and hrv7 (respectively) among the subgroup with left ventricular ejection fraction (LVEF) ≤35% are shown. Almost one fifth of those with LVEF ≤35% presents high noncardiac and low cardiac risk and therefore may not benefit from ICD therapy (the dark part of diagram)—see the text. Reprinted with modification from Sacha et al.12
The perfect example of how important is a death mode risk stratification is primary prevention with the implantable cardioverter‐defibrillator (ICD) therapy. For this therapy it is crucial to identify patients whose risk of sudden cardiac death considerably exceeds their risk of other modes of death—such a group would fully benefit from ICD therapy. Alternatively, tests identifying patients at high risk of noncardiac death might select those who would not benefit from ICD therapy due to their severe noncardiac burden.24 Hence, any chance of a death mode risk stratification is so important.25 In this view, the approach of strengthening or weakening the HRV dependence on HR, which may provide separate information on different types of death, deserves our particular attention. Figure 5B exhibits the proportions of patients with low left ventricular ejection fraction at risk of noncardiac and cardiac deaths stratified according to this approach—almost one fifth of those with reduced ejection fraction reveals high noncardiac and low cardiac risk and potentially may not benefit from ICD therapy in primary prevention.12
Gender Differences
There is some evidence to suggest that HR is a significant predictor of adverse outcomes but only in men not in women.26, 27, 28, 29 In the face of this gender difference, the investigation of the HRV and HR interaction gains even more in importance. Recent analysis with the modification of the HRV/HR dependence has revealed that if HRV is becoming more dependent on HR, its prognostic power increases for cardiac death and decreases for noncardiac one in males, while in females, it decreases for all the outcomes (even for cardiac death)—Figure 6.30 One of the reasons for this phenomenon may be the fact that HR did not predict any kind of outcomes in female subgroup, and consequently, the exclusion of HR impact on HRV improved the HRV predictive ability in women. This was opposite to what was found in men where HR predicted all the outcomes (especially cardiac death), and consequently by strengthening the HRV dependence on HR, one may learn more about cardiac prognosis in males (Fig. 6). Thus, the study demonstrates that HR may have a different impact on the HRV prognostic value in different genders—indeed, HR may have a detrimental effect on the HRV prognostic value in women, yet, one may solve this problem by the mathematical removal of the HR influence on HRV.30 Nevertheless, it is worth noting that in some populations HR can otherwise be a significant predictor of adverse outcomes in women6, 8, 27 and it remains to be established, whether in such populations, HR has different impact on HRV predictive abilities in males and females. It is possible that for outcomes and populations where HR is not a risk factor, the exclusion of HR influence may improve the HRV prognostic value, however, if HR is a risk factor the enhancement of its impact makes HRV a better predictor.
Figure 6.
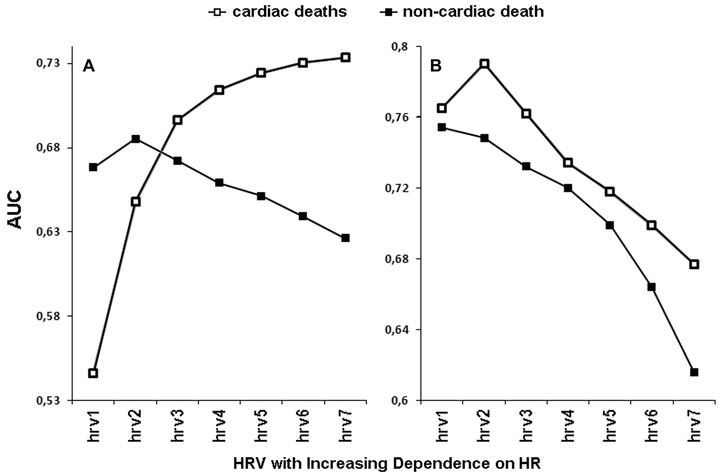
The prediction powers (AUC, area under receiver–operator characteristic curves) of HRV (i.e., very low frequency component of HRV spectrum) modified with respect to HR in men (panel A) and women (panel B) are depicted. The case of hrv3 corresponds to standard HRV; in the cases of hrv1 and hrv2, the HRV dependence on HR was weakened, but it was strengthened in cases of hrv4, hrv5, hrv6, and hrv7—HRV was modified according to the method described in Figure 4. As HRV is becoming more dependent on HR (i.e., from hrv1 to hrv7), its predictive power increases in men for cardiac death but decreases for noncardiac one, while in women, it decreases for both outcomes. Reprinted with modification from Sacha et al.30
Finally, it is worth noting, that women usually have higher HR and lower HRV than men, however, the correction of HRV for HR may diminish or even abolish the gender differences in HRV.31
HR IMPACT ON HRV REPRODUCIBILITY
Average heart rate is significantly more reproducible than standard HRV indices or even heart rate turbulence parameters.32 However, it has been demonstrated that HR may have an adverse effect on the HRV reproducibility. Repeated short‐term HRV measurements, performed over 20 days in the same healthy persons, have shown that the exclusion of HR impact on HRV significantly improves the HRV reproducibility. Moreover, if HRV is becoming more dependent on HR, its reproducibility is getting worse and worse (Fig. 7).33 There are reports pointing out that differences in average HR should be taken into account when one compares HRV measurements in a given patient.31, 34 Thus, if one intends to monitor HRV in a span of time, one should consider the HR changes.
Figure 7.
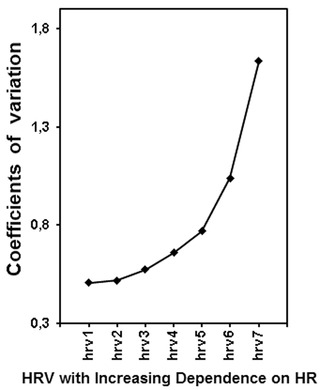
Reproducibility (i.e., coefficients of variation) of HRV (i.e., very low frequency component of HRV spectrum) modified with respect to HR is shown. The case of hrv3 corresponds to standard HRV; in the cases of hrv1 and hrv2, the HRV dependence on HR was weakened but it was strengthened in cases of hrv4, hrv5, hrv6, and hrv7—HRV was modified according to the method described in Figure 4. As HRV is getting more dependent on HR (i.e., from hrv1 to hrv7), its reproducibility decreases (i.e., coefficient of variation increases). Coefficients of variation significantly differ (P < 0.00001, Friedman ANOVA test)—additionally, all the adjacent coefficients also reveal significant difference from each other with P < 0.01. Reprinted with modification from Sacha et al.33
CONCLUSIONS
HR significantly influences HRV due to both physiological and mathematical reasons, however, either of these two can be modified—moreover, by the correction for HR one may differentiate between physiologically and mathematically mediated changes in HRV. Modifications of the HRV dependence on HR also enable us to learn about the HR contribution to the clinical value of HRV. Recent studies show that the exclusion of the HR impact on HRV makes HRV more predictive for noncardiac death, on the other hand, the enhancement of this impact causes HRV to be a better predictor of cardiovascular mortality. These phenomena are especially pronounced in males, however in female groups where HR is not a significant risk factor, the exclusion of its influence improves prognostic abilities of HRV. In general, it is possible that for outcomes and populations where HR is not a risk factor, the removal of HR impact improves the HRV predictive value, conversely, if HR is a risk factor the enhancement of its influence makes HRV a better predictor. HR also influences the HRV reproducibility, hence changes in HR should be taken into account when one compares HRV measurements in a given patient. Currently, it is hard to indicate how to practically employ the analyses of HRV/HR interaction to the clinical practice, therefore it requires, but also deserves, further investigations. Finally, it is worth noting that all issues discussed in this review should also refer to any other heart rate dynamics analysis which indices are significantly associated with HR.
REFERENCES
- 1. Huikuri HV, Jokinen V, Syvänne M, et al. Heart rate variability and progression of coronary atherosclerosis. Arterioscler Thromb Vasc Biol 1999;19:1979–1985. [DOI] [PubMed] [Google Scholar]
- 2. Rashba EJ, Estes NA, Wang P, et al. Preserved heart rate variability identifies low‐risk patients with nonischemic dilated cardiomyopathy: results from the DEFINITE trial. Heart Rhythm 2006;3:281–286. [DOI] [PubMed] [Google Scholar]
- 3. Chandra P, Sands RL, Gillespie BW, et al. Predictors of heart rate variability and its prognostic significance in chronic kidney disease. Nephrol Dial Transplant 2012;27:700–709. [DOI] [PMC free article] [PubMed] [Google Scholar]
- 4. May O, Arildsen H. Long‐term predictive power of heart rate variability on all‐cause mortality in the diabetic population. Acta Diabetol 2011;48:55–59. [DOI] [PubMed] [Google Scholar]
- 5. Bravi A, Longtin A, Seely AJ. Review and classification of variability analysis techniques with clinical applications. Biomed Eng Online 2011;10:90. [DOI] [PMC free article] [PubMed] [Google Scholar]
- 6. Kannel WB, Kannel C, Paffenbarger RS Jr, et al. Heart rate and cardiovascular mortality: the Framingham Study. Am Heart J 1987;113:1489–1494. [DOI] [PubMed] [Google Scholar]
- 7. Böhm M, Swedberg K, Komajda M, et al.; SHIFT Investigators. Heart rate as a risk factor in chronic heart failure (SHIFT): the association between heart rate and outcomes in a randomised placebo‐controlled trial. Lancet 2010;376:886–894. [DOI] [PubMed] [Google Scholar]
- 8. Antoni ML, Boden H, Delgado V, et al. Relationship between discharge heart rate and mortality in patients after acute myocardial infarction treated with primary percutaneous coronary intervention. Eur Heart J 2012;33:96–102. [DOI] [PubMed] [Google Scholar]
- 9. Tsuji H, Venditti FJ Jr, Manders ES, et al. Determinants of heart rate variability. J Am Coll Cardiol 1996;28:1539–1546. [DOI] [PubMed] [Google Scholar]
- 10. Heart rate variability: standards of measurement, physiological interpretation and clinical use . Task Force of the European Society of Cardiology and the North American Society of Pacing and Electrophysiology. Circulation 1996;93:1043–1065. [PubMed] [Google Scholar]
- 11. Sacha J, Barabach S, Statkiewicz‐Barabach G, et al. How to strengthen or weaken the HRV dependence on heart rate—description of the method and its perspectives. Int J Cardiol 2013;168:1660–1663. [DOI] [PubMed] [Google Scholar]
- 12. Sacha J, Barabach S, Statkiewicz‐Barabach G, et al. How to select patients who will not benefit from ICD therapy by using heart rate and its variability? Int J Cardiol 2013;168:1655–1658. [DOI] [PubMed] [Google Scholar]
- 13. Riccioni G. The benefits of ivabradine are independent of resting heart rate. Future Cardiol 2013;9:313–315. [DOI] [PubMed] [Google Scholar]
- 14. Task Force Members . ESC Guidelines for the diagnosis and treatment of acute and chronic heart failure 2012: The Task Force for the Diagnosis and Treatment of Acute and Chronic Heart Failure 2012 of the European Society of Cardiology. Developed in collaboration with the Heart Failure Association (HFA) of the ESC. Eur Heart J 2012;33:1787–1847. [DOI] [PubMed] [Google Scholar]
- 15. Task Force Members . 2013 ESC guidelines on the management of stable coronary artery disease: The Task Force on the management of stable coronary artery disease of the European Society of Cardiology. Eur Heart J 2013;34:2949–3003. [DOI] [PubMed] [Google Scholar]
- 16. Zaza A, Lombardi F. Autonomic indexes based on the analysis of heart rate variability: a view from the sinus node. Cardiovasc Res 2001;50:434–442. [DOI] [PubMed] [Google Scholar]
- 17. Rocchetti M, Malfatto G, Lombardi F, et al. Role of the input/output relation of sinoatrial myocytes in cholinergic modulation of heart rate variability. J Cardiovasc Electrophysiol 2000;11:522–530. [DOI] [PubMed] [Google Scholar]
- 18. Melenovsky V, Simek J, Sperl M, et al. Relation between actual heart rate and autonomic effects of beta blockade in healthy men. Am J Cardiol 2005;95:999–1002. [DOI] [PubMed] [Google Scholar]
- 19. Sacha J. Why should one normalize heart rate variability with respect to average heart rate. Front Physiol 2013;4:306. [DOI] [PMC free article] [PubMed] [Google Scholar]
- 20. Sacha J, Pluta W. Alterations of an average heart rate change heart rate variability due to mathematical reasons. Int J Cardiol 2008;128:444–447. [DOI] [PubMed] [Google Scholar]
- 21. Sacha J, Pluta W. Which heart rate is more variable: a slow or a fast one? – It depends on the method of heart rate variability analysis. Folia Cardiol 2005; 12(suppl D):1–4. [Google Scholar]
- 22. Sacha J, Pluta W. Different methods of heart rate variability analysis reveal different correlations of heart rate variability spectrum with average heart rate. J Electrocardiol 2005;38:47–53. [DOI] [PubMed] [Google Scholar]
- 23. Billman GE. The effect of heart rate on the heart rate variability response to autonomic interventions. Front Physiol 2013;4:222. [DOI] [PMC free article] [PubMed] [Google Scholar]
- 24. Barsheshet A, Moss AJ, Huang DT, et al. Applicability of a risk score for prediction of the long‐term (8‐year) benefit of the implantable cardioverter‐defibrillator. J Am Coll Cardiol 2012;59:2075–2079. [DOI] [PubMed] [Google Scholar]
- 25. Dorian P, Hohnloser SH, Thorpe KE, et al. Mechanisms underlying the lack of effect of implantable cardioverter‐defibrillator therapy on mortality in high‐risk patients with recent myocardial infarction: insights from the Defibrillation in Acute Myocardial Infarction Trial (DINAMIT). Circulation 2010;122:2645–2652. [DOI] [PubMed] [Google Scholar]
- 26. Nanchen D, Leening MJ, Locatelli I, et al. Resting heart rate and the risk of heart failure in healthy adults: the Rotterdam Study. Circ Heart Fail. 2013;6:403–410. [DOI] [PubMed] [Google Scholar]
- 27. Palatini P. Heart rate as a cardiovascular risk factor: do women differ from men? Ann Med 2001;33:213–221. [DOI] [PubMed] [Google Scholar]
- 28. Kannel WB, Kannel C, Paffenbarger RS Jr, et al. Heart rate and cardiovascular mortality: the Framingham Study. Am Heart J 1987;113:1489–1494. [DOI] [PubMed] [Google Scholar]
- 29. Palatini P, Benetos A, Grassi G, et al. European society of hypertension. Identification and management of the hypertensive patient with elevated heart rate: statement of a European Society of Hypertension Consensus Meeting. J Hypertens 2006; 24: 603–610. [DOI] [PubMed] [Google Scholar]
- 30. Sacha J, Barabach S, Statkiewicz‐Barabach G, et al. Gender differences in the interaction between heart rate and its variability—how to use it to improve the prognostic power of heart rate variability. Int J Cardiol 2014;171:e42–e45. [DOI] [PubMed] [Google Scholar]
- 31.Van Hoogenhuyze D, Weinstein N, Martin GJ, et al. Reproducibility and relation to mean heart rate of heart rate variability in normal subjects and in patients with congestive heart failure secondary to coronary artery disease. Am J Cardiol 1991;68:1668–1676. [DOI] [PubMed] [Google Scholar]
- 32. Sacha J, Sobon J, Sacha K, et al. Short‐term deceleration capacity reveals higher reproducibility than spectral heart rate variability indices during self‐monitoring at home. Int J Cardiol 2011;152:271–272. [DOI] [PubMed] [Google Scholar]
- 33. Sacha J, Sobon J, Sacha K, et al. Heart rate impact on the reproducibility of heart rate variability analysis. Int J Cardiol 2013;168:4257–4259. [DOI] [PubMed] [Google Scholar]
- 34. Baranowski R, Kumor M, Popławska W, et al. Reproducibility of heart rate variability results in two consecutive days. Folia Cardiol 2001;8:119–127. [Google Scholar]


