

Abstract
Lead aVR is the only lead in the surface ECG that does not face the “typically” relevant walls of the left ventricle. Historically, its value has been neglected most likely due to its unusual configuration and direction, which appeared to have little correlation with other more congruous and easily diagnostic frontal leads. The isolation of the unipolar leads in the Standard surface ECG presentation may also have played an important role. Even with this “unfair” neglect, we know nowadays that it is very sensitive to locate obstructed epicardial coronary arteries.
Besides helping distinguishing the culprit lesion of an infarct, lead aVR also helps recognizing other conditions that could be of clinical significance such as pericarditis, Brugada syndrome, fascicular blocks of the right branch, ectopic left atrial rhythms, etc. The purpose of this review is to revise the clinical value of lead aVR in the recognition of frequent and not so frequent clinical conditions.
Ann Noninvasive Electrocardiol 2011;16(3):295–302
Keywords: aVR, unipolar limb lead, aVR sign
The conventional ECG has 12 leads. Each lead records electrical activity of the heart from different perspective. Therefore, it correlates to different anatomical areas of the heart.
aVR, aVL, and aVF are augmented unipolar leads in the frontal plane, after their inventor Dr. Emanuel Goldberger (known collectively as the Goldberger's leads). They are derived from the same three electrodes as leads I, II, and III with the reference lead on the limb being sensed and disconnected from the other two. Unipolar leads also have two poles, as a voltage is measured; however, the negative pole is a composite pole (Wilson's central terminal) made up of signals from lots of other electrodes. In a 12‐lead ECG, all leads besides the limb leads are unipolar (aVR, aVL, aVF, V1, V2, V3, V4, V5, and V6). The augmented limb leads aVR, aVL, and aVF are amplified in this way because the signal is too small to be useful when the negative electrode is Wilson's central terminal. Lead aVL is at −30° relative to the lead I axis; aVR is at −150° and aVF is at +90°.
Lead aVR is an augmented unipolar limb lead in which the positive electrode is on the right arm. aVR offers no specific view of the left ventricle and this is why it is mostly an ignored lead. Nonetheless, the P‐QRS‐ST‐T in lead aVR is often characteristic in various conditions. Recognizing those ECG pattern changes can improve the accuracy of clinical diagnosis. 1 , 2 , 3
ARM LEADS SWITCH AND DEXTROCARDIA
In sinus rhythm, the sequence of depolarization is directed inferiorly and toward the left. Thus the P‐wave polarity is always negative in lead aVR, positive in II, I, and aVF, and variable in III and aVL.
Right and left arm leads reversal is the most common mistake seen in ECG acquisition. If the P‐QRS‐T were upside down in lead I, a positive P wave in lead aVR (the true lead aVR is seen in aVL) strongly suggests that right and left arm leads are switched. 4 , 5 , 6 , 7 A normal R‐wave progression in the horizontal plane rules out dextrocardia. 8 Otherwise, dextrocardia is the most likely diagnosis if the arm leads were correctly placed. ECG manifestations of dextrocardia are characterized by a reverse progression of R‐wave voltage in the precordial leads from V2 to V5 with predominant negative QRS complexes in all precordial leads. 2 , 7 , 8 (Fig. 1)
Figure 1.
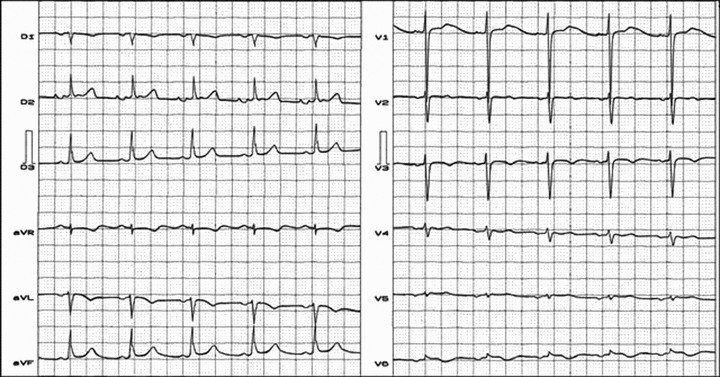
True dextrocardia: mirror image. Total atriovisceral situs inversus. ECG diagnosis: SAP to the right and below, pointing at around +1200. Negative P wave in leads I and aVL, positive in lead III. Reverse progression of R wave in precordial leads V2 to V5.
ACUTE CORONARY SYNDROME (ACS)
ST‐segment elevation in lead aVR and ST‐segment depression in the anterior and lateral leads suggests acute critical occlusion of the left main coronary artery (LMCA) because the ST injury vector is directed to right and upward, pointing to lead aVR. 9 , 10 ST‐segment depression in leads I, II, and V4 through V6, in association with ST‐segment elevation in lead aVR identifies patients with three‐vessel or LMCA critical occlusion (Fig. 2, Panel A) 11 , 12
Figure 2.
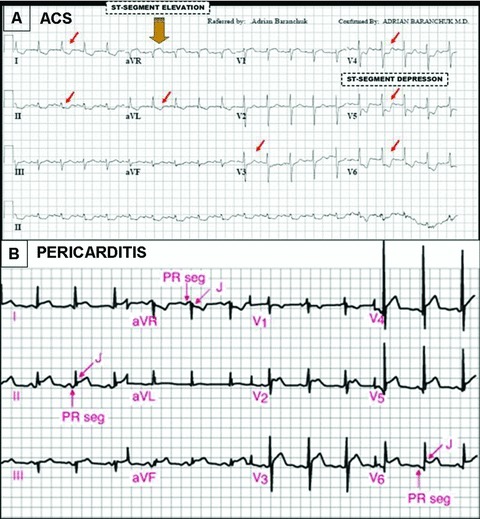
Panel A: A 12‐lead ECG of a patient with ACS by total occlusion of the left main coronary artery. Note ST‐segment elevation in lead aVR and widespread ST‐segment depression involving the anterolateral precordial leads from V4 to V6 and the inferior limb leads (mirror image). Panel B: A12‐lead ECG of a patient with acute pericarditis. Note ST‐segment depression in leads aVR and V1 and ST‐segment concave elevation in most of the other leads.
Proper assessment of lead aVR in patients with ACS may help identifying proximal left anterior descending artery (LAD) occlusion or LMCA. Additional analysis of lead V1 does not improve diagnostic accuracy. 13
ST‐segment elevation in lead aVR in the presence of an anterior ST‐segment elevation myocardial infarction (STEMI) suggests LAD occlusion proximal to the first septal perforator branch (S1).
ST‐segment elevation in lead aVR with simultaneous ST‐segment depression in V5 (VR‐E + V5‐D) is a marker of ischemia due to severe LAD stenosis in patients with single‐vessel disease. 12
ST‐segment elevation in lead aVR and depression in V5 but without ST‐segment elevation in V1 strongly correlates with significant LAD and right coronary artery (RCA) stenosis, a sign of double‐vessel disease. 10 , 11 , 12 , 13 , 14
Elevation of the ST‐segment in aVR in the setting of ACS identifies patients with severe coronary artery disease. aVR ST‐segment elevation with less ST‐segment elevation in lead V1 is an important predictor of acute LMCA obstruction. 10 , 11 , 12 , 13 , 14
ST‐segment depression in lead aVR is common in patients with acute inferior myocardial infarction related to the left circumflex artery (LCx). 14 , 15 ST‐segment depression ≥0.1 mV in lead aVR, during an acute inferior myocardial infarction, presented a sensitivity and specificity of 70% and 94.3% for differentiating the culprit vessel lesion (LCx vs RCA). 15
ST‐segment depression in lead aVR during an inferior STEMI predicts LCx infarction or larger RCA infarction involving a large posterolateral branch. 16
In the posterior (from the “old” infarct classification) and combined anterior + posterior myocardial infarction, the amplitude of the initial R wave in lead aVR is increased (>1.0 mm). 17
AORTIC DISSECTION
Lead aVR may contribute to the diagnosis of this ominous entity. In acute aortic dissection Stanford type A (or DeBakey I or II) when the proximal ascending aorta is involved, ST‐segment elevation in lead aVR was reported. 2 , 3 , 18 The physiopathologic mechanism to explain this observation was the obstruction of the LMCA coronary ostium by the flap of the dissected aorta.
Atrial Ectopic Rhythm
A positive P wave in lead aVR indicates an ectopic right atrial rhythm. As such, P wave in lead aVL is also positive.
In focal right atrial tachycardia the P‐wave configuration in lead aVR can easily differentiate the site of origin. Right atrial tachycardia arising from the crista terminalis can be differentiated from the tricuspid annulus and the septum away from the tricuspid annulus by analyzing the P‐wave configuration in lead aVR. A negative P wave in lead aVR identified crista terminalis atrial tachycardia with a sensitivity of 100% and a specificity of 93%. 19 Right atrial tachycardia arising from the appendage can also demonstrate negative P wave in lead aVR. 20
Acute Pericarditis
During the initial phase of pericarditis (<6 weeks); ST‐segment elevation (<5 mm) with superior concavity is frequently seen on 12‐lead ECG.
ST‐segment changes can be subtle and usually present in several leads simultaneously, excluding V1. PR‐segment elevation in lead aVR is a hallmark of acute pericarditis. 2 , 3 , 21
Occasionally, ST‐segment depression can be observed in leads aVR, V1, as well as in the right accessory precordial leads (V3R, V4R, and V5R) as part of a reciprocal phenomena. 22 (Fig. 2, Panel B)
ACUTE TCA INTOXICATION
Clinical and electrocardiographic manifestations of TCA overdose are well known and previously described 2 , 3 , 23 , 24 : ECG changes in lead aVR may help in recognizing this clinical condition. Increased R‐wave voltage and R/s ratio in lead aVR, also reported as prominent R wave in lead aVR, are maybe the most frequently observed ECG changes in patients with TCA intoxication. 24 (Fig. 3)
Figure 3.
ECG changes associated with acute TCA intoxication.
DIFFERENTIAL DIAGNOSIS BETWEEN TYPICAL ATRIOVENTRICULAR NODE REENTRANT TACHYCARDIA (AVNRT) AND AV RECIPROCATING TACHYCARDIA (AVRT)
A simple algorithm in patients with regular narrow complex tachycardia using a single‐lead aVR allows distinguishing AVNRT from AVRT. Zhong et al. 25 have recorded 12‐lead ECGs in 154 adult patients referred for electrophysiology study and radiofrequency ablation, during sinus rhythm and narrow QRS complex tachycardia. One of the three criteria that were found to be useful discriminators of the tachycardia mechanism involved the aVR lead: ST‐segment elevation in lead aVR predicted AVRT in 83% of the cases (sensitivity 71%; specificity 83%). 25
DIAGNOSIS OF “RIGHT VENTRICULAR END CONDUCTION DELAY” (RECD)
Prominent final R wave in lead aVR is characteristic of RECD, and useful criteria to differentiate it from left anterior fascicular block (LAFB). 26 There is no anatomical confirmation that the right bundle is divided in three branches as the left bundle is, however; the isolated block of one of the three contingent or right branch divisions inside the right ventricle free wall, is generically called RECD. 27
Electro‐vector‐cardiographic (ECG/VCG) diagnosis of RECD remains somehow speculative. 27 The only constant element is the presence of the final right end conduction delay, located in the superior, middle, or inferior portions of the QRS loop in the frontal plane, which could be the consequence, or not, of a dromotropic disorder (Fig.4, Panels A and B).
Figure 4.
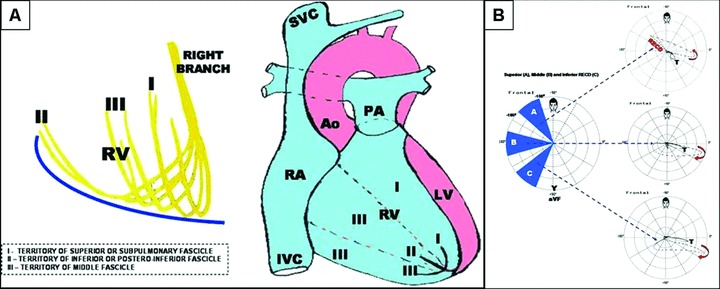
Panel A: Possible anatomical distribution of the three hypothetical fascicles (contingents) of the right branch of the His bundle inside the right ventricle free wall. Panel B: Vectorcardiogram of a right end conduction delay located in the superior, middle, and inferior portions of the frontal plane, respectively.
In most cases, RECD corresponds to a normal variant and its clinical interest lies in the fact that it causes ECG/VCG patterns that are easily confused with LAFB and left posterior fascicular block. Additionally, it may mimic morphologies that resemble electrically inactive areas both in the anterior and the inferior walls, the ECG/VCG of the Brugada Syndrome (BrS), and some concealed forms of Arrhytmogenic Right Ventricular Cardiomyopathy/Dysplasia. 28
BRUGADA SYNDROME
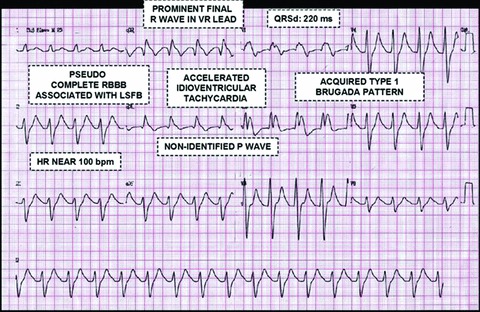
Prominent final R wave in lead aVR (≥3 mm), also known as the aVR sign, it was described as a possible risk marker of arrhythmic event when associated with a spontaneous Type 1 ECG Brugada pattern. 2 , 3 , 28 , 29 (Fig. 5)
Figure 5.
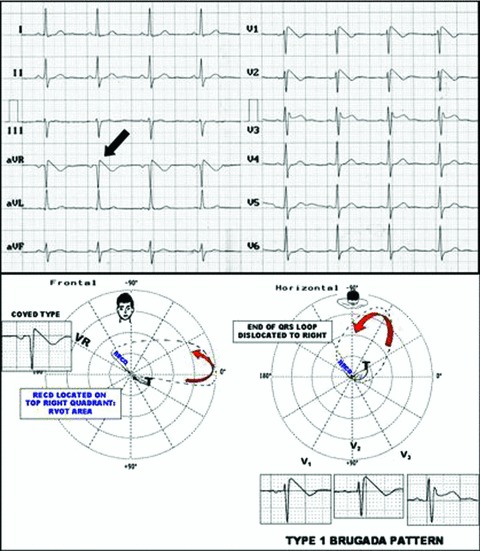
Type 1 ECG Brugada pattern (“coved type”) with superior right end conduction delay (RECD) and positive “aVR sign”: final R wave of aVR ≥3 mm. RECD in frontal plane in a patient with BrS. ECG/VCG correlation (lower panel).
In the vectorcardiogram, RECD can be located in the right superior quadrant of the frontal plane, corresponding to the territory of the superior or subpulmonary fascicle of the right branch (right ventricular outflow tract [RVOT] between −100° and 160°). The location of this delay explains the recording of prominent R wave in lead aVR. Larger studies are needed to confirm the value of this sign as a risk marker in BrS.
Right Ventricular Overloading
Lead aVR faces the basal, infundibular, RVOT, or crista supraventricularis regions. An R wave in lead aVR >5 mm (RVOT) and a Q/R ratio in lead aVR ≤1; have been found as right ventricular overloading criteria. 30 , 31
DIFFERENTIAL DIAGNOSIS OF WIDE QRS COMPLEX TACHYCARDIAS
Vereckei et al 32 blindly analyzed 483 wide QRS complex tachycardias of which 351 were ventricular tachycardia (VT), 112 supraventricular tachycardias (SVT), and 20 preexcited tachycardias. The authors used a novel single‐lead aVR algorithm following four successive steps:
-
1
First step: Presence of an initial R wave in lead aVR? If yes; VT.
-
2
Second step: Presence of any initial R or Q wave >40 ms? If yes; VT.
-
3
Third step: Presence of a notch or the descending limb of a negative onset and predominantly negative QRS? If yes; VT (notching on the initial downstroke of a predominantly negative QRS complex).
-
4
Fourth step: Ventricular activation‐velocity ratio (v[i]/v[t]) ≤1 the vertical excursion (in millivolts) recorded during the initial (v[i]) and terminal (v[t]) 40 ms of the QRS complex. If yes; VT.
If any of criteria 1 to 3 were present, VT diagnosis could be established. The aVR algorithm presented greater sensitivity and negative predictive value for diagnosing VT when compared to the classic Brugada criteria.
The Value of Reversed Lead aVR (−aVR)
Case and Moss 33 have recently proposed some modifications to the current frontal plane ECG leads. One of them is a 180° degree alteration in the configuration of lead aVR (to −aVR) to make it more “accessible” to common understanding. The new reversed lead aVR (−aVR) will now be presented at +30° between the traditional Lead I (at 0°) and Lead II (at + 60°). This simple alteration of the recording will simplify the recognition of patterns that can affect this lead, as recognized by this manuscript and others. 2 , 3 , 33 The analysis of the ST segment and the T wave in −aVR will be simpler and easier to understand and the relationship of these changes to the two contiguous leads (I and II) will provide more detailed evidence of the extent of illness involving these electrical areas. 33
CONCLUSIONS
For the time being the unipolar lead aVR has been neglected. As outlined in this brief review, lead aVR is valuable in the differential diagnosis of various cardiovascular conditions. Recognizing the ECG pattern changes in aVR is crucial in the interpretation toward correct diagnosis and appropriate clinical decision making.
The authors do not report any conflict of interest regarding this work.
Glossary of Abbreviations
| ACS: Acute Coronary Syndrome |
| AVNRT: AV Node Reentrant Tachycardia |
| AVRT: AV Reentrant Tachycardia |
| BrS: Brugada Syndrome |
| ECG: Electrocardiogram |
| LAD: Left Anterior Descending Artery |
| LAFB: Left Anterior Fascicular Block |
| LCx: Left Circumflex Artery |
| LMCA: Left Main Coronary Artery |
| LPFB: Left Posterior Fascicular Block |
| RBBB: Right Bundle Branch Block |
| RECD: Right Ventricular End Conduction Delay |
| RVOT: Right Ventricular Outflow Tract |
| STEMI: ST‐Segment Elevation Myocardial Infarction |
| VCG: Vectorcardiogram |
REFERENCES
- 1. Gorgels AP, Engelen DJ, Wellens HJ. Lead aVR, a mostly ignored but very valuable lead in clinical electrocardiography. J Am Coll Cardiol 2001;38: 1355–1356. [DOI] [PubMed] [Google Scholar]
- 2. Kireyev D, Arkhipov MV, Zador ST, et al Clinical utility of aVR – the neglected electrocardiographic lead. Ann Noninvasive Electrocardiol 2010;15:175–180. [DOI] [PMC free article] [PubMed] [Google Scholar]
- 3. George A, Arumugham PS, Figuredo VM. aVR – the forgotten lead. Exp Clin Cardiol 2010;15(2):e36–e44. [PMC free article] [PubMed] [Google Scholar]
- 4. Lin YY, Hsu CW, Chu SJ, et al Additional causes of electrocardiographic changes in lead aVR. Am J Emerg Med 2008;26:242–243. [DOI] [PubMed] [Google Scholar]
- 5. Baranchuk A, Shaw C, Alanazi H, et al ECG pitfalls and artifacts: The 10 commandments. Crit Care Nurse 2008;29:67–73. [DOI] [PubMed] [Google Scholar]
- 6. Baranchuk A. Right arm‐left arm reversal In Baranchuk A. (ed.): Atlas of Advanced ECG Interpretation. London , UK , Remedica , 2011. (in press). [Google Scholar]
- 7. Rudiger A, Hellermann JP, Mukherjee R, et al Electrocardiographic artifacts due to electrode misplacement and their frequency in different clinical settings. Am J Emerg Med 2007;25:174–178. [DOI] [PubMed] [Google Scholar]
- 8. Uchida A. True dextrocardia In Baranchuk A. (ed.): Atlas of Advanced ECG Interpretation. London , UK , Remedica , 2011. (in press). [Google Scholar]
- 9. Nikus KC. Acute total occlusion of the left main coronary artery with emphasis on electrocardiographic manifestations. Timely Top Med Cardiovasc Dis 2007;11:E22. [PubMed] [Google Scholar]
- 10. Gaitonde RS, Sharma N, Ali‐Hasan S, et al Prediction of significant left main coronary artery stenosis by the 12‐lead electrocardiogram in patients with rest angina pectoris and the withholding of clopidogrel therapy. Am J Cardiol 2003;92:846–848. [DOI] [PubMed] [Google Scholar]
- 11. Dassen W, Gorgels A, Mulleneers R, et al Development of ECG criteria to diagnose the number of narrowed coronary arteries in rest angina using new self‐learning techniques. J Electrocardiol 1994;27(Suppl):155–160. [DOI] [PubMed] [Google Scholar]
- 12. Rostoff P, Piwowarska W, Konduracka E, et al Value of lead aVR in the detection of significant left main coronary artery stenosis in acute coronary syndrome. Kardiol Pol 2005;62:128–135. [PubMed] [Google Scholar]
- 13. Yamaji H, Iwasaki K, Kusachi S, et al Prediction of acute left main coronary artery obstruction by 12‐lead electrocardiography. ST segment elevation in lead aVR with less ST segment elevation in lead V(1). J Am Coll Cardiol 2001;38:1348–1354. [DOI] [PubMed] [Google Scholar]
- 14. Michaelides AP, Psomadaki ZD, Aigyptiadou MN, et al Significance of exercise‐induced ST changes in leads aVR, V5, and V1. Discrimination of patients with single‐ or multivessel coronary artery disease. Clin Cardiol 2003;26:226–230. [DOI] [PMC free article] [PubMed] [Google Scholar]
- 15. Sun TW, Wang LX, Zhang YZ. The value of ECG leads aVR in the differential diagnosis of acute inferior wall myocardial infarction. Intern Med 2007; 46:795–799. [DOI] [PubMed] [Google Scholar]
- 16. Kanei Y, Sharma J, Diwan R, et al ST‐segment depression in aVR as a predictor of culprit artery and infarct size in acute inferior wall ST‐segment elevation myocardial infarction. J Electrocardiol 2010;43:132–135. [DOI] [PubMed] [Google Scholar]
- 17. Okamoto N, Simonson E, Ahuja S, et al Significance of the initial R wave in lead aVR of the electrocardiogram in the diagnosis of myocardial infarction. Circulation 1967;35:126–131. [DOI] [PubMed] [Google Scholar]
- 18. Ali RG, Chrissoheris MP. Lead aVR ST‐segment elevation in acute proximal aortic dissection. Conn Med 2008;72:19–20. [PubMed] [Google Scholar]
- 19. Tada H, Nogami A, Naito S, et al Simple electrocardiographic criteria for identifying the site of origin of focal right atrial tachycardia. Pacing Clin Electrophysiol 1998;21:2431–2439. [DOI] [PubMed] [Google Scholar]
- 20. Zhang T, Li XB, Wang YL, et al Focal atrial tachycardia arising from the right atrial appendage: Electrophysiologic and electrocardiographic characteristics and catheter ablation. Int J Clin Pract 2009;(Mar)63:417–424. [DOI] [PubMed] [Google Scholar]
- 21. Williamson K, Mattu A, Plautz CU, et al Electrocardiographic applications of lead aVR. Am J Emerg Med 2006;24:864–874. [DOI] [PubMed] [Google Scholar]
- 22. Pérez Riera AR, Uchida AH, Schapachnik E, et al Early repolarization variant: Epidemiological aspects, mechanism, and differential diagnosis. Cardiol J 2008;15:4–16. [PubMed] [Google Scholar]
- 23. Finnie K. Tricyclic overdose In Baranchuk A. (ed.): Atlas of Advanced ECG Interpretation. London , UK , Remedica , 2011. (in press). [Google Scholar]
- 24. Choi KH, Lee KU. Serial monitoring of lead aVR in patients with prolonged unconsciousness following tricyclic antidepressant overdose. Psychiatry Investig 2008;5:247–250. [DOI] [PMC free article] [PubMed] [Google Scholar]
- 25. Zhong YM, Guo JH, Hou AJ, et al A modified electrocardiographic algorithm for differentiating typical atrioventricular node re‐entrant tachycardia from atrioventricular reciprocating tachycardia mediated by concealed accessory pathway. Int J Clin Pract 2006;60:1371–1377. [DOI] [PubMed] [Google Scholar]
- 26. De Padua F, Pereirinha A, Lopes MG. Conduction defects In MacFarlane PW, Veitch Lawrie TD. (eds.): Comprehensive Electrocardiology: Theory and Practice in Health and Disease. Oxford, Pergamon, 1989, chapter 14, V:1, pp. 472–510. [Google Scholar]
- 27. Pastore CA, Moffa PJ, Spiritus MO, et al Fascicular blocks of the right branch. Standardization of vectorelectrocardiographic findings. Arq Bras Cardiol 1983;41:161–166. [PubMed] [Google Scholar]
- 28. Pérez Riera AR, Ferreira C, Schapachnik E. Value of 12 lead electrocardiogram and derived methodologies in the diagnosis of Brugada disease In Antzelevitch C. (ed.): The Brugada Syndrome: From Bench to Bedside. Malden, MA, Blackwell Futura Publishing, 2005, chapter 7, pp. 87–110. [Google Scholar]
- 29. Babai Bigi MA, Aslani A, Shahrzad S. aVR sign as a risk factor for life‐threatening arrhythmic events in patients with Brugada syndrome. Heart Rhythm 2007;4:1009–1012. [DOI] [PubMed] [Google Scholar]
- 30. Bayés de Luna A. Clinical Electrocardiography: A Textbook, 2nd Updated Edition Armonk , NY . Futura Publishing Company, 1998. Ventricular Enlargement, pp. 67–82. [Google Scholar]
- 31. Surawicz B, Knilans TK. Chou's Electrocardiography in Clinical Practice Adult and Pediatric, 6th Edition. Philadelphia, Saunders Elsevier, 2009, chapter 3, Ventricular Enlargement, pp. 59–74.
- 32. Vereckei A, Duray G, Szénási G, et al New algorithm using only lead aVR for differential diagnosis of wide QRS complex tachycardia. Heart Rhythm 2008;5:89–98. [DOI] [PubMed] [Google Scholar]
- 33. Case RB, Moss AJ. Recommendation for revision of the standard presentation of the frontal plane ECG leads including reversal of lead aVR (to –aVR): It is time for a change. Ann Noninv Electrocardiol 2010;15(2): 97–100. [DOI] [PMC free article] [PubMed] [Google Scholar]