Abstract
Background: Seismocardiography (SCG) is a useful method for the detection of exercise‐induced changes in cardiac muscle contractility which may occur during myocardial ischemia. The aim of this study was to compare the diagnostic accuracy of SCG with electrocardiographic exercise test (ETT) for diagnosis of ischemia in patients with angiographically proved coronary artery disease (CAD).
Methods: Seventy‐seven male patients with CAD without myocardial infarction (MI), mean age 51 ± 9 years, were subjected to SCG and ETT. A gender‐matched control group consisted of 30 healthy volunteers aged 34 ± 7 years. SCG was done simultaneously with resting supine 12‐lead electrocardiography before and immediately after a symptom‐limited ETT. The sensitivity, specificity, positive predictive value (PPV), negative predictive value (NPV) of SCG were compared with ETT. Moreover, the diagnostic accuracy of both the methods was compared, with coronary angiography being the reference for the analysis.
Results: SCG was more sensitive (61.1% vs 44.2%, P < 0.05) and accurate (70% vs 61%, P < 0.05) method for detecting ischemia caused by coronary stenosis ≥50%, at least in one coronary artery compared to the ETT. However, ETT had better specificity than SCG (82.4% vs 76%, P < 0.05). The PPV and NPV of SCG were significantly better than those obtained with ETT (77.9% vs 76%, P < 0.05 and 63.4% vs 53.8%, P < 0.05, respectively). Moreover, the concordant results of SCG and ETT improved the diagnostic accuracy of both methods.
Conclusions: SCG appeared to be more sensitive for detecting ischemia caused by more than ≥50% stenosis of the main coronary artery compared to an electrocardiographic stress test. SCG was a useful ETT adjunct for selecting patients requiring coronary angiography.
Keywords: coronary artery disease, seismocardiography, electrocardiographic exercise stress test
The idea for the modern implementation of seismocardiography (SCG) was developed in 1987 by a seismologist, John Zanetti. He realized that the sophisticated technology developed in the 1980s during earthquakes study—seismology—could be applied to cardiology. His collaboration with cardiologist David Salerno resulted in the employment of this technology into a clinical practice. They found that by comparing waveforms recorded before and after exercise, SCG can accurately and reliably diagnose coronary artery disease (CAD). 1 , 2 , 3 , 4 , 5 , 6 , 7 , 8 , 9 , 10
SCG is used in conjunction with exercise stress test (ETT) and is useful for the detection of exercise‐induced changes in cardiac muscle contractility that may occur during myocardial ischemia. To date, only a few clinical studies have shown that SCG had a significantly better sensitivity for detecting CAD than ETT, without loss of specificity. These papers demonstrated the superiority of SCG over ETT only in small and heterogeneous groups of patients, for instance, after coronary angioplasty and postmyocardial infarction. 11 , 12 , 13
The aim of our study was to compare the diagnostic accuracy of SCG with electrocardiographic exercise test (ETT) for diagnosing of ischemia in patients with angiographically proved CAD.
METHODS
Study Groups
Seventy‐seven male patients with stable CAD without MI, mean age 51 ± 9 years, were subjected to SCG and ETT testing. All patients had coronary angiography before inclusion to the study.
A gender‐matched control group consisted of 30 healthy volunteers aged 34 ± 7 years.
Exercise Test
All patients underwent symptom‐limited exercise stress test (ETT) on cycloergometer (Ergometric 800s, Margot Medical Ergo‐Line) connected with the computer system (Case 12, Marquette). The exercise workload started from 50 W and increased every 3 minutes by 50 W. The test was terminated when the target 85% of the predicted maximal heart rate was achieved or when any of the following occurred: severe angina, dyspnea, fatigue, complex ventricular arrhythmia, and ST‐segment depression of ≥2 mm. Horizontal or down sloping ST‐segment depression of ≥1 mm, 80 ms after the J point, was approved as a positive result of ETT.
Exercise Seismocardiography
SCG was done simultaneously with resting supine 12‐lead electrocardiography before and immediately after a symptom‐limited ETT, using Seismocardiograph 2000 (Seismed Instruments Incorporated).
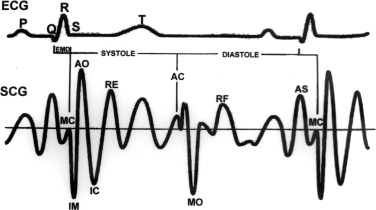
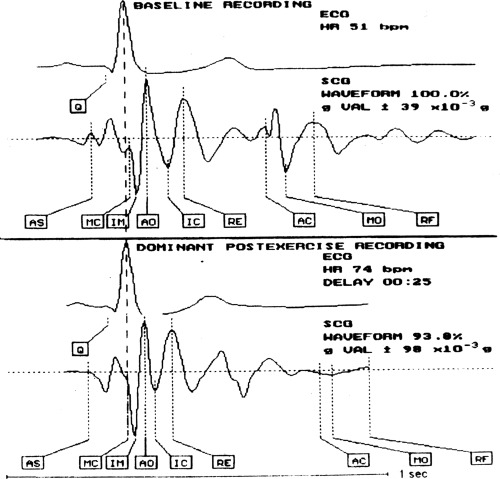
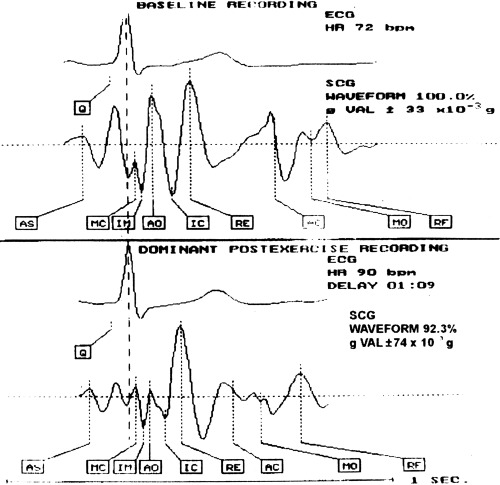
In the supine position, the accelerometer was placed on the sternum just above the xiphoid process. Each recording lasted 1 minute. When all recordings were completed, an SCG final rapport was printed. The seismocardiogram nomenclature is showed in Figure 1. The examples of normal SCG recording and during exercise‐induced ischemia are showed in Figures 2 and 3, respectively. The main criterion of abnormal SCG was a relative change in the systolic portion of tracing. The amplitude of the pre‐exercise aortic valve opening point (AO) was compared with that measured immediately after exercise ETT. The AO peak represents the acceleration of the sternum produced by the ventricle during this period of left ventricular isovolumic contraction that leads to the opening of the aortic valve. An attenuation of the acceleration of this event may be caused by an ischemic reduction in systolic performance. Thus, a decrease of the force of contraction, caused by myocardial ischemia, will result in a reduction in the amplitude of the acceleration of the sternum or a decrease in AO amplitude. Another indication of an abnormal SCG is a longer pre‐ejection period due to ischemia, which delays the occurrence of the AO point on the postexercise SCG. During ischemia, longer time is needed to increase ventricular pressure to the level where it overcomes the pressure in the aorta allowing the aortic valve to open. Postexercise AO decrease of ≥50%, AO disappearance, or a shift to the right in the postexercise waveform were considered as abnormal. If the AO amplitude after exercise remained unchanged or increased, SCG was considered as normal.
Figure 1.

Seismocardiogram nomenclature. MC = mitral valve closure; IM = isovolumic movement; AO = aortic valve opening; IC = isotonic contraction; RE = rapid ventricular ejection; AC = aortic valve closure; MO = mitral valve opening; RF = rapid ventricular filling; AS = atrial systole; EMD = electromechanical delay.
Figure 2.

Normal SCG. Patient J.P., age 43 with normal coronary angiography.
Figure 3.

Abnormal SCG. Patient J.M., age 53 with 95% stenosis of left anterior descending artery.
A secondary criterion for the recognition of myocardial ischemia was connected with diastole. Changes in the diastolic rapid ventricular filling (RF) wave are related to changes in the left ventricular end‐diastolic pressure. During ischemia, an increase in the amplitude of the RF wave is probably caused by either decreased compliance of the left ventricle and/or associated with ischemic‐mediated mitral insufficiency. An increase >20% in the amplitude of the RF wave immediately after exercise was terminated, confirming myocardial ischemia.
ECG and SCG were interpreted without the knowledge of results of coronary angiography. The sensitivity (TP/(TP + FP)), specificity (TN/(TN + FP)), positive predictive value (PPV = TP/(TP + FP)), negative predictive value (NPV = TN/(TN + FN)), test accuracy ((TP + TN)/total number tests performed) of SCG were compared with ETT, where TP is true positive, FP, false positive; TN, true negative; and FN is false negative value. Moreover, the diagnostic accuracy of both the methods was compared, with coronary angiography being the reference for the analysis.
Before inclusion to the study, all the patients underwent coronary angiography using the Judkins technique. The severity of the disease was assessed quantitatively according to the percent occlusion and the number of stenosed arteries. CAD was recognized if the patient had ≥50% stenosis in at least one main epicardial coronary artery.
Similarly, as Salerno and Zanetti, we demonstrated coronary artery stenosis at four levels of occlusion (1–49, 50–69, 70–89, 90–100%) and constructed a four‐point scale to reflect the number of arteries occluded (n) at each level: 0 = none, 1 = single, 2 = two, 3 = three vessel disease (0, 1, 2, or 3). Moreover, we created a severity score (S) based on the number of arteries ni with percent occlusion indicated by i (i = 1, 2, 3, 4 for levels of occlusion so that S =Σi ni4(i − 1)). 9
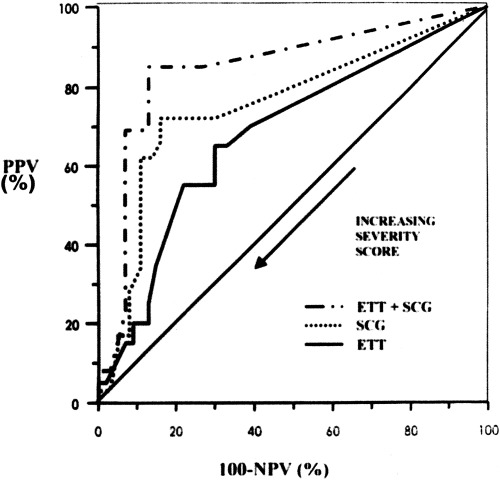
Taking into account the cut points on the score (S), we can trace the predictive value receiver operating characteristics curve (pv‐ROC) plotting the positive predictive value against: 100 − negative predictive value.
Statistical Analysis
The diagnostic accuracy of SCG and ETT was compared by Mc Nemar's test and for small groups by Fischer test (14). The differences in mean between parametric variables in subgroups of patients with stenosis <50% and ≥50% were compared by unpaired t‐test. The comparison of nonparametric data between these subgroups was performed by Pearson chi‐square test. A P value <0.05 was considered significant.
RESULTS
The baseline characteristics of 77 patients are listed in Table 1. More than half of the patients were in the first class according to Canadian Cardiac Society (CCS).
Table 1.
Patient Characteristics
| Age | 51.9 ± 9.03 |
| Obesity | 9 (11.7%) |
| Hypertension | 15 (19.5%) |
| β‐Blockers | 35 (45.5%) |
| Smoking | 25 (32.5%) |
| Diabetes | 5 (6.5%) |
| Hypercholesterolemia | 12 (15.6%) |
| CCS I | 42 (54.5%) |
| CCS II | 35 (45.5%) |
| Stenosis < 50% | 34 (44.2%) |
| Stenosis ≥ 50% in one artery | 23 (29.9%) |
| Stenosis ≥ 50% in two arteries | 16 (20.8%) |
| Stenosis ≥ 50% in three arteries | 4 (22%) |
Interestingly, the prevalence of hypertension, obesity, diabetes, hypercholesterolemia, and smoking was not too high in the examined patients. Approximately, one half was taking β‐blocker.
The number of patients with only one‐vessel disease (29.9%) was greater than either with two‐vessel (20.8%) or three‐vessel disease (2.2%).
Table 2 compares quantitative parameters obtained from ETT and SCG in subgroups of patients with ≥50% and <50% coronary artery stenosis leading to diagnosis of CAD. We observed that the positive results of SCG and ETT were significantly greater in patients with coronary stenosis ≥50% than in subgroup with coronary stenosis <50%. Moreover, a decrease of AO amplitude >50% in subgroup of patients with coronary stenosis ≥50% appeared to be the most sensitive parameter for detection of ischemia on SCG curve.
Table 2.
Comparison of Exercise Stress Test (ETT) and Seismocardiography (SCG) Parameters in Subgroups of Patients with ≥50% and <50% Coronary Artery Stenosis
| Parameters | Coronary Artery Stenosis <50%, n = 34 | Coronary Artery Stenosis ≥50%, n = 43 | P |
|---|---|---|---|
| Exercise durationa (min) | 7 ± 2 | 6 ± 2 | ns |
| Max workloada (Watt) | 122 ±25 | 103 ± 24 | 0.003 |
| Max heart ratea (bpm) | 134 ± 22 | 127 ± 15 | ns |
| Peak systolic blooda pressure (mmHg) | 177 ± 27 | 173 ± 29 | ns |
| Number of patients with ST ≥1 mm | 6 (17.6%) | 19 (44%) | 0.02 |
| Number of patients with positive SCGb | 8 (23.5%) | 28 (65%) | 0.001 |
| A decrease of AO amplitude >50%b | 3 (8.8%) | 20 (46.5%) | 0.001 |
| AO shifts to the rightb | 2 (5.8%) | 6 (13.9%) | ns |
| An increase of RFb amplitude | 3 (8.8%) | 2 (46%) | ns |
aData represent mean ± SD; bdata represent comparison of AO and RF amplitude on SCG curve before and after ETT.
ns = not statistically significant.
Table 3 shows the results of SCG and ETT in all examined (n = 77) patients. The true negative results of SCG were observed in 26 (33.8%) patients and ETT in 28 (36.3%) patients suggesting that ETT was more specific for exclusion ischemia in our patients. Moreover, the true positive results of seismocardiogram were seen in 28 (36.3%) patients and ETT in only 19 (24.7%) studied patients.
Table 3.
Exercise Stress Test (ETT) and Seismocardiography (SCG) Results for Diagnosing CAD
| True Positive | False Negative | False Positive | True Negative | Number of Pts | |
|---|---|---|---|---|---|
| ETT | 19 (24.7%) | 24 (31.2%) | 6 (7.8%) | 28 (36.3%) | 77 (100%) |
| SCG | 28 (36.3%) | 15 (19.5%) | 8 (10.4%) | 26 (33.8%) | 77 (100%) |
The abnormal seismocardiogram: a decrease of postexercise AO amplitude was observed in 23 (29.9%) patients, a delay of postexercise AO amplitude in 8 (10.4%), and an increase in the RF postexercise amplitude in 5 (6.5%) patients (Table 4). However, in 8 (10.4%) patients, the results were false positive.
Table 4.
Percentage of True Positive (TP) and False Positive (FP) Indicators of Ischemia on SCG (n = 77)
| A decrease of | 23 (29.9%) | TP | 20 (86.9%) |
| AO amplitude | FP | 3 (13.1%) | |
| AO shifts to | 8 (10.4%) | TP | 6 (75%) |
| the right | FP | 2 (25%) | |
| An increase | 5 (6.5%) | TP | 2 (60%) |
| of RF | FP | 3 (40%) |
The sensitivity and accuracy of SCG were significantly higher than that for ETT: 65.1% vs 44.2% (P < 0.05) and 70% vs 61% (P < 0.05), respectively. However, the specificity of the ETT was significantly greater than SCG (82.4% vs 76.5%, P < 0.05).
Thus, SCG appeared to be more sensitive and accurate method for diagnosing ischemia compared to ETT.
The positive and negative predictive values are shown in Table 5. The positive and negative predictive values of SCG were significantly better than that for ETT: 77.9% vs 76%, P < 0.05 and 63.4% vs 53.8% (P < 0.05), respectively. The positive concordant results of SCG and ETT improved ETT sensitivity from 44.2% to 58.3%. In addition, specificity of ETT was greater if there was concordance of negative SCG and ETT results (82.3% vs 91.7%).
Table 5.
Exercise Stress Test (ETT) and Seismocardiography (SCG) and Disease Severity
| Severity Score | ETT PPV (%) | ETT NPV (%) | SCG PPV (%) | SCG NPV (%) |
|---|---|---|---|---|
| 0 | 70 | 61 | 72 | 70 |
| 1 | 70 | 61 | 72 | 70 |
| 2 | 70 | 61 | 72 | 70 |
| 4 | 65 | 67 | 72 | 81 |
| 5 | 65 | 70 | 72 | 84 |
| 8 | 60 | 70 | 69 | 84 |
| 16 | 55 | 70 | 66 | 84 |
| 17 | 55 | 74 | 62 | 86 |
| 18 | 55 | 76 | 62 | 89 |
| 20 | 55 | 78 | 59 | 89 |
| 64 | 35 | 85 | 34 | 89 |
| 65 | 25 | 87 | 28 | 92 |
| 66 | 20 | 87 | 24 | 92 |
| 68 | 20 | 91 | 17 | 92 |
| 69 | 15 | 91 | 17 | 95 |
| 80 | 15 | 93 | 14 | 95 |
| 128 | 5 | 98 | 3 | 97 |
| 129 | 5 | 100 | 3 | 100 |
| 132 | 0 | 100 | 0 | 100 |
In control group of 30 healthy volunteers, specificity and accuracy of SCG and ETT were 86.7% and 100% (P = ns), respectively.
The pv‐ROC curves for the ETT and SCG are shown in Figure 4. It is noteworthy that the pv‐ROC curve for SCG lies above that for ETT. The predictive accuracy of concordant results, for both SCG and ETT, was significantly better than the predictive accuracy of SCG or ETT alone.
Figure 4.

The predictive value receiver operating characteristic (pv‐ROC) curves for the SCG and ETT based on 77 patients.
DISCUSSION
This study demonstrates that SCG improves diagnostic accuracy of exercise stress test for diagnosing of ischemia in patients without myocardial infarction (MI) and with angiographically proved CAD. We found that SCG performed in conjunction with ETT significantly increased sensitivity and accuracy of ETT for detection of ischemia caused by ≥50% stenosis in at least one main epicardial coronary artery. Thus, our findings confirm the earlier results obtained by Salerno and Zanetti that SCG is more sensitive for diagnosing of ischemia in heterogeneous group of 204 patients (after coronary angioplasty, after MI or without MI) compared to ETT. 3 , 4 , 5 , 6 , 7 , 8 , 9 They also documented that sensitivity of SCG was dependent on extension and degree of coronary artery stenosis. 4 , 9
Similarly, Wilson and coworkers stated that SCG was more sensitive for detecting ischemia in 129 patients after MI and coronary angioplasty (73% vs 48%) and as sensitive as thallium‐201 scintigraphy. 11 , 12 In addition, Salerno, Zanetti, and Malczewska indicated the usefulness of SCG as far as diagnosing of ischemia among women is concerned, where ETT gives a high percentage of false positive results. 9 , 15 However, not all patients in the aforementioned studies were undergone coronary angiography. It should be noted that in our study coronary artery disease in all 77 patients without MI was angiographically verified.
Moreover, we tried to find the more useful SCG parameter for detecting ischemia. A reduction in AO amplitude appeared to be of great value.
Thus, SCG in conjunction with ETT may be a helpful method for selecting patients requiring coronary angiography. Positive results of SCG and ETT may indicate the need of coronary angiography, without doing other more costly tests, such as thallium‐201 scintigraphy or stress echocardiography. Moreover, negative SCG and ETT results in doubtful cases allow us to avoid carrying out an invasive and more expensive coronary angiography as its results are likely to be normal.
STUDY LIMITATIONS
The SCG method can be limited by pathologies impairing left ventricular function, especially dilated cardiomyopathy, changing morphology of resting ECG as: left ventricular (LV) hypertrophy, aortic valve disease, bundle branch block, WPW syndrome. Moreover, difficulties with the interpretation of SCG could also be observed if frequent premature ventricular and supraventricular depolarization are registered.
Although only a few studies confirmed the usefulness of SCG performed simultaneously with ETT for detecting ischemia, it could easily be incorporated into clinical practice. The better diagnostic accuracy than ETT, the simplicity, and lower cost than thallium‐201 scintigraphy and coronary angiography should encourage clinicians to apply SCG to subjects with established coronary risk factors.
CONCLUSIONS
-
1
SCG appeared to be more sensitive for detecting ischemia caused by more than ≥50% stenosis of the main coronary artery compared to an electrocardiographic stress test.
-
2
SCG was a useful ETT adjunct for selecting patients requiring coronary angiography.
REFERENCES
- 1. Salerno D, Zanetti J. Seismocardiography: A new technique for recording cardiac vibration. Concept, method and initial observation. J Cardiovasc Technol 1990; 9: 111–117. [Google Scholar]
- 2. Zoneraich S. Seismocardiography is not a new term. Am J Cardiol 1992; 69: 573–574. [DOI] [PubMed] [Google Scholar]
- 3. Salerno D, Zanetti J, Mooney M, et al Seismocardiography for detection of coronary artery occlusion during coronary angioplasty: A preliminary report. J Am Coll Cardiol 1989;13: 43A. [Google Scholar]
- 4. Salerno D, Zanetti J, Green L, et al Qualitative exercise seismocardiography for detection of moderate and severe multivessel coronary artery disease. J Am Coll Cardiol 1990;15: 44A. [Google Scholar]
- 5. Salerno D, Zanetti J, Green L, et al Seismocardiographic changes associated with obstruction of coronary blood flow during balloon angioplasty. Am J Cardiol 1991; 68: 201–207. [DOI] [PubMed] [Google Scholar]
- 6. Salerno D, Zanetti J. Seismocardiography for monitoring changes in left ventricular function during ischemia. Chest 1991; 100: 991–993. [DOI] [PubMed] [Google Scholar]
- 7. Salerno D. Seismocardiographic changes induced by percutaneous transluminal coronary angioplasty. Eur Heart J 1991;12(Suppl.):331. [Google Scholar]
- 8. Salerno D, Wang K, Goldenberg I, et al The impact of selection bias on measurement of noninvasive test accuracy. Am J Cardiol 1993; 72: 223–225. [DOI] [PubMed] [Google Scholar]
- 9. Salerno D, Zanetti J, Poliac L, et al Exercise seismocardiography for detection of coronary artery disease. Am J Noninvasive Cardiol 1992; 6: 321–330. [Google Scholar]
- 10. Seismed Insruments Incorporated . Interpreting the exercise SCG test. A Physician's Guide 1992. [Google Scholar]
- 11. Wilson RA, Bamrah VS, Lindsay J, et al Diagnostic accuracy of seismocardiography compared with electrocardiography for the anatomic and physiologic diagnosis of coronary artery disease during exercise testing. Am J Cardiol 1993; 71: 536–545. [DOI] [PubMed] [Google Scholar]
- 12. Wilson RA, Bamrah VS, Lindsay J, et al Improved accuracy of seismocardiography versus electrocardiography for diagnosis of coronary artery disease during exercise testing. J Am Coll Cardiol 1992;19: 67A. [DOI] [PubMed] [Google Scholar]
- 13. Crook DW, Wilson RA, Bamrah VS, et al Improved sensivity of seismocardiography as compared with electrocardiography for the diagnosis of coronary artery disease during exercise stress testing in the elderly. Cardiol Elder 1994; 2: 401–409. [Google Scholar]
- 14. Siegel S. Non Parametric Statistics for the Behavioural Sciences. New York , Mc Graw‐Hill, 1956, pp. 63–67. [Google Scholar]
- 15. Malczewska B, Szwed H, Kowalik J, et al Exercise seismocardiography in diagnosis of IHD. Kardiol Pol 1995;43: 5–11. [Google Scholar]


