Abstract
We report a case of acute ST‐segment elevation myocardial infarction with an unusual evolution of ST‐segment elevation. Several possible explanations of this progression are discussed with supportive evidence for each explaination. The clinical, electrocardiographic, and angiographic features of this case are also illustrated.
Keywords: acute myocardial infarction, electrocardiogram, angiogram, ST elevation
CASE HISTORY
A 64‐year‐old female presented with a 2 week history of intermittent exertional chest pain and severe constant chest pain for 2 hours. The patient had multiple cardiovascular risk factors including diabetes mellitus type II, hypertension, and dyslipidemia, all of which were poorly controlled. On physical examination, the patient was found to be in severe pain but with no respiratory distress, afebrile, hypertensive with an initial blood pressure of 240/110 mmHg with no difference in both arms, pulse rate 75/min and oxygen saturation 96% on room air. Cardiovascular exam revealed no jugular venous distension, normal carotid upstroke with no bruit, normal S1 and S2 with an audible S4, and grade II/VI holosystolic murmur at the left lower sternal border with radiation to the apex. Lung exam revealed bilateral basilar crackles in the lower third of lung fields. There was trace pedal edema bilaterally and the pulses were palpable in the upper and lower extremities.
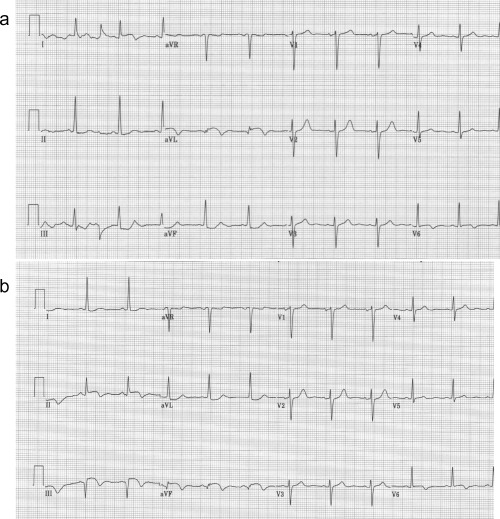
An electrocardiogram (ECG) obtained upon initial presentation showed sinus rhythm with a rate of 70/min with ST elevation in leads I, aVL, and V6 and ST‐segment depression in leads II, III, and aVF (Fig. 1A). Decision was made to emergently activate the cardiac catheterization laboratory. The patient was given aspirin 325 mg en route, started on heparin, given metoprolol 10 mg intravenously, and started on a nitroglycerine drip with subsequent decrease in the chest pain intensity from 10/10 to 4/10. Repeat ECG at this time (40 minutes after the original presentation) revealed sinus rhythm with a rate of 68/min, ST‐segment elevation in leads II, III, aVF, and V6 and ST‐segment depression in leads I and aVL (Fig. 1B). Right precordial leads showed no ST‐segment elevation in leads V3R and V4R.
Figure 1.

(a) Electrocardiogram on admission showing sinus rhythm with ST elevation and negative T waves in leads I, aVL, and V6, and ST depression in the inferior leads. (b) Forty minutes later an electrocardiogram was obtained showing sinus rhythm with Q waves, ST elevation, and negative T waves in the inferior leads, ST elevation with negative T wave in lead V6, and ST depression in leads I and aVL. The QRS axis has changed.
Cardiac catheterization was performed emergently and showed a dominant right coronary artery with a 95% lesion in the mid segment with TIMI grade III flow (Fig. 2A). Injection of the left main coronary artery showed luminal irregularities in the left anterior descending, and a 75% ostial lesion in the first obtuse marginal branch of the left circumflex artery with TIMI grade III flow (Fig. 2B).
Figure 2.

(a) Angiogram of the right coronary artery showing a 95% lesion in the mid portion of the artery (black arrow). (b) Angiogram of the left coronary artery showing irregularities in the left anterior descending artery and a 75% ostial lesion in the first obtuse marginal branch (white arrow).
DISCUSSION
The initial ECG obtained upon presentation revealed a current of injury in the lateral leads, suggesting acute lateral myocardial infarction (Fig. 1A). However, another ECG obtained within 30 minutes of the first one after resolution of pain was compatible with acute inferolateral myocardial infarction (Fig. 1B). Based on the electrocardiographic evolution and the coronary angiographic findings there were five possibilities to explain the electrocardiographic evolution of the case (Table 1).
Table 1.
| 1. Culprit lesion in the first obtuse marginal |
| (or ramus intermedius) |
| 2. Culprit lesion in the left circumflex artery |
| 3. Culprit lesion in the right coronary |
| 4. Two separate culprit lesions |
| (obtuse marginal and right coronary artery) |
| 5. Lead misplacement |
The differential diagnosis of acute myocardial infarction with ST elevation in leads I and aVL includes occlusion of the first diagonal branch, the proximal part of the left anterior descending coronary artery, the first obtuse marginal branch or a ramus intermedius. 1 , 2 Occlusion of the first diagonal branch is usually accompanied by ST elevation in lead V2 with isoelectric ST or ST depression in V3–V4. In contrast, proximal occlusion of the left anterior descending artery (before the first diagonal branch) is associated with ST elevation in V2 and V3 and occasionally in V4 up to V6. On the other hand, isolated occlusion of the first obtuse marginal usually causes ST depression in lead V2, as in our case. 1 , 2 Occlusion of the ramus intermedius (a branch that emerges from the bifurcation between the left anterior descending and left circumflex artery in some patients and has a course intermediate between the first diagonal and first obtuse marginal branches) theoretically may cause an electrocardiographic picture resembling either diagonal or obtuse marginal occlusion. The electrocardiographic evolution could be explained by partial reperfusion with development of subendocardial ischemia. Kataoka et al. 3 described a case of posterolateral non‐ST‐segment elevation myocardial infarction with reciprocal ST‐segment elevation in the central precordial leads. The ECG changes in our patient may be explained by transition from transmural ischemia (ST elevation in leads I and aVL) to subendocardial ischemia (ST depression in these leads with reciprocal ST elevation in the inferior leads), especially since the patient had clinical signs of reperfusion with resolution of pain.
Alternatively, a retrograde progression of a thrombus originating from the first marginal branch into a dominant left circumflex artery may lead to additional inferior‐posterior ischemia. In this case, the inferiorly directed vector of the current of ischemia may oppose the superior current caused by the first marginal branch occlusion and the magnitude of ST elevation in both the inferior and lateral leads will be attenuated. However, the clinical picture was compatible with reperfusion and not propagation of ischemia. In addition, the angiogram did not show an obstructive lesion in the left circumflex artery.
Another possibility is a subendocardial inferior acute myocardial infarction (caused by either right coronary artery or left circumflex artery partial occlusion and manifests as ST depression in the inferior leads with reciprocal ST elevation in leads I and aVL) progressing to total occlusion of the infarct‐related artery with development of transmural injury (ST elevation in the inferior leads with reciprocal ST depression in leads I and aVL). Again, the clinical picture of the resolution of symptoms combined with the angiographic findings make this option unlikely.
The presence of simultaneous two different culprit lesions in the right coronary artery and first obtuse marginal with fluctuating occlusion of the two arteries may explain the electrocardiographic evolution. Rioufol et al. utilized intravascular ultrasound to look for plaque rupture in coronary arteries other than the culprit vessel in patients with acute coronary syndrome. Ruptured plaque in multiple coronary arteries was seen in 80% of patients, which is consistent with an overall coronary instability in patients with acute coronary syndrome. 4
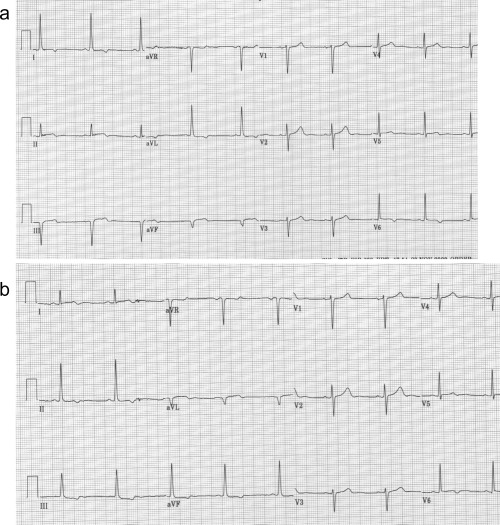
The last explanation for the electrocardiographic evolution in the present case is lead misplacement. The change in the ST‐segment elevation from leads I and aVL to leads II, III, and aVF could be due to switching the left arm and left leg leads. The fact that the QRS axis have changed and that lead II in the first electrocardiogram (Fig. 1A) is now resembles lead I in the second tracing (Fig. 1B) and lead aVL in the first tracing, now resembles lead aVF in the second tracing, supports this possibility. To verify it we repeated the ECG with the limb electrodes position correctly and after connecting the left arm electrode to the left leg and the left leg electrode to the left arm (Figs. 3A and B). As is clearly seen, when the electrodes were placed correctly, the patient had ST elevation in the inferior leads. However, when the left arm and leg electrodes were switched, the electrocardiogram showed ST elevation in leads I and aVL.
Figure 3.

(a) Electrocardiogram on the second day with the leads connected appropriately showing sinus rhythm with Q waves, residual ST elevation and negative T waves in the inferior leads and lead V6, and ST depression in I and aVL. (b) Electrocardiogram obtained after reversing the left arm and left leg electrodes. The QRS axis has changed. There is now Q wave in leads I and aVL with residual ST elevation, ST elevation in lead V6, and ST depression in the inferior leads.
Misplacement of the leads may cause mistakes in the interpretation of the electrocardiogram. This is important especially when the electrocardiogram is used to monitor reperfusion (ST resolution) and for identification of the infarct‐related lesion. In particular, in cases similar to our patient, when there is more than one coronary narrowing, there is only partial occlusion without angiographic features of a thrombus or reduced flow, we usually use the electrocardiogram to determine which of the lesions is the culprit lesion. In such cases identification of the exact culprit lesion is important because percutaneous intervention on the nonculprit lesions at the time of acute myocardial infarction is considered a class III indication by the American College of Cardiology/American Heart Association Guidelines for acute myocardial infarction. 5
REFERENCES
- 1. Birnbaum Y, Hasdai D, Sclarobsky S, et al Acute myocardial infarction entailing ST‐segment elevation in leads aVL: Electrocardiographic differentiation among occlusion of the left anterior descending, first diagonal and first obtuse marginal coronary arteries. Am Heart J 1996;131: 38–42. [DOI] [PubMed] [Google Scholar]
- 2. Birnbaum Y, Drew BJ. The electrocardiogram in ST elevation acute myocardial infarction: correlation with coronary anatomy and prognosis. Postgrad Med J 2003;79: 490–504. [DOI] [PMC free article] [PubMed] [Google Scholar]
- 3. Kataoka H, Tamura A, Jikuriya Y. Central precordial reciprocal ST‐segment elevation in posterlateral myocardial infarction. Am Heart J 1993;125: 1202–1204.DOI: 10.1016/0002-8703(93)90149-4 [DOI] [PubMed] [Google Scholar]
- 4. Rioufol G, Finet G, Ginon I, et al Multiple atherosclerotic plaque rupture in acute coronary syndrome: a three‐vessel intravascular ultrasound study. Circulation 2002;106: 804–808. [DOI] [PubMed] [Google Scholar]
- 5. Ryan TJ, Antman EM, Brooks NH, et al 1999 update: ACC/AHA Guidelines for the management of patients with acute myocardial infarction: executive summary and recommendations: A report of the American College of Cardiology/American Heart Association Task Force on Practice Guidelines (Committee on Management of Acute Myocardial Infarction). Circulation 1999;100: 1016–1030. [DOI] [PubMed] [Google Scholar]


