Abstract
We report a case of a 68‐year‐old man admitted to the emergency department with syncope preceded by rapid palpitations. His admission ECG demonstrated a sustained ventricular tachycardia (VT) originating from the right ventricular outflow tract (RVOT). This report highlights the importance of distinguishing ventricular tachycardia caused by arrhythmogenic right ventricular dysplasia (ARVD) from the more benign idiopathic RVOT‐VT. Furthermore, we demonstrate the utility of the Fontaine leads placement in increasing the sensitivity for uncovering epsilon waves, a highly specific electrocardiographic feature that increases diagnostic accuracy in patients with ARVD.
Keywords: arrhythmogenic right ventricular dysplasia, arrhythmogenic right ventricular dysplasia/cardiomyopathy, ARVD, fontaine leads, ARVD/C
CASE PRESENTATION
A 68‐year‐old male presented to the emergency department with syncope preceded by rapid palpitations. An ECG revealed a sustained, wide complex tachycardia with a rate of 234 beats per minute interpreted as ventricular tachycardia (VT; Fig. 1). After successful electrical cardioversion into sinus rhythm (Fig. 2), an IV infusion of amiodarone was administered and the patient was referred to our center, where he was admitted in a stable hemodynamic condition.
Figure 1.
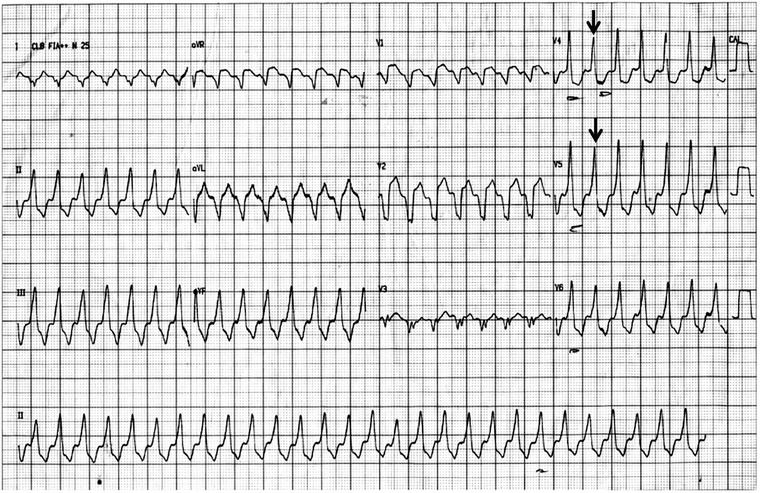
Sustained monomorphic VT. Heart rate of 234 bpm, rightward/inferior axis (around +95°), QRS with broad duration (>120 ms), LBBB‐like morphology in lead V1, inferior axis, and atrioventricular dissociation. Note a fusion beat (arrow) indicating VT.
Figure 2.
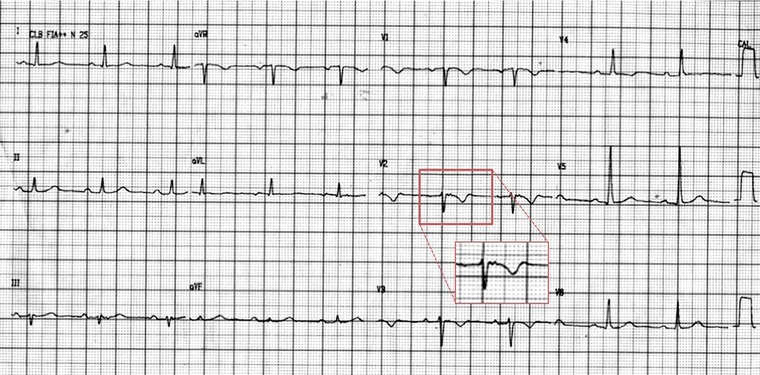
Sinus rhythm. Heart rate of 63 bpm, normal axis, T‐wave inversion from V1 to V4, and an epsilon wave (arrow) better seen in lead V2. Note that presence of inverted T waves in leads V1–V3 or beyond in individuals >14 years of age (in the absence of complete right bundle‐branch block QRS ≥120 ms) is a major criterion of the Revised Task Force Criteria.
He had significant medical history. Family history is significant for a brother who died suddenly at the age of 40 years old. Physical examination following cardioversion was unremarkable. Blood work revealed normal electrolytes and slightly elevated cardiac enzymes attributable to the cardioversion. As the ECG demonstrated T‐wave inversions in anterior leads (V1–V4) coronary angiography was performed and revealed a <70% lesion in the first diagonal branch of the left anterior descending artery. No interventional procedure was performed. An echocardiogram demonstrated normal biventricular function with right ventricular and right ventricular outflow tract (RVOT) dilation suggestive of arrhythmogenic right ventricular dysplasia (ARVD). An ECG was ordered using Fontaine bipolar precordial leads that demonstrated epsilon waves in leads FI–FIII (Fig. 3). A cardiac MRI demonstrated abnormal amounts of epicardial fat, right ventricular wall thinning, right ventricular free wall aneurysm, fat infiltration in the right ventricular free wall, and fibrosis of the right ventricular wall with outflow tract involvement (Fig. 4). The patient received a implantable cardioverter‐defibrillator.
Figure 3.
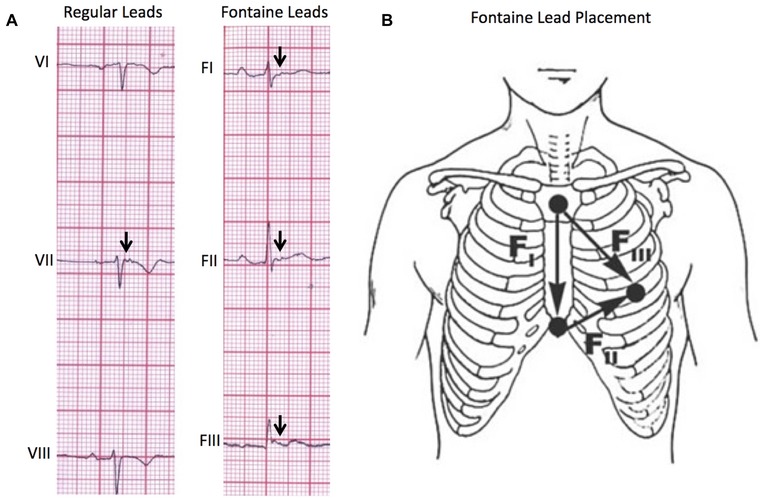
(A) Comparison of regular lead placement versus Fontaine lead placement in the ability to detect epsilon waves (arrows). Using the Fontaine lead placement increases sensitivity of detecting epsilon waves so that they are detected in three leads (FI, FII, FIII) rather than one lead in the regular placement. (B) Fontaine bipolar precordial lead placement. In this modified technique, the ECG should be recorded at double speed (50 mm/s) and double voltage (20 mm/s) to improve the sensitivity for detection of epsilon waves.9
Figure 4.
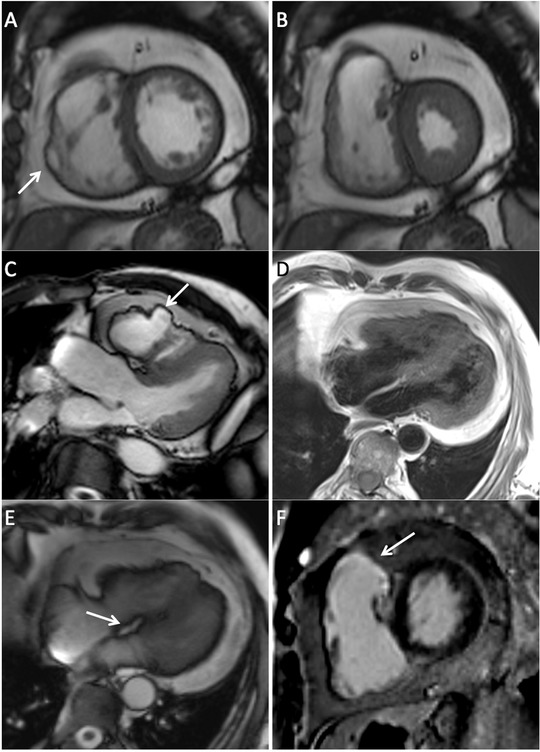
(A) Short‐axis bright blood SSFP image remarkable for abnormal amounts of epicardial fat, right ventricular wall thinning and aneurysm (arrow). (B) Short‐axis bright blood SSFP image in systole where right ventricular free wall thinning is demonstrated. (C) Left ventricular outflow tract SSFP image showing an irregular pattern of the right ventricular free wall with aneurysmal formation. (D) Double inversion recovery four‐chamber image demonstrating fat infiltration of the right ventricular free wall. (E) Four chamber SSFP image remarkable for the presence of fat infiltration in the basal portion of the interventricular septum (arrow). (F) Late gadolinium enhancement short‐axis image with presence of fibrosis in the right ventricular wall involving the outflow tract (arrow). The left ventricle is free of fibrosis.
POINTS TO PONDER
A wide‐complex tachycardia warrants differential diagnosis between VT and supraventricular tachycardia with aberrancy. This distinction can be made using the Brugada and/or Vereckei algorithms (Fig. 5).1, 2 According to both algorithms, a diagnosis of VT can be made (Fig. 1).
Figure 5.
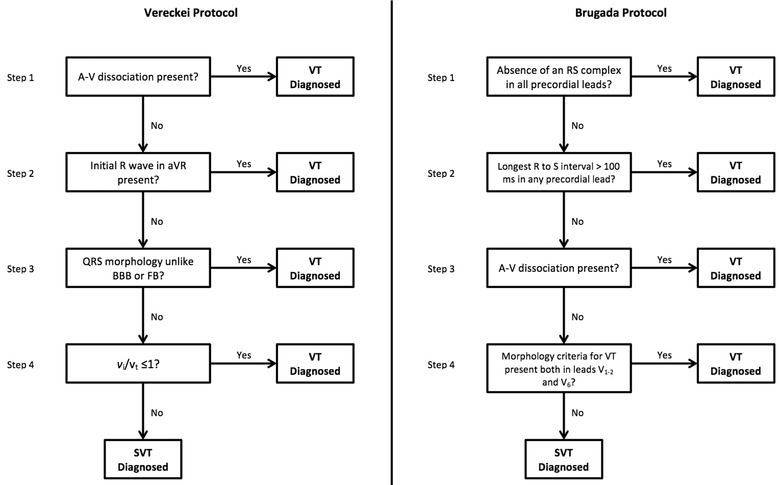
The Brugada and Vereckei algorithms for the differential diagnosis of wide QRS complex tachycardias.1, 2
VTs with left bundle branch block‐like morphology in lead V1 and an inferior axis (negative R wave in lead aVL and positive in leads II, III, aVF) typically arise from the RVOT (Fig. 1).3 The classical differential diagnosis for VT originating from the RVOT is either idiopathic RVOT‐VT or ARVD VT.4 Recent evidence has identified electrocardiographic criteria that are able to accurately distinguish idiopathic RVOT‐VT from ARVD VT.4 Hoffmayer et al. described an electrocardiographic ARVD risk score that includes both sinus rhythm ECG criteria as well as VT ECG criteria making it useful in distinguishing between these arrhythmias (Table 1). An score of 5 or more correctly distinguishes ARVD VT from idiopathic RVOT‐VT on ECG; 93% of the time with a sensitivity of 84%, specificity of 100%, positive predictive value of 100%, and a negative predictive value of 91%.4 The ECG in this case demonstrated T‐wave inversions in precordial leads V1–V4 in sinus rhythm (Fig. 2), and QRS duration ≥120 ms in lead I and QRS with notching in leads I, aVL, V2, and V3 during VT (Fig. 1) yielding a score of 7/8 favoring ARVD as the substrate.
Table 1.
Electrocardiographic ARVD Risk Score for the Diagnosis of ARVD
| Electrocardiographic ARVD/C Risk Score | |
|---|---|
| ECG Characteristic | Points |
| Anterior T‐wave inversions (V1–V3) in sinus rhythm | 3 |
| VT/PVC | |
| Lead 1 QRS duration >120 ms | 2 |
| QRS notching (multiple leads) | 2 |
| V5 transition or later | 1 |
| Maximum total | 8 |
A score of 5 or greater correctly distinguishes ARVD from idiopathic VT 93% of the time (sensitivity of 84%, specificity of 100%, positive predictive value of 100%, negative predictive value of 91%).4
An international Task Force developed criteria for the diagnosis of ARVD that incorporates structural, functional, and electrophysiological abnormalities found in the disease, where a definitive diagnosis of ARVD requires either two major, one major, and two minor, or four minor criteria from different categories.5 According to the ECG criteria established by the Task Force (Table 2), this case meets the major criteria for repolarization abnormalities (inverted T waves in right precordial leads [V1–V3] or beyond) and the minor criteria for arrhythmias (RVOT‐VT). The standard 12‐lead ECG in this case demonstrates an epsilon wave in lead V2 which, alone, is not enough to meet the major criteria for depolarization/conduction abnormalities (epsilon waves in the right precordial leads [V1–V3]). Therefore, on the basis of standard 12‐lead ECG evaluation alone, this case does not meet the Task Force requirements for a definitive diagnosis of ARVD.
Table 2.
Revised Task Force ECG Criteria for the Diagnosis of ARVD
| Revised Task Force Criteria: ECG Criteria | |
|---|---|
| Major | Minor |
| I. Repolarization abnormalities | |
| • Inverted T waves in right precordial leads (V1–3) or beyond in individuals >14 years of age (in the absence of complete right bundle‐branch block QRS ≥120 ms) | • Inverted T waves in leads V1 and V2 in individuals >14 years of age (in the absence of complete right bundle‐branch block or in V4, V5, or V6) |
| • Inverted T waves in leads in V1, V2, V3, and V4 in individuals >14 years of age in the presence of complete right bundle‐branch block | |
| II. Depolarization/conduction abnormalities | |
| • Epsilon wave (reproducible low‐amplitude signals between end of QRS complex to onset of the T wave) in the right precordial leads (V1–3) | • Late potentials by SAECG in ≥5: 1 of 3 parameters in the absence of a QRS duration of ≥110 ms on the standard ECG |
| • Filtered QRS duration (fQRS) ≥2: 114 ms | |
| • Duration of terminal QRS <40 uV (low‐amplitude signal duration) ≥38 ms | |
| • Root‐mean‐square voltage of terminal 40 ms ≤ 20 uV | |
| • Terminal activation duration of QRS ≥55 ms measured from the nadir of the S wave to the end of the QRS, including R’, in V1, V2, or V3, in the absence of complete right bundle‐branch block | |
| III. Arrhythmias | |
| • Nonsustained or sustained ventricular tachycardia of left bundle‐branch morphology with superior axis (negative or indeterminate QRS in leads II, III, and aVF and positive in lead aVL) | • Nonsustained or sustained ventricular tachycardia of RV outflow configuration, left bundle‐branch block morphology with inferior axis (positive QRS in leads II, III, and aVF and negative in lead aVL) or of unknown axis |
| • >500 ventricular extrasystoles per 24 hours (Holter) | |
Criteria for definitive diagnosis requires either two major criteria, one major and two minor criteria, or four minor criteria from different categories.5
The epsilon wave is a small positive deflection that can either appear as blips occurring after the end of the QRS complex or as notches buried in the end of the QRS complex.6 This depolarization abnormality is a marker of delayed excitation of the surviving myocytes that are interspersed between fibrous and fatty tissue and is considered a hallmark feature of ARVD.7 However, epsilon waves are only detected in the ECGs of a small minority of patients with ARVD (10–37%).8
The Fontaine bipolar precordial lead ECG placement is a modified ECG recording where the left arm lead is placed on the xypohid process, the right arm on the manubrium, and the left leg in the location of V4 (Fig. 3). This arrangement is used to specifically record the potentials developed in the right ventricle from the RVOT to the diaphragmatic area. The ECG is recorded at double paper speed (50 mm/s) and voltage (20 mm/mV) with a filter setting of 40 Hz.7 This placement improves the sensitivity of detection of epsilon waves up to 66% when combined with the standard 12‐lead ECG.9 The utility of the Fontaine lead placement is well demonstrated in this case. Although the standard 12‐lead ECG (Fig. 2) demonstrated an epsilon wave in lead V2, it was not enough to make the major criteria set by the Task Force. By utilizing the Fontaine lead placement, we were able to detect Epsilon waves in FI, FII, and FIII, thereby fulfilling the major depolarization/conduction abnormality criterion. With this case now demonstrating two major criteria, according to the Task Force, a definitive diagnosis of ARVD can now be made on ECG alone.
Cardiac MRI demonstrated additional major task force criteria thereby confirming the diagnosis of ARVD.
REFERENCES
- 1. Brugada P, Brugada J, Mont L, et al. A new approach to the differential diagnosis of a regular tachycardia with a wide QRS complex. Circulation 1991;83(5):1649–1659. [DOI] [PubMed] [Google Scholar]
- 2. Vereckei A, Duray G, Szenasi G, et al. Application of a new algorithm in the differential diagnosis of wide QRS complex tachycardia. Eur Heart J 2007;28(5):589–600. [DOI] [PubMed] [Google Scholar]
- 3. Ainsworth CD, Skanes AC, Klein GJ, et al. Differentiating arrhythmogenic right ventricular cardiomyopathy from right ventricular outflow tract ventricular tachycardia using multilead QRS duration and axis. Heart Rhythm 2006;3(4):416–423. [DOI] [PubMed] [Google Scholar]
- 4. Hoffmayer KS, Bhave PD, Marcus GM, et al. An electrocardiographic scoring system for distinguishing right ventricular outflow tract arrhythmias in patients with arrhythmogenic right ventricular cardiomyopathy from idiopathic ventricular tachycardia. Heart Rhythm 2013;10(4):477–482. [DOI] [PubMed] [Google Scholar]
- 5. Marcus FI, McKenna WJ, Sherrill D, et al. Diagnosis of arrhythmogenic right ventricular cardiomyopathy/dysplasia: Proposed modification of the task force criteria. Eur Heart J 2010;31(7):806–814. [DOI] [PMC free article] [PubMed] [Google Scholar]
- 6. Stankovic I, Vlahovic‐Stipac A, Putnikovic B, et al. Distinguishing incomplete right bundle branch block in patients with arrhythmogenic right ventricular cardiomyopathy from normal variants: A potential role of Fontaine leads and Holter monitoring? Int J Cardiol 2012;157(1):148–150. [DOI] [PubMed] [Google Scholar]
- 7. Chiladakis J, Zagli F, Karantalis V, et al. New diagnosis of arrhythmogenic right ventricular cardiomyopathy in an octogenarian with the help of Fontaine electrocardiographic leads. Europace 2010;12(8):1197–1198. [DOI] [PubMed] [Google Scholar]
- 8. Arbelo E, Josephson ME. Ablation of ventricular arrhythmias in arrhythmogenic right ventricular dysplasia. J Cardiovasc Electrophysiol 2010;21(4):473–486. [DOI] [PubMed] [Google Scholar]
- 9. Wang J, Yang B, Chen H, et al. Epsilon waves detected by various electrocardiographic recording methods: In patients with arrhythmogenic right ventricular cardiomyopathy. Tex H Inst J 2010;37(4):405–411. [PMC free article] [PubMed] [Google Scholar]


