Abstract
Background: The noninvasive detection of restenosis after percutaneous coronary intervention (PCI) remains a clinical challenge. Previous studies have shown that magnetocardiograms reveal obvious changes in patients with coronary artery disease (CAD) and normal electrocardiogram (ECG) at rest.
Hypothesis: The present study aimed to evaluate the potential of magnetocardiography (MCG) for the detection of electrophysiological changes in the course of successful PCI.
Methods: Twelve‐lead ECG and unshielded four‐channel MCG (SQUID AG, Essen, Germany) were registered at nine prethoracic sites in 50 patients with CAD (62 10 years; EF = 76 11%; registration: before, 24 hours, and 1 month (n = 25) after PCI) and 57 normals (51 9 years). Current density vector (CDV) maps were reconstructed within the ST–T interval and classified from category 0 (normal) to category 4 (grossly abnormal). In both groups and at all registration times, the percentage of each category of maps was calculated and compared.
Results: Most CDV maps of normals were classified as category 0, 1, or 2 compared to CAD patients before PCI with most maps of category 3 and 4 (P < 0.0005). Twenty‐four hours after PCI, more maps were classified as category 2 (P < 0.05) and less as category 4 (P < 0.005). One month after PCI the MCG results further improved: more maps were classified as category 1 (P < 0.05) and 2 (P < 0.005) and less maps as category 4 (P < 0.0001). The ECG remained unchanged in the course of PCI.
Conclusion: Unshielded four‐channel MCG reveals obvious changes in the course of successful PCI on the basis of CDV map reconstruction during repolarization. The method seems to be suitable for the follow‐up of patients after PCI.
Keywords: magnetocardiography, CAD, coronary intervention, current density reconstruction, shielding
Despite major technological advances in the past decades, the percutaneous treatment of coronary artery disease (CAD) is still hampered by a 20–30% incidence of restenosis. 1 , 2 , 3 The detection of a hemodynamically relevant restenosis remains a clinical challenge. In order to avoid x‐ray exposure and possible serious side effects, reangiography should be restricted to those patients in whom repeated interventional therapy appears to be indicated. The 12‐lead electrocardiogram (ECG) is frequently normal even in case of restenosis and other noninvasive methods such as stress ECG, radionuclide scintigraphy, and echocardiography are less sensitive than contrast coronary angiography for the detection of restenosis. 4 , 5 , 6 , 7 New imaging techniques like electron beam tomography, multislice‐computer tomography, or magnetic resonance imaging reveal promising results in native coronary vessels but the in‐stent region is difficult to analyze and these methods partly require x‐ray exposure. Furthermore, the analysis is a time consuming process as in the case of three‐dimensional reconstruction of the coronary vessels or the measurement of coronary flow reserve. 8 , 9 , 10 Thus, most patients with recurrent chest pain after percutaneous coronary intervention (PCI) undergo renewed contrast coronary angiography.
Magnetocardiography (MCG) as a completely noninvasive method augments the information of 12‐lead surface ECG as it registers cardiac activity at more registration sites and is thus comparable to body surface potential mapping (BSPM). 11 , 12 The signal can be processed and analyzed in a fashion similar to ECG (Fig. 1C). Several previous studies have shown that myocardial ischemia may be detected by MCG under stress or even under resting conditions. Most of the patients included in these studies had a normal ECG at rest. 13 , 14 , 15 , 16 , 17 , 18 However, MCG systems are often installed inside a shielded room which is a cost disadvantage. We have shown that, using an unshielded single‐channel system, CAD patients revealed obvious differences compared to healthy subjects on the basis of current density reconstruction in the course of ventricular repolarization. 19 The present study was performed with a four‐channel magnetometer in unshielded location. The study aimed to evaluate the potential of MCG for the detection of electrophysiological changes in the course of successful PCI using current density vector (CDV) map reconstruction throughout the ST–T interval.
Figure 1.
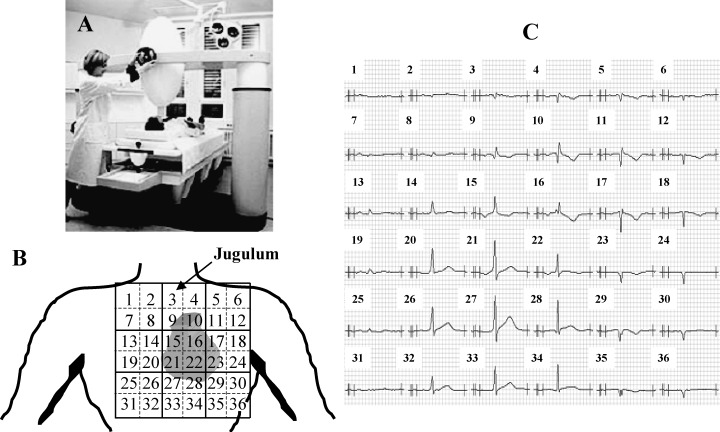
(A) Four‐channel MCG in unshielded setting, SQUID AG, Essen, Germany. (B) A 6 × 6 rectangular grid used for MCG registration, the covered precordial area is 20 × 20 cm2. The four‐channel sensor registered four sites simultaneously at nine positions. The jugulum is at site 3. (C) Example of one subject's averaged MCG signals in all 36 positions.
METHODS
Subjects
The study included 111 subjects. Of these, 54 patients had stable or unstable angina and angiographically documented CAD with stenosis of 75% of at least one coronary vessel and normal left ventricular function (EF = 76 11%) without prior myocardial infarction. All these patients received interventional treatment: the site of angioplasty was the left anterior descending coronary artery (LAD) in 27 patients, the left circumflex coronary artery (LCx) in 8 patients, and the right coronary artery (RCA) in another 19 patients. The control group consisted of 57 healthy subjects. The patients were selected consecutively from all patients admitted to hospital over a period of 6 months with the indication for coronary angiography and PCI due to chest pain. The following patients were not admitted to the study: those with atrial fibrillation or atrial flutter, bundle branch block, pacemaker therapy, left ventricular hypertrophy as assessed by echocardiography, valvular heart disease, renal insufficiency with need for dialysis, or other catabolic disease. The control group consisted of healthy subjects with no history of any cardiovascular disease, normal ECG at rest and stress as well as a normal echocardiogram at rest. They were mainly recruited from the local fire and police department. Baseline characteristics of all subjects are given in Table 1. All patients gave their written informed consent.
Table 1.
Patient Characteristics
| N (n = 57) | CAD (n = 50) | |
|---|---|---|
| Male | 45 | 34 |
| Age (years) | 51 ± 9 | 62 ± 10 |
| Coronary status | ||
| 1‐vessel | 22 | |
| 2‐vessel | 15 | |
| 3‐vessel | 17 | |
| Site of intervention | ||
| LAD | 27 | |
| LCx | 8 | |
| RCA | 19 | |
| Ejection fraction | 76 ± 11 | |
CAD = Patients with coronary artery disease; N = healthy subjects; LAD = left anterior descending coronary artery; LCx = left circumflex coronary artery; RCA = right coronary artery.
Data Acquisition
Twelve‐lead ECG and 36‐channel MCG were performed in all subjects. MCG recordings were obtained at nine prethoracic sites using a four‐channel SQUID‐magnetometer (SQUID AG, Essen, Germany) in an unshielded setting (Fig. 1A) within a 20 by 20 rectangular grid with a 4 cm pitch over the precordial area. The sensor was positioned as close to the thorax as possible, directly over the heart initially at the jugulum (position 3 in Fig. 1B). The examination table with the patient resting in the same position was then moved in a systematic fashion to each of the nine predetermined positions under the SQUID detector. Data were recorded at each registration point for 30 seconds and stored on hard disk for further evaluation. An ECG lead II was registered and stored simultaneously in order to facilitate signal processing of the MCG signal. In CAD patients, MCG was registered before (n = 54), 24 hours after (n = 46) as well as 1 month after (n = 25) successful PCI.
Coronary angiography and left heart catheterization were acquired in multiple projections using the Judkins technique according to standard clinical practice (Siemens Cathcor, Erlangen, Germany) within 24 hours of the first MCG recording before PCI.
Data Analysis
From the coronary angiograms two experienced observers assessed the degree of stenosis visually in the major branches. Only those patients with narrowing of the coronary arteries ≥75% and successful interventional therapy were included in this study. No quantitative assessment of individual lesions was made.
In MCG in each raw data set all beats were averaged at each position (Fig. 1C). For further analysis the reconstruction of current density vector maps were reconstructed at selected latencies. The calculation of these maps is based on an inverse solution as implemented in the software package MAGwin. 20 , 21 , 22 , 23 The CDV maps reflect the complex source structure associated with distributed excitation wave fronts within the heart. From the magnetic field values detected at each of the 36 registration sites at each latency, the cardiac de‐ and repolarization process was projected onto a plane containing 100 points. At each point, the lead fields were shown as vector magnitudes indicating the strength and direction of the field.
At each registration time in the course of PCI, CDV maps were generated every 10 ms within the ST–T interval starting with the J‐point to the end of the T wave (Fig. 2). For timing purposes, lead II of the surface ECG served as reference channel. Each CDV map in course of the ST–T interval was analyzed visually by two independent observers by means of a classification system with a scale from 0 (normal) to 4 (grossly abnormal). The two observers did not know the subject's underlying condition. Briefly, the classification system is based on the notion that, during normal repolarization, the underlying electrical activity will be coordinated and that the current distributions represented in the CDV maps will be primarily characterized by currents in a left‐ and downward direction. Disturbances in repolarization will affect the symmetry of the maps and these asymmetries are quantified on the basis of the weighted sums of the directions of the vectors. Normal CDV maps are classified as category 0 and with the categories 1–4 indicating an increasing deviation from the normal direction and form a dipolar pattern (Fig. 3). 19
Figure 2.
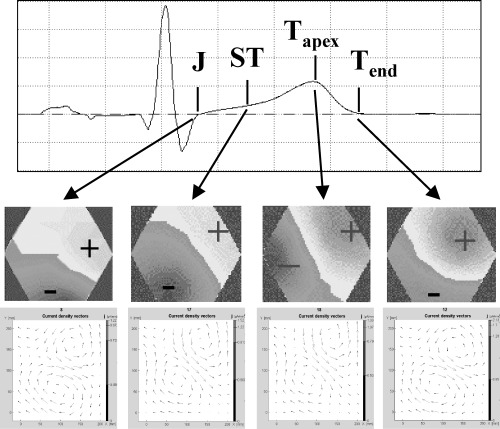
Example of reconstruction of several current density vector maps in the course of the ST–T interval with the MCG signal above, the corresponding magnetic fields in the middle and the current density vector maps below.
Figure 3.
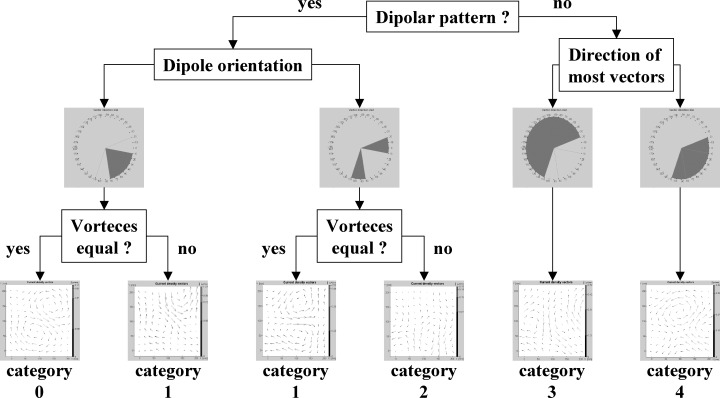
Flow chart of the classification system including one example of the corresponding current density vector map.
According to this classification system, each CDV map within the ST–T interval of all patients at the different registration times and of all healthy volunteers was classified. In both normals and CAD patients, before and after PCI the percentage of maps per category was determined.
Statistical Analysis
In the text, values are given as means ± SD. The percentage of maps per category is shown for each subject group in boxplots. In both normals and CAD patients before and after PCI the percentage of each CDV map category was calculated and compared using Mann‐Whitney U‐test for the comparison between normals and CAD patients before PCI and Wilcoxon test for the comparison between the different registration times in CAD patients. A P value less than 0.05 was considered statistically significant.
RESULTS
ECG was normal in healthy subjects. In CAD patients, ECG was normal (n = 34) or revealed unspecific changes of the ST–T interval (n = 16) before PCI. The blood pressure was ≤140/90 mmHg in all subjects at the time of MCG registration.
After the MCG registration in the CAD group 4 (7.4%) had to be excluded because of a poor signal quality. The remaining 50 patients were included for the comparison together with all 57 healthy subjects and for further follow‐up. Successful PCI was performed in all CAD patients and NCG could be obtained in 46 cases. Each vessel was treated with at least one stent.
In MCG 22.3 ± 1.9 CDV maps were generated on average. In 10.5% of map classifications the two observers did not agree. In this case, the maps were reexamined and reclassified. Comparing the patterns of the CDV map distribution between healthy subjects and patients with CAD, differences could be visualized on the basis of boxplots which quantify the percentage of each CDV map category in each subject for both groups (Fig. 4). In normals, a majority of maps was classified as category 0, 1, or 2 whereas in patients with CAD before PCI the categories 3 and 4 were found most frequently. In order to quantify the differences between healthy subjects and CAD patients before interventional therapy we compared the percentage of each single CDV map category on the basis of the Mann‐Whitney U test. The differences were statistically significant for each category (P < 0.0005 for all categories).
Figure 4.
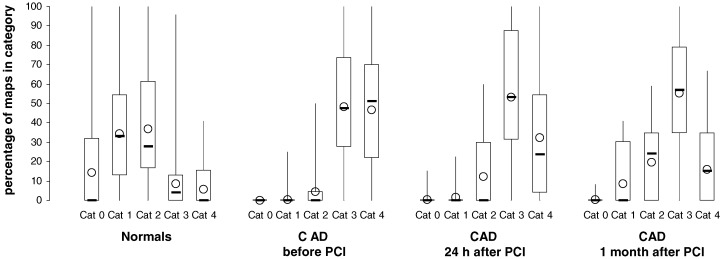
Percentage of CDV maps in the categories 0–4 in normal subjects (n = 57) as well as in patients with coronary artery disease before (n = 50), 24 hours after (n = 46), and 1 month after (n = 25) percutaneous coronary intervention (PCI). Boxplots showing minimum, 1st quartile, median (−), 3rd quartile, and maximum values as well as the mean value (O); cat = category.
In the CAD subjects, no substantial differences could be found in the ECGs obtained 24 hours after PCI. With respect to MCG, more maps were classified as category 2 (P = 0.0201) and fewer maps as category 4 (P = 0.0028) compared to the pre‐intervention registration (Fig. 5). One month after PCI, ca. 50% of the CAD patients were reexamined and the results of the CDV map analysis had become more similar to those of healthy subjects with a greater fraction of maps in the categories 1 (P = 0.0264) and 2 (P = 0.0005) and fewer maps of the category 4 (P = 0.0001) (Fig. 5, Table 2). In ECG, there were no obvious changes compared to the pre‐PCI recordings. All CAD patients were asymptomatic at each registration time.
Figure 5.
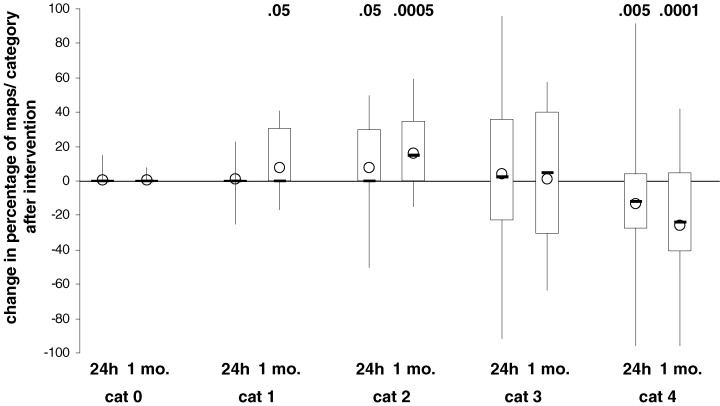
Change in percentage of maps per category in patients with coronary artery disease 24 hours (n = 46) and 1 month (n = 25) after postcoronary intervention. Boxplots showing minimum, 1st quartile, median (−), 3rd quartile, and maximum values as well as the mean value (O); P‐values for differences which deviate significantly from zero are given above the plots; cat = category, mo. = month.
Table 2.
P values Comparing of the Percentage of Maps per Category at Different Registration Times in the Patients with Coronary Artery Disease (CAD) and between Healthy Subjects and Patients 1‐month Postintervention. The Differences were Tested against Zero Using the Wilcoxon Test, P values less than 0.05 in Italic
| Category | CADbefore–24 h (n = 50) | CADbefore–1 month (n = 25) | CAD24 h–1 month (n = 25) | N–CAD1 month (n = 25) |
|---|---|---|---|---|
| 0 | 1.0000 | 1.0000 | 0.0000 | 0.0031 |
| 1 | 0.6243 | 0.0264 | 0.0374 | <0.0005 |
| 2 | 0.0201 | 0.0005 | 0.1927 | 0.0211 |
| 3 | 0.5364 | 0.8967 | 0.5718 | <0.0005 |
| 4 | 0.0028 | 0.0001 | 0.0075 | 0.0135 |
CADbefore= patients with coronary artery disease before coronary intervention; CAD24= patients with coronary artery disease 24 hours after coronary intervention; CAD1 month= patients with coronary artery disease 1 month after coronary intervention; N = healthy subjects.
DISCUSSION
The present study analyzed cardiac repolarization in healthy subjects and patients with CAD in the course of PCI under resting conditions on the basis of a four‐channel MCG system in an unshielded environment. The number of studies dealing with the application of MCG for the detection of myocardial ischemia at rest is still limited. On the basis of a 37‐channel system CAD patients could be identified at rest because of their increased heterogeneity of repolarization as revealed by temporal and spatial changes of QT dispersion. 13 In another approach the analysis of current dipole parameters displayed differences between normals and CAD patients with and without myocardial infarction. 15 Using a 64‐channel system Sato et al. 17 applied iso‐integral mapping for the visualization of current distribution in healthy subjects and CAD patients whereby the latter revealed obvious differences to the healthy subjects. On the basis of a single‐channel system used in an unshielded setting we were able to show that the distribution of the different CDV map classes in CAD patients diverged from that of healthy subjects at rest. 19 These results could be confirmed in the present study. Using a graded classification system with a scale form 0 to 4, the differences between healthy subjects and CAD patients before PCI were statistically significant for each category with more maps of the categories 0, 1, and 2 in healthy subjects whereas CDV maps classified as category 3 and 4 were more often found in CAD patients.
In the patient group after intervention evaluation of the ECG remained essentially unchanged whereas the MCG based map classification revealed different results: there was no change in the percentage of the categories 0, 1, and 3 but the part of maps belonging to the category 2 had increased while the number of maps classified as category 4 had decreased. This trend was more obvious after 1 month with a further reduction of maps of the category 4 and a further increase in the number of those classified as 1 and 2. Again, ECG revealed no obvious changes. This time delay in the change of CDV map distribution toward a normal pattern as we could see in healthy subjects could be explained by stunned myocardium. This term describes the postischemic condition of the myocardium, when perfusion is restored but the mechanical recovery is still delayed. 24 The mechanism responsible for stunning has not been elucidated definitively. 25 Metabolic abnormalities have been detected in stunned myocardium and implicated in its pathogenesis. Stunning may occur in the globally as well as in the regionally ischemic heart. 26 , 27 On this background, the first registration of MCG 24 hours after PCI would be too early to expect a total recovery of the magnetic field distribution. With a time delay of 1 month the mechanical as well as the electrical, respectively, magnetic activity should have restored if the myocardial tissue was not irreversibly injured. The gradual improvement in the distribution of the different CDV map classes in CAD patients 1 month after PCI toward a healthy pattern without a complete adjustment could be explained by the fact that a prolonged myocardial ischemia might lead on molecular basis to a mixture of necrotic and stunned tissue. In this case, circumscribed necrotic areas not large enough to create a ventricular dysfunction would be responsible for the persisting deviations of CDV map distribution in CAD patients 1 month after successful PCI. 27
Comparable to body surface potential mapping, MCG registers cardiac activity at more pre‐thoracic sites compared to 12‐lead ECG and thus, seems to be able to detect very early signs of myocardial ischemia. However, in contrast to the registration of electrical activity on the basis of ECG or BSPM, MCG is sensitive to vortex and tangential currents. 28 This may help to explain the fact that CAD patients with normal left ventricular function reveal differences in their CDV map distribution under resting conditions even in case of a normal 12‐lead ECG. Following this line of thought, the gradual but not complete change in CDV map distribution after PCI toward a normal pattern could be plausible if we presume, beside isolated necrotic tissue, an incomplete restoration of perfusion, possibly in small side branches of the coronary arteries after successful PCI. In this case, a very sensitive method for the early detection of myocardial ischemia would also identify persisting minor ischemic changes after successful intervention. This line of reasoning can only be confirmed if the CDV map distribution returns to the pre‐PCI pattern in those patients who later develop a relevant restenosis. In our data, these results are still pending as all patients were asymptomatic at both post‐PCI registration times. On the other hand, as we know from other studies, a substantial number of patients remain asymptomatic even in the case of angiographically documented restenosis. 29 Therefore, different reasons might be responsible for the persisting differences between CAD patients 1 month after PCI and healthy subjects: a delayed magnetic recovery due to stunned myocardium, isolated irreversible injured tissue, or the development of restenosis. The latter would be less probable as, in general, 4 weeks should be too early for the occurrence of an in‐stent restenosis. Furthermore, it may also be possible that, in patients with multiple vessel disease, the untreated lesions would restrict normal coronary flow.
Independent of the underlying reasons for the deviations in MCG compared to 12‐lead ECG, the method seems to be suitable for the detection of electrophysiological changes in the course of PCI. In order to comprehensively assess the value of MCG in this context, data of patients who have developed a hemodynamically relevant restenosis will be comprehensively.
The fact that the CDV of CAD patients before PCI, registered at rest, reveal obvious differences compared to those of healthy subjects should be encouraging with respect to the potential of MCG for the detection of a hemodynamically relevant restenosis.
This study is limited for several reasons. Beside the small population size, especially at 1 month after PCI, the main limitation is the data analysis itself as the predictive value of the method has not been evaluated. Differences between CAD patients and normal subjects are obvious but it will require further research to permit the interpretation of a single measurement as being normal or pathological with reasonable probability. The scoring system depends to some degree on the experience of the observers, with the need for a training procedure. Thus, the implementation of an automatic categorization procedure according to the described criteria should improve this aspect.
Applying MCG in an unshielded environment still involves loss of signal quality and this will affect not only the acquisition success rate but also the information content of the acquired MCG. On the other hand, improvements in system design and construction as well as more efficient signal processing will help increase the success rate in the future. Furthermore, the use of unshielded systems has definite financial advantages with respect to equipment costs, with a range likely to be comparable to high quality echocardiography systems.
A more comprehensive understanding of the role of the magnetic versus the electric fields generated by the heart under the conditions examined here would be possible with simultaneous BSPM. This was not done in this study as BSPM is presently not available in our clinical setting. Also the primary emphasis was on the comparison of unshielded MCG and standard clinical ECG practice. In this we were able to show first variations of magnetic field maps in CAD patients in the course of successful PCI using a four‐channel system in an unshielded setting. The further follow‐up of these patients, including those who develop relevant restenosis, will aid in the assessment of MCG as a fast and completely noninvasive method for the detection of restenosis after PCI.
Acknowledgments
Acknowledgment: We would like to thank Silke Lange for her helpful comments and statistical support.
REFERENCES
- 1. Teirstein PS. Living the dream of no restenosis. Circulation 2001;104: 1996–1998. [PubMed] [Google Scholar]
- 2. Bittl JA. Advances in coronary angioplasty. N Engl J Med 1996;335: 1290–1302. [DOI] [PubMed] [Google Scholar]
- 3. Block PC. Restenosis after percutaneous transluminal coronary angioplasty—anatomic and pathophysiological mechanisms: Strategies for prevention. Circulation 1990;81(Suppl. IV):IV‐2–IV‐4. [PubMed] [Google Scholar]
- 4. Detry JR, Kapita BM, Cosyns J, et al Diagnostic value of history and maximal exercise electrocardiography in men and women suspected for coronary artery disease. Circulation 1977;56: 756–761. [DOI] [PubMed] [Google Scholar]
- 5. Arruda‐Olson AM, Juracan EM, Mahoney DW, et al Prognostic value of exercise echocardiography in 5.798 patients: Is there a gender difference? J Am Coll Cardiol 2002;39: 625–663.DOI: 10.1016/S0735-1097(01)01801-0 [DOI] [PubMed] [Google Scholar]
- 6. DePuey EG. Myocardial perfusion imaging with thallium‐201 to evaluate patients before and after percutaneous transluminal coronary angioplasty. Circulation 1997;96: 2785–2788. [PubMed] [Google Scholar]
- 7. Honan MD, Bengtson JR, Pryor DB. Exercise treadmill testing is a poor predictor of anatomic restenosis after angioplasty for acute myocardial infarction. Circulation 1989;80: 1585–1595. [DOI] [PubMed] [Google Scholar]
- 8. Pump H, Möhlenkamp S, Sehnert CA, et al Coronary arterial stent patency: Assessment with electron‐beam CT. Radiology 2000;214: 447–452. [DOI] [PubMed] [Google Scholar]
- 9. Hundley WG, Hillis D, Hamilton CA, et al Assessment of coronary arterial restenosis with phase‐contrast magnetic resonance imaging measurements of coronary flow reserve. Circulation 2000;101: 2375–2384. [DOI] [PubMed] [Google Scholar]
- 10. Achenbach S, Moshage W, Bachmann K. Detection of high‐grade restenosis after PTCA using contrast‐enhanced electron beam CT. Circulation 1997;96: 2785–2788. [DOI] [PubMed] [Google Scholar]
- 11. Stilli D, Musso E, Macchi E, et al Body surface potential mapping in ischemic patients with normal resting ECG. Can J Cardiol 1986;Suppl A: 107A–112A. [PubMed] [Google Scholar]
- 12. Kittnar O, Slavicek J, Vavrova M. Repolarization pattern of body surface potential maps (BSPM) in coronary artery disease. Physiol Res 1993;42: 123. [PubMed] [Google Scholar]
- 13. Hailer B, Van Leeuwen P, Lange S, et al Coronary artery disease may alter the spatial dispersion of QT interval at rest. Ann Noninvasive Electrocardiol 1999;4(3):267–273. [Google Scholar]
- 14. Van Leeuwen P, Hailer B, Lange S, et al Spatial and temporal changes during the QT‐interval in the magnetic field of patients with coronary artery disease. Biomed Tech 1999;2(Suppl. 44):139–142. [Google Scholar]
- 15. Van Leeuwen P, Hailer B, Wehr M. Changes in current dipole parameters in patients with coronary artery disease with and without myocardial infarction. Biomed Tech 1997;42(1):132–135. [Google Scholar]
- 16. Adams A, Stroink G, Van Leeuwen P, et al KLT‐analysis of QRST integral maps of patients with and without coronary artery disease In Yoshimoto T, Kotani M, Kuriki S, Karibe H, Nakasato N. (eds.): Recent Advances in Biomagnetism. Sendai , Tohoku University Press, 1999, pp. 1014–1017. [Google Scholar]
- 17. Sato M, Terada J, Mitsui T, et al Detection of myocardial ischemia by magnetocardiography using a 64‐channel SQUID system. In Biomag2000. Proceedings of the 12th International Conference on Biomagnetism, Nenonen J, Ilmoniemi RJ, Katila T.(eds.): ( Helsinki, University of Technology , Espoo , Finland ), 2001, pp. 523–526.
- 18. Hänninen H, Takala P, Mäkijärvi M, et al Detection of in exercise‐induced myocardial ischemia by multichannel magnetocardiography in single vessel coronary artery disease. Ann Noninvasive Electrocardiol 2000;5(2):147–157. [Google Scholar]
- 19. Hailer B, Chaikovsky I, Auth‐Eisernitz S, et al Magnetocardiography in coronary artery disease with a new system in an unshielded setting. Clin Cardiol 2003;26: 465–471. [DOI] [PMC free article] [PubMed] [Google Scholar]
- 20. Oppelt A, Scholz B, Schneider S. Physical principles of biomagnetism In Biomagnetism: Principles, Models and Clinical Research. Proceedings of the Opening Symposium of the Biomagnetic Center Erlangen, Verlag Palm & Enke, Erlangen , 1992, pp. 1–10. [Google Scholar]
- 21. Romanovych S, Steinberg F, Sosnitsky V, et al Imaging of heart biomagnetic sources by current lines in a plane using the magnetic moments method. Proceedings of the EMBEC 1999;410–411.
- 22. Romanovych S. Reconstruction of three components dipoles within layer. Biomed Tech 1997;42(1):227–230. [Google Scholar]
- 23. Nenonen J. Solving the inverse problem in magnetocardiography. IEEE Eng Med Biol 1994: 487–496. [Google Scholar]
- 24. Braunwald E, Kloner RA. The stunned myocardium: Prolonged postischemic ventricular dysfunction. Circulation 1982;66: 1146–1152. [DOI] [PubMed] [Google Scholar]
- 25. Marban E. Myocardial stunning and hibernation: The physiology behind the colloquialisms. Circulation 1991;83: 681–689. [DOI] [PubMed] [Google Scholar]
- 26. Kloner RA, Przyklenk K. Stunned and hibernating myocardium. Anna Rev Med 1991;42: 1–8.DOI: 10.1146/annurev.me.42.020191.000245 [DOI] [PubMed] [Google Scholar]
- 27. Kloner RA, Przyklenk K, Patel B. Altered myocardial states: The stunned and hibernating myocardium. Am J Med 1989;86(Suppl. 1A):14–21.DOI: 10.1016/0002-9343(89)90005-3 [DOI] [PubMed] [Google Scholar]
- 28. Koch H, Haberkorn W. Magnetic field mapping of cardiac electrophysiological function. Philos Trans R Soc Lond 2001;359: 1287–1298. [Google Scholar]
- 29. Ruygrok PN, Webster MWI, De Valk V, et al Clinical and angiographic factors associated with asymptomatic restenosis after percutaneous coronary intervention. Circulation 2001;104: 2289–2294. [DOI] [PubMed] [Google Scholar]


