Abstract
Background: Extraction of the weak electrical activity of the “His Bundle” (HB) by noninvasive methods has not been very successful in the past. The study reassesses the use of signal averaged magnetocardiography (SAMCG), overcoming some of the limitations in earlier studies including in the signal averaging methodology.
Methods: SAMCG on healthy subjects (14 male and 1 female) were performed using R‐peak as the fiducial point in all cases and also using QRS‐onset as the fiducial point in select cases.
Results: A conspicuous feature (H) with a magnitude up to 200 femto Tesla (fT) attributed to the HB activity was observed in the PR segment at several spatial positions on the thorax, with onset at 35–50 ms before the QRS‐onset (V) in 15 out of 18 trials constituting 83% of cases studied. The QRS‐onset as the fiducial point resolved the feature better compared to the conventionally used R‐peak, especially in trials exhibiting spread in heart rate (HR). This is attributed to the fluctuations in QonRD (the time interval between QRS‐onset and R‐peak) compared to the temporal stability of the H‐V duration.
Conclusions: SAMCG reveals a well‐resolved H feature. The double hump morphology of the feature extended at least up to a frequency of 150 Hz. The importance of the choice of QRS‐onset as the fiducial point is unequivocally demonstrated, illustrated by measurements on subjects exhibiting considerable heart rate variability. The latter has a general validity and should be applicable to SAECG as well.
Keywords: His bundle magnetic field, SAMCG, fiducial point, heart rate variability, H‐V duration
Noninvasive surface recordings of the HB electrical activity have been made using both signal averaged electrocardiography (SAECG) 1 , 2 , 3 , 4 , 5 , 6 , 7 , 8 and magnetocardiography (SAMCG). 9 , 10 , 11 , 12 A common methodology is the averaging over many cardiac cycles to reduce the random noise components and artifacts that are uncorrelated with reference to a chosen fiducial point in the cardiac cycle. In a SAECG study on dogs, 1 a region designated “G Complex” was observed in the PR segment, whose onset was almost synchronous with the HB deflection seen in a corroborative EP. The G complex consistently retained its morphology and maintained temporal constancy to the QRS‐onset even when the pacing rates of the heart were varied widely. The limitations of SAECG in extracting the H features, such as overlapping atrial contribution, signal attenuation and distortion, effect of filtering etc. have been discussed in the literature and also their results have been compared to invasive intracardiac measurements; the need to evaluate the beat to beat temporal stability of the fiducial point with respect to the feature of interest has also been pointed out. 4 , 6 The overall success in recovering the HB activity from body surface potential studies has been assessed by different workers to be in the region of 33–100%. 8 However, a common feature in these studies is the use of the R wave peak 9 , 12 or the rising slope of the QRS complex 1 , 2 , 3 , 4 , 5 , 6 , 7 , 10 , 11 as the fiducial point for averaging. Use of an external trigger from an atrial pacing stimulator as the fiducial reference has also been reported. 1 , 2 Although the temporal constancy of the interval between HB activity and V was unambiguously demonstrated, 1 it has not received due attention as studies largely continued to use the R wave as the fiducial reference, possibly because of the ease of its identification. Nevertheless, in view of the dependence of the R wave on physiological factors like respiration, heart rate, posture etc., the possibility of the use of the QRS‐onset as the fiducial point has been recognised for improving the quality of the signal averaging for extracting the His bundle feature. 8
Magnetocardiography (MCG) is a noncontact technique and, unlike the ECG, the signals are not much influenced by the conductivity profile of the intervening tissues leading to the possibility of greater accuracy in source localization. 13 An MCG study 9 showed a characteristic ramp pattern starting approximately 40 ms before the QRS‐onset, which was attributed to the physiological activity of the whole of the His Purkinje System. This measurement was performed in a magnetically unshielded environment and consequently limited to a 100 Hz bandwidth using a low pass filter. The ramp pattern was observed at several positions over the thorax and showed a characteristic symmetry in 4 of 10 subjects but did not reveal any resolved feature in the PR segment that may be ascribed exclusively to the HB activity. A later MCG study 10 carried out inside a magnetically shielded room showed bump‐like structures riding over the ramp in the PR segment in 10 of 32 subjects. Another study 11 employing an radiofrequency (RF)‐SQUID with a second order gradiometer in a magnetically unshielded environment and using a limited bandwidth of 100 Hz, could distinguish characteristic dipolar patterns at the instants corresponding to the atrial depolarization, atrial repolarization, His Purkinje activation and the early septal activation through magnetic field maps in 14 of the 17 subjects studied. A more recent study 12 using a magnetically shielded room detected spiked features attributed to the HB activity, as corroborated by EP studies, in 14 of 22 patients with various types of conduction anomalies. Such features were observed at a maximum of only two channels (locations) in measurements with a 64 channel system; however, in this study,12 the distance between the chest wall and the SQUID sensor was about 4.5 cm (Ref. 12) which is rather large, considering the very weak magnetic field (∼100 fT) associated with the HB activity.
This study takes into account some of the limitations of earlier investigations and is an improvement in several respects. The study is conducted inside a magnetically shielded room using a measurement set‐up that permitted a low stand‐off distance of about 15 mm between the sensing loop of the SQUID sensors and the chest wall of subjects. This considerably improved the signal to noise ratio and enabled the use of a higher band width of 300 Hz during the MCG recording which is considered more appropriate to this type of investigation. 8
The study points out the inadequacy of the conventionally used R‐peak as the fiducial point for signal averaging, and has shown that a conspicuous, robust and well‐resolved feature attributable to the His bundle activity could be extracted using the QRS‐onset as the fiducial point.
MATERIALS AND METHODS
Experimental and Methodology
The MCG system consisted of niobium based superconducting quantum interference device (SQUID) sensors operated inside a two layer magnetically shielded room, capable of attenuating external noise by 70 dB at 1Hz, extending to 110 dB at 100 Hz and beyond. Two different systems (4 channels and 13 channels), comprising flat bottomed fiber reinforced plastic cryostats with an array of direct current (DC)‐SQUID sensors coupled to first order axial gradiometers of 15 mm loop diameter and 50 mm baseline were used in this study. The typical noise floor was 9 fT/sqrt(Hz) in all the channels. The output voltages of all the channels were simultaneously sampled at a rate of 1 kHz, and digitized with a resolution of 24 bits. The intersensor spacing was 42 mm for the 4 channel system 14 and 28 mm for the 13 channel system. 15
The first set of experiments was carried out with the four channel system on nine normal subjects with no known adverse medical history and one subject diagnosed with a first degree AV Block (all males). The MCG recordings were made over the thorax on a square grid of 36 equispaced positions, sequentially in a total of 9 configurations, each configuration simultaneously measuring the magnetic fields at four spatial locations. The cardiac cycles were recorded for 120 seconds at each position. To study the influence of the variation in the heart rate on the temporal stability of the chosen fiducial point in the cardiac cycle, especially in the context of extracting the very small feature due to HB activity, eight trials were made subsequently with the 13‐channel system that simultaneously recorded cardiac activity at 13 different spatial locations over the thorax. These are designated as heart rate variability (HRV) studies. In this case, the MCG recordings were carried out for each subject at only one configuration (at 13 spatial positions) on the left anterior thorax that included the anatomical position of the HB. A total of five healthy subjects (4 male and 1 female) were used in these measurements. To analyze the intrasubject variations, measurements were carried out on one of the subjects on four different days, in the rest condition (two trials) and with the legs in moderate cycling motion in the supine position (two trials) where the subject was asked to mimic the pedaling action of a bicycle rider while lying under the cryostat. The following variables were determined for each trial in the HRV studies: heart rate and its variability, time instants for QRS‐onset and the R‐peak, and the QRS‐onset to R‐peak duration (QonRD).
MCG Signal Processing
The time series data were decomposed by the application of wavelet transform (Wavelet tool box‐Version 4.8, The MathWorks Inc, Natick, MA, USA) to resolve the higher and lower frequency components. The Daubechies (db10) wavelet was used with an appropriate (user selectable) level of decomposition, such that the contribution of the breathing artifact (usually around 15 cycles per minute) and other lower frequency fluctuations resulting from subject movements could be identified and subtracted. Similarly, the wavelet coefficient terms representing the power line interferences and its harmonics were suppressed while reconstructing the denoised MCG data through the inverse wavelet transform. The thus denoised data were subsequently smoothed with a moving average finite impulse response (FIR) filter which replaces every data point with an average of three adjacent neighboring points. This type of running average is performed for the data sets in all the channels to smooth out short term fluctuations (1–3 ms for the 1 kHz sampling rate used). For this study, three point smoothing was found to be optimal; increasing the number of points for adjacent point averaging resulted in oversmoothing the data and a progressive reduction in the bandwidth. These were verified by comparing the fast Fourier transform (FFT) spectra of raw and smoothed data to ensure that the resulting reduction in bandwidth from that used in the measurement (0–300 Hz), would not impair the extraction of the signal of interest. The smoothed data, representing a large number of cardiac cycles recorded at a particular position on the thorax was then epoched and averaged using the R‐peak as the fiducial point. The R wave peak was identified in the unaveraged MCG trace by an automated peak detection algorithm in a channel where the peak was most prominent, after adjusting a threshold parameter suitably to ensure that a noise spike was not misconstrued as the R‐peak. This process of wavelet denoising and the adjacent point smoothing, followed by epoching and averaging ensures a considerable reduction of random noise while preserving the frequency components of the signal of interest. The alignment accuracy of the algorithm was specifically tested in one trial by increasing the sampling rate from the usual value of 1 kHz to a higher value of 5 kHz and the observed standard deviation was ± 0.780 ms, in about 100 cycles.
In the HRV studies, the MCG time traces were similarly preprocessed and subsequently epoched and averaged initially based on the R‐peak, and subsequently based on the QRS‐onset as fiducial points and the results were compared. The position of the QRS‐onset was detected manually from a channel where it was most prominent as the onset of the downward deflection due to the Q wave, based on the visual appearance in the unaveraged MCG trace.
RESULTS
His Bundle Activity—General Features
A representative SAMCG trace indicating the PR segment contained in the PR interval, which is the region of interest in this study, is shown in Figure 1. The PR segments measured (in a total of 18 trials on 15 subjects) always contained a ramp structure although with differing slopes across the spatial locations over the thorax as reported in earlier studies. 9 , 10 , 11 , Figure 2 depicts the spatial distribution of the PR segment of a subject in the left sternal region. In addition to the ramp structure, an overriding hump‐like feature, designated, “H” is clearly seen. “H” is attributed in this study to the HB activity for the following reasons:
Figure 1.
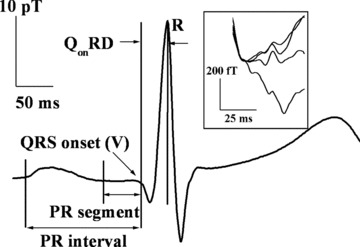
A typical MCG trace measured for a subject (ID #12 in Table 1). The inset shows an enlarged view of the PR segments (contained in the PR intervals) at four different spatial locations on the thorax. It may be noted that the PR segments can appear with vastly differing slopes. Several parameters used in the text are illustrated.
Figure 2.
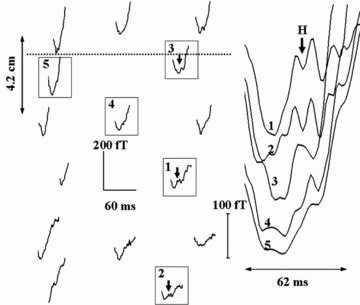
SAMCG traces of the PR segment of a subject (ID #6 in Table 1) at several locations on the thorax with reference to the line joining the nipples (shown as dotted line). The traces highlighted by boxes are shown enlarged on the right. The deflections attributed to His bundle activity (marked H) can be seen riding on ramp structures.
-
1
It is known 1 , 2 , 3 , 4 , 5 , 6 , 7 , 8 , 9 , 10 , 11 , 12 that the His bundle activity occurs in the PR segment. The known contributions to the feature in the PR segment come from (i) atrial repolarization and (ii) His bundle activity. Sometimes, the activity of the bundle branches is also seen. 8 The atrial repolarization is known to be characterized 16 , 17 by a slowly varying signal, oppositely directed to the P‐wave, with an amplitude about a third of the P‐wave, quite unlike the prominent hump in the PR segment. The contribution of the bundle branches are infrequently seen and occur much closer to the QRS‐onset. 8
-
2
The observed feature H, survives and becomes progressively robust as the number of cardiac cycles taken for averaging is increased from 16 to 256, as shown in Figure 3. This is a reasonable test usually done to ensure that the observed feature has its origin in a physiological process since random noise components have a tendency to get smeared out on increasing the number of cycles averaged and eventually disappear. 1 , 6 , 7 The observed amplitude of the deflection associated with the feature is markedly high (upto 200 fT) compared to the system noise floor of under 10 fT/sqrt(Hz).
-
3
Figure 4 shows the H feature observed on a subject previously diagnosed with a first degree AV Block characterized by a prolonged PR interval of 214 ms (PR segment of 115 ms; see Table 1) along with that of a normal subject with the PR interval of 144 ms (PR segment of 65 ms). In both the cases, the feature attributed to H occurs with nearly the same H‐V duration in conformity with an earlier study on His bundle activity 1 over a range of heart rates (and consequently the PR intervals). In most of the total of 18 trials carried out, summarized in Table 1, the onset of H occurs at 35–51 ms before the QRS‐onset (H‐V time) in conformity with other investigations of HB activity 1 , 2 , 3 , 4 , 5 , 6 , 7 , 8 , 9 , 10 , 11 , 12 and lasts for a duration3 typically in the range of 8–18 ms but is more spread out in some cases.
Figure 3.
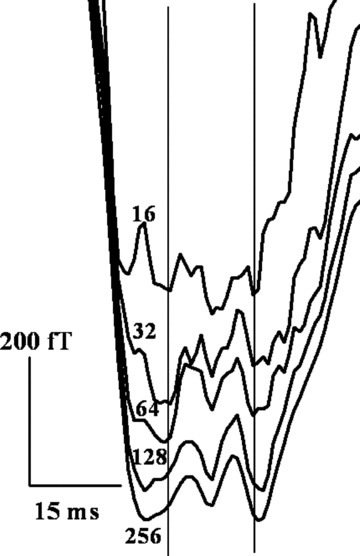
Survival of the measured H features of a subject (ID #15 in Table 1) at a spatial location with increase in the number of cardiac cycles averaged from 16 to 256. The vertical lines encompass the His bundle feature, based on visual judgment.
Figure 4.
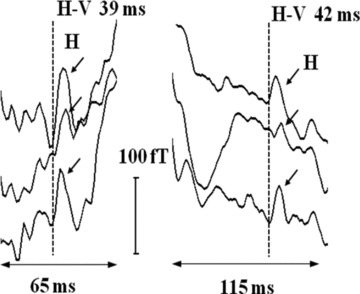
Left: H deflections (marked by arrows) in the PR segments at three different spatial positions of a normal subject (ID #7 in Table 1). Right: for the subject (ID #8 in Table 1) with a first degree AV block. H‐V interval is nearly the same despite large variation in the PR segments (and the PR intervals as shown in Table 1). The onset of H deflections is marked with dotted vertical lines.
Table 1.
Characteristics of Measured His Bundle Feature
| Subject Details | H‐V Duration (ms) | H Duration (ms) | Mean PR Segment (ms) | Mean PR Interval (ms) |
|---|---|---|---|---|
| #1, M61a | 42b | 24 | 58 | 132 |
| #2, F25a | 49b | 24 | 81 | 188 |
| #3, M43a | 33c | 10 | 70 | 161 |
| #4, M29a | 51d | 13 | 62 | 167 |
| #5A, M29a | 42e | 12 | 60 | 177 |
| #5B, M29a | 39b | 12 | 43 | 135 |
| #5C, M29a | 42b | 18 | 44 | 158 |
| #5D, M29a | 42d | 18 | 52 | 145 |
| #6, M25 | 43 | 15 | 61 | 143 |
| #7, M27 | 39 | 8 | 65 | 144 |
| #8, M63 | 42 | 13 | 115 | 214f |
| #9, M27 | 30c | 11 | 46 | 143 |
| #10, M28 | 26c | 8 | 47 | 115 |
| #11, M28 | 42 | 16 | 52 | 135 |
| #12, M29 | 35 | 9 | 48 | 140 |
| #13, M27 | 38 | 12 | 44 | 134 |
| #14, M28 | 46 | 11 | 52 | 164 |
| #15, M28 | 39 | 11 | 44 | 136 |
aSubject IDs constituting HRV studies described in the text.
bH feature seen but observed more resolved in QRS‐onset based averaging.
cH‐V durations are much lower than the average; H designation may not be unambiguous, because of the possible contribution from bundle branch activity. 8
dBoth the averaging methodologies resolve H feature with relatively equal clarity.
eH feature seen only in the QRS‐onset based averaging.
fDiagnosed previously with a first degree A‐V block.
Summarizing, the hump‐like feature seen in this study can be identified with the activity of the His Bundle. This feature is clear, consistent, conspicuous and well resolved compared to the features attributed to the HB activity in earlier studies, 10 , 12 one of which 12 has been independently corroborated on the basis of invasive EP.
H is prominent only at a few spatial locations on the chest (maximum of 200 fT on the thoracic surface) and decreases to below the limit of detection farther away. The dispersion in the morphology of the H feature at different spatial locations (Fig. 2) may in part be due to the nature of the baseline of the ramp at that location as well as to the strength of the observed magnetic field, away from the source.
Choice of Fiducial Point Heart Rate Variability
The cardiac rhythm is inevitably modulated by both the sympathetic and the parasympathetic branches of the autonomic nervous system (ANS). The response elicited during a sympathetic activation (e.g., physical exercise) is slower whereas that elicited during a parasympathetic activation (e.g., breathing) is faster. 18 Specific SAECG studies 19 , 20 on healthy subjects have revealed that the increased sympathetic tone or decreased parasympathetic tone or both tend to enhance the ventricular conduction velocity manifested by the reduction of the QRS duration even during some of the daily routine activities. This has also reflected 20 in the durations of the individual components of the QRS complex. Figure 5 shows the beat to beat fluctuations of the heart rate as well as of the parameter QonRD (defined in Fig. 1), measured in this study, for a subject engaged in mild exercise (sympathetic dominance). QonRD shows fluctuations in the segments where the HRV is high. This implies that the R‐peak does not always maintain temporal stability with respect to the H and therefore, cannot be taken as a reliable fiducial point for averaging, especially when there are fluctuations in the HR.
Figure 5.
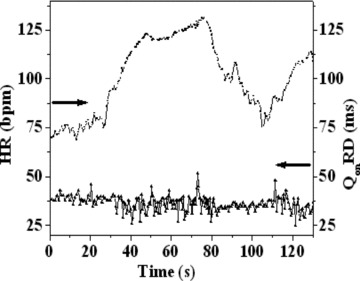
HRV and QonRD of a subject (ID #5C in Table 1) during a moderate cycling exercise in supine position.
It is known that the H‐V duration is usually not influenced by the dynamics of the autonomic control over the heart rate 1 , 21 unlike the other components that follow the activation of the HB, namely, the QRS complex and the T‐wave. Thus, it is clear that in the context of the averaging methodology in extracting the HB activity, the use of QRS‐onset (or V) as the fiducial point is more appropriate compared to the R‐peak or the rising slope of the R‐wave that have been conventionally used in the past by other research groups.
Table 1 also shows the measurements of the HRV studies of eight trials made on five subjects with IDs #1 to #5. This includes four trials made on a single subject (while at rest, IDs #5A and #5D and in exercise condition, #5B and #5C). In all these trials (Subject ID #3 is excluded, as indicated in footnote of Table 1), the MCG traces are averaged using both the methodologies, with (1) the R‐peak and (2) the QRS‐onset as fiducial points. Figure 6 depicts the histograms of the beat to beat HR for all these subjects. Subjects with IDs #4 and #5D, have a narrow spread in HR while the others have significantly larger spreads. As indicated earlier, the parameter QonRD reflects these variations (not shown). It stands to reason that when the spreads in HR and QonRD are small, the R‐peak or for that matter any other prominent feature of the cardiac cycle should serve equally well as a fiducial point for averaging for the extraction of H, in the absence of other physiological factors. This is borne out for the subject IDs #4 and #5D where the averaging based on both the R‐peak as well as the QRS‐onset as fiducial point shows the H feature with equal clarity. In the other cases with larger spreads in HR, (IDs #1, 2, 5A, 5B, and 5C), this study reveals conspicuously resolved H features in the QRS‐onset based averaging as against the R‐peak based averaging. Indeed, in the case of ID #5A, the R‐peak based averaging does not show any discernible H feature at all.
Figure 6.
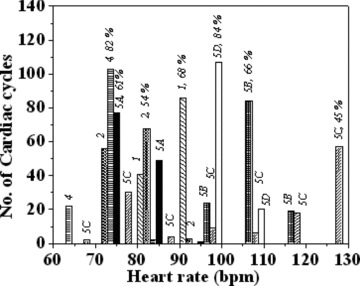
Overall histograms of beat to beat HR of all subject IDs pertaining to HRV studies listed in Table 1, showing the distribution of the heart rates for each case. The numbers on top of the bars represent the subject IDs and the percentage of the cardiac cycles corresponding to the dominant bar, for each ID.
DISCUSSION
Comparison of the Two Averaging Methodologies over a Range of Heart Rates
The analysis of the reasons for the nondiscernability of the H feature in the R‐peak based averaging for the subject ID #5A is quite revealing. Figure 7(a) shows the HR versus time in the measurement duration of 120 seconds where parasympathetic and sympathetic regimes are evident in distinct time intervals marked “1” and “2,” respectively. In each regime, the PR segments are averaged separately, with both the R‐peak and the QRS‐onset as the fiducial points. Such averaged traces at three different spatial positions are shown in Figure 7(b) and (c). In the time intervals 10–25 seconds and 100–120 seconds, HR exhibits oscillations pertaining to the breathing rate of about 19 cycles per minute, indicating parasympathetic dominance. In this case, both the averaging modalities show the H feature equally well (Fig. 7b). In the time intervals, 0–10 seconds and 50–90 seconds, the HR shows large swings of an enveloping lower frequency, characteristic of sympathetic dominance. In this case, the H feature is revealed well resolved in the QRS‐onset based averaging while the R‐peak based averaging shows only a smeared out feature (Fig. 7c). It is to be noted that the H feature corresponding to the QRS‐onset based averaging in Figure 7(c) represents the average of higher number of cardiac cycles (80 cycles) and shows a higher resolution, as compared to the corresponding feature in Figure 7(b) (47 cycles). Such analysis is generally applicable leading to the conclusion that the QRS‐based averaging reveals more resolved H feature in cases with a large spread in HR (shown in the HR histogram in Fig. 6) that are governed by sympathetic dominance, compared to the R‐peak based averaging.
Figure 7.
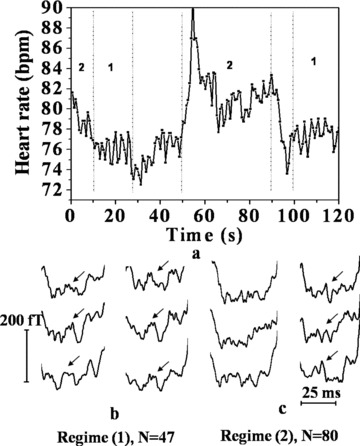
(a) Heart rate versus time for subject (ID # 5A in Table 1); (b) the PR segments at three spatial positions with both the QRS‐onset based (right) and R‐peak based (left) averaging methodologies, in the regimes marked 1 in (a), inferred to be parasympathetically dominated. (c) The corresponding traces with for the regimes marked 2 in (a), inferred to be sympathetically dominated.
Morphology and the Frequency Characteristics of the HB Activity
The morphology and the temporal stability of the observed H feature obtained by using the averaging methodologies based on two different fiducial points are further compared for subject ID #5A. The PR segments averaged over a number of cardiac cycles recorded simultaneously at 13 spatial positions on the thorax are grand averaged using both the R‐peak and QRS‐onset as fiducial references, with a view to compare the temporal synchrony of the H feature inferred using the two averaging methodologies. As shown in Figure 8, distinct and clearly resolved hump‐like “M” shaped feature survives in the grand average in the case of QRS‐onset based averaging, whereas the H feature smears out in the R‐peak based averaging. This procedure, besides reflecting the temporal synchrony of the observed H feature at 13 different locations, also reveals its representative morphology.
Figure 8.
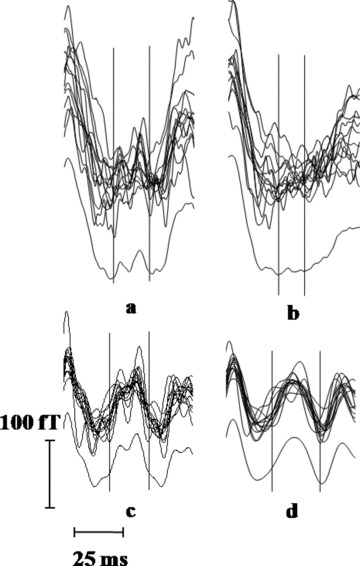
(a) Averaged PR segments at 13 spatial locations and their grand average for the QRS‐onset based averaging; (b) corresponding traces for the R‐peak based averaging; traces in (a) subjected to band pass filter (c) 30–150 Hz; (d) 30–100 Hz. The vertical lines in all the plots encompass the H feature, on the basis of visual judgment.
Figure 8 also shows the results of assessment of the frequency content of the inferred H feature. The traces averaged using the QRS‐onset as the fiducial point as well as their grand average were subjected to FIR band pass filter with various band pass frequencies namely (i) 0.5–300 Hz, (ii) 30–300 Hz, (iii) 30–150 Hz, and (iv) 30–100 Hz. The clearest manifestation of the H (hump‐like) feature is obtained for a filter setting of 30–150 Hz, as noise due to high frequency (>150 Hz) and the low frequency (<30 Hz) noise and also the components of the cardiac signals, get filtered out. However, limiting the signal to 100 Hz leads to rounding off of the measured feature. This indicates that the HB activity components extend at least up to 150 Hz; which may explain the inadequacy in some of the earlier studies. 9 , 10 , 11 , 12
Limitations of the Study
Manual identification of the QRS‐onset made in this study, though reliable, could be automated through a suitable algorithm. Corroborative EP studies using invasive intracardiac electrodes is beyond the scope of this study as it is limited to subjects with no known cardiac dysfunction. Nevertheless, it is evident that the identification of the H feature as well as the evaluation of its morphology has been unambiguous and well resolved using signal averaged MCG with QRS‐onset as the fiducial point.
CONCLUSIONS
The signal averaged magnetocardiography could be applied successfully for the noninvasive tracking of the His bundle activity. Out of 18 trials comprising 15 subjects, His bundle feature occurred with H‐V durations in the range 35–50 ms for 15 trials comprising 12 subjects. Based on the known H‐V duration of healthy subjects, this constitutes a high proportion of about 83%. In the remaining three trials, similar feature occurred much closer to the QRS‐onset and the H designation may not be unambiguous. The importance of the QRS‐onset as the fiducial point over the conventionally chosen R‐peak is unequivocally demonstrated. This is particularly evident in cases where there is a large spread in the heart rate over the measurement duration owing to the influence of the autonomic nervous system. The choice of fiducial point has a general validity and should be applicable to SAECG studies as well.
Acknowledgments
Acknowledgments: The work has been carried out as part of a project sponsored by the Department of Science & Technology, Government of India, with the expertise and skills related to the use of SQUID sensors developed over the years in the Department of Atomic Energy, Government of India. It is a pleasure to thank S.C. Chetal, Baldev Raj, C.S. Sundar, and A.K. Arora for encouragement and support.
TSR is supported by the Department of Science & Technology, Government of India; NM is supported by the Department of Atomic Energy, Government of India through a Senior Research Fellowship.
REFERENCES
- 1. Berbari EJ, Lazzara R, Samet P, et al Non‐invasive technique for detection of electrical activity during the P‐R segment. Circulation 1973;48:1005–1013. [DOI] [PubMed] [Google Scholar]
- 2. Flowers NC, Hand RC, Orander PC, et al Surface recording of electrical activity from the region of the bundle of His. Am J Cardiol 1974;33:384–389. [DOI] [PubMed] [Google Scholar]
- 3. Hashimoto Y, Sawayama T. Non‐invasive recording of His bundle potential in man. Br Heart J 1975;37:635–639. [DOI] [PMC free article] [PubMed] [Google Scholar]
- 4. Wajszczuk WJ, Stopczyk MJ, Moskowitz MS, et al Noninvasive recording of His‐Purkinje activity in man by QRS‐triggered signal averaging. Circulation 1978;58:95–102. [DOI] [PubMed] [Google Scholar]
- 5. Berbari EJ, Sherlag BJ, Sherif NE, et al The His‐Purkinje electrocardiogram in man: An initial assessment of its uses and limitations. Circulation 1976;54(2):219–224. [DOI] [PubMed] [Google Scholar]
- 6. Vincent R, Stroud NP, Jenner R, et al Noninvasive recording of electrical activity in the PR segment in man. Br Heart J 1978;40:124–130. [DOI] [PMC free article] [PubMed] [Google Scholar]
- 7. Nojima K, Otsuka K, Otsuka K, et al Non‐invasive recording of His bundle electrograms using vectorial leads system. Clin Cardiol 1985;8(1):11–18. [DOI] [PubMed] [Google Scholar]
- 8. Hombach V, Braun V, Hopp HW, et al The applicability of the signal averaging technique in clinical cardiology. Clin Cardiol 1982;5:107–124. [DOI] [PubMed] [Google Scholar]
- 9. Farrell DE, Tripp JH, Norgren R. Magnetic study of the His‐Purkinje conduction system in man. IEEE Trans Biomed Eng 1980;27(7):345–350. [DOI] [PubMed] [Google Scholar]
- 10. Fenici RR, Romani GL, Erne SN. High‐Resolution Magnetic measurements of human cardiac electrophysiological events. Il Nuovo Cim D 1983;2(2):231–247. [Google Scholar]
- 11. ten Voorde BJ, Peters MJ, Stroink G, et al High‐resolution magnetic mapping of PR‐interval phenomena of normal subjects. Med Biol Eng Comput 1988;26:130–135. [DOI] [PubMed] [Google Scholar]
- 12. Yamada S, Kuga K, Kei On, et al Noninvasive recording of His potential using Magnetocardiograms. Circ J 2003;67:622–624. [DOI] [PubMed] [Google Scholar]
- 13. Koch H. SQUID magnetocardiography: Status and perspectives. IEEE Trans Appl Supercon 2001;11(1):49–59. [Google Scholar]
- 14. Janawadkar MP, Gireesan K, Parasakthi C, et al SQUID based measurements of biomagnetic fields. Curr Sci 2010;99(1):36–45. [Google Scholar]
- 15. Gireesan K, Parasakthi C, Sengottuvel S, et al Establishment of 13 channel SQUID based MEG system for Studies in biomagnetism. Indian J Cryo 2011;36(1–4):169–172. [Google Scholar]
- 16. Ihara Z, van Oosterom A, Hoekema R. Atrial repolarisation as observable during the PQ interval. J Electrocardiol 2006;39:290–297. [DOI] [PubMed] [Google Scholar]
- 17. Holmqvist F, Carlson J, Platonov PG. Detailed ECG analysis of atrial repolarisation in humans. Ann Noninv Electrocardiol 2009;14(1):13–18. [DOI] [PMC free article] [PubMed] [Google Scholar]
- 18. Malik M, Bigger JT, Camm AJ, et al Writing committee of the task force of the European Society of Cardiology and The North American Society of Pacing and Electrophysiology: Heart Rate Variability‐Standards of measurements, physiological interpretation and clinical use. Eur Heart J 1996;17:354–381. [PubMed] [Google Scholar]
- 19. Nakagawa M, Iwao T, Ishida S, et al Circadian rhythm of the signal averaged electrocardiogram and its relation to heart rate variability in healthy subjects. Heart 1998;79:493–496. [DOI] [PMC free article] [PubMed] [Google Scholar]
- 20. Goldberger AL, Bhargava V. Effect of exercise on QRS duration in healthy men: A computer ECG analysis. J Appl Physiol 1983;54(4):1083–1088. [DOI] [PubMed] [Google Scholar]
- 21. Josephson ME. Clinical Cardiac Electrophysiology: Techniques and Interpretations, 4th edition, Philadelphia , Lippincott William and Willikins, 2008, pp. 20–68. [Google Scholar]


