


Abstract
Background: We report the reduction of QT and QTc dispersion in patients treated for 7 years with enalapril for systemic hypertension with left ventricular (LV) hypertrophy. We assess the correlation between QT dispersion and LV mass during this period and at the end of an 8‐week period of suspension of enalapril treatment after 5 years.
Methods: Twenty‐four previously untreated patients with this condition took enalapril (20 mg twice daily) for 7 years, except during an 8‐week period following 5‐year follow‐up. Cardiovascular parameters were determined by two‐dimensional guided M‐mode echocardiography, and QT interval was measured, in a pretreatment placebo phase, 8 weeks and 1, 3, 5, and 7 years after the start of the therapy, at the end of the 8‐week suspension effected after 5 years, and 8 weeks after the end of the suspension.
Results: Therapy rapidly reduced blood pressure (BP) from 156/105 mmHg to normal values: 134/84 mmHg after 8 weeks’ treatment, 130–84 mmHg at 7‐year follow‐up (P < 0.001 with respect to the placebo phase). LV mass index decreased progressively until at 5‐year follow‐up the reduction had reached 39% (P < 0.001), after which neither LV mass nor any other structural parameter underwent any further significant change. During this time, QT dispersion (ΔQT) and the dispersion of “corrected” QT (ΔQTc) decreased significantly: ΔQT (from 61 ± 21 to 37 ± 13 ms) and ΔQTc (from 67 ± 27 to 41 ± 16 ms). After suspension of treatment for 8 weeks following 5‐year follow‐up, ΔQT was 40 ± 14 ms and ΔQTc was 44 ± 17 ms; there were no significant changes either in ΔQT and ΔQTc or LV hypertrophy although BP had returned to pretreatment values (BP: 150 ± 16; 101 ± 10 mmHg).
Conclusions: Long‐term enalapril treatment of hypertensive patients with LV hypertrophy induces marked regression of LV mass and improvement of QT dispersion. These improvements occur on a longer timescale than improvement in BP, and are not affected by transient changes in BP values.
Keywords: hypertension, QT dispersion, left ventricular mass, enalapril
The QT interval is the total electrocardiographically measured duration of ventricular electrical activity, including depolarization and repolarization. QT dispersion (ΔQT) is defined as the difference between the largest and the smallest of the 12 QT values afforded by a 12‐lead electrocardiogram (ECG), and is a measure of regional variation in ventricular repolarization. 1 , 2 As such, ΔQT is believed to be of value for prediction of the risk of ventricular arrhythmias: increased ΔQT has been proposed as a predictor of future arrhythmic events in patients with idiopathic long QT syndrome, 3 previous myocardial infarction, 4 , 5 idiopathic dilated cardiomyopathy, 6 , 7 , 8 hypertrophic cardiomyopathy, 9 electrolyte abnormalities, 10 and chronic exposure to certain drugs. 11 , 12 High ΔQT has also been observed in hypertensives with LV hypertrophy (LVH). However, ΔQT has been questioned as a marker of heterogeneity of repolarization. These authors argue that inhomogeneity of ventricular repolarization could be related to a greater variability in T‐loop morphology (width, amplitude, and axis of T wave) and this could be connected with an increase in ΔQT. 13
In this study, we evaluate the evolution of ΔQT and ΔQTc over 7 years in a group of hypertensives with LVH who were being treated with enalapril. 14 , 15 We found that improvement of QT dispersion largely occurred on a longer timescale than changes in BP, and was closely related to regression of LVH.
METHODS
Patients
We studied a group initially composed of 28 previously untreated hypertensives (20 men and 8 women aged 50 ± 10 years in the range of 35–64 years) who gave their informed consent. All were diagnosed as having essential arterial hypertension on the basis of seated diastolic blood pressure (BPs) between 95 and 114 mmHg in three triplicate measurements over a period of 3 weeks, absence of symptoms, and absence of signs and history of any other cardiovascular disorder.
All the patients took 20 mg of enalapril every 12 hours for 5 years (59 ± 1 months). Only two patients required less than 40 mg/day to achieve normal BP; these two exceptions achieved normal BP with 20 mg/day within 6 weeks treatment, but similar to the others took 40 mg/day thereafter. At that time the treatment was interrupted for 8 weeks, after which it was resumed (the 12‐hourly dose being increased progressively from 2.5 to 20 mg). At their 7‐year check‐up all the patients had normal BPs.
During the 7‐year course of the study (87.1 ± 1.4 months), full clinical histories were obtained, arterial blood pressures were determined, and echocardiography was performed at the following times: after a pretreatment placebo period, at 8 weeks and 1, 3, and 5 years after the commencement of therapy, after the 8‐week suspension of therapy, 8 weeks after the resumption of therapy and 6 years (74.2 ± 1.4 months) and 7 years (87.1 ± 1.4 months) after the commencement of treatment.
Two of the 28 patients abandoned the study in its early stages: one after 2 months because of irritant cough and the other after 4 months due to gastrointestinal problems. Two more were excluded during the 6th year when they were taken off enalapril and put on a calcium antagonist, persistently hypertensive blood pressures (diastolic BPs > 100 mmHg) having failed to respond to the combination of enalapril and a low dose of a thiazide. A fifth patient underwent surgery for breast cancer after enalapril treatment for 4 years, but is still in the study group.
BP Measurements
BP was measured with a mercury sphygmomanometer 12 hours after the latest dose of enalapril. All measurements were made on the same arm. Resting BPs were taken with the patient seated. The values used in subsequent statistical analyses were the means of three measurements taken at intervals of at least 5 minutes, starting 10–15 minutes after the patient had sat down. Systolic BP and diastolic BP were determined during Korotkoff sounds 1 and 5, respectively. Heart rate (beats/min) was determined by palpation of the radial artery for 60 seconds.
Echocardiography
M‐mode echocardiography with a Siemens Sonoline CD echograph and 2.5 MHz transducer was used to measure (in mm) the diastolic thicknesses of the interventricular septum and the posterior wall of the left ventricle, and the diastolic and systolic diameters of the cavity; two‐dimensional images taken from longitudinal or transverse parasternal views were used to insure that all measurements were made at the same level (just above the papillary muscles). The values used in subsequent calculations were the means of four to six measurements made during successive heartbeats. All echocardiographic recordings were made and interpreted by the same cardiologist (J. R. G‐J.), who was ignorant of the treatments of the patients and their participation in this study. The intraobserver coefficients of variation of septal thickness (7.2%), LV wall thickness (6.0%), and diastolic LV diameter (3.1%) were calculated as the medians, over all patients, of the coefficients of variation calculated for each patient, these intrapatient coefficients of variation being calculated as 100 × (the difference between the values measured at the beginning and end of the placebo period/the mean of these two values).
LV mass in grams was calculated, following Devereux and Reichek, 16 as 1.04 × ((diastolic LV diameter + septal thickness + LV wall thickness)3− diastolic LV diameter3) − 13.6; LV mass index as LV mass divided by body surface area in square meters; and relative LV wall thickness as (LV wall thickness + septal thickness)/diastolic LV diameter. LV fractional fiber shortening (%) was calculated as 100 × (diastolic LV diameter − systolic LV diameter)/diastolic LV diameter; circumferential fiber shortening velocity (circ/s) as LV fractional fiber shortening/(100 × ejection time), (LV ejection time in seconds was determined from M‐mode measurements of the aortic root); and LV ejection fraction (%) as 100 × (diastolic LV diameter3− systolic LV diameter3)/diastolic LV diameter.3
Electrocardiogram Evaluation
Standard 12‐lead ECGs were recorded at a paper speed of 25 mm/s and these data were fed into a personal computer in digital form using an optical scanner. For three consecutive cycles in the record of each of the 12 electrocardiographic leads, two blind observers used calipers to measure QT, the interval from the onset of the QRS complex to the end of the T wave (defined as the return to TP baseline; when a U wave was present; the return to baseline was taken as the point of intersection between the baseline and the tangent to the descending limb of the T wave). The QT for each lead was calculated as the mean over the three cycles, and the absolute QT dispersion (ΔQT) was calculated by subtracting the shortest of these 12‐lead‐specific QTs from the longest. This value was converted into a percentage (%ΔQT) by dividing ΔQT by the shortest lead‐specific QT interval and multiplying by 100 (%ΔQT = ((QTmax− QTmin)/QTmin) × 100). Each lead‐specific QT was “corrected” for the patient's heart rate using Bazett's formula (QTc= QT (ms)/(1000 ms−1 RR (ms))1/2, 17 and an absolute QTc dispersion (ΔQTc) was calculated by subtracting the shortest lead‐specific QTc from the longest, subsequently expressed as a percentage (%ΔQTc= ((QTcmax− QTcmin)/QTcmin) × 100). The QT dispersion ratio (ΔQTr) was calculated as QT dispersion (ΔQT) divided by the cycle length in milliseconds and multiplied by 100.
The reliability of the QT measurements was checked by numbering and duplicating 20 ECGs in which they were measured independently by the two observers. The average percentage differences in QT measurements for the same ECG were 4–5% for within‐observer variability and 5–7% for between‐observer variability.
Statistical Analysis
Results are expressed below as means ± standard deviations. Normal distributions were identified by the Shapiro‐Wilk test. The significance of differences between groups was estimated using Friedman's test. Proportions were compared using Fisher's test.
RESULTS
One of the criteria for inclusion in the study had been that normal BP should be achieved within 8 weeks of the start of enalapril treatment. After 5 years, all the patients remained normotensive, but 8‐week suspension of treatment sufficed to return resting. BP values that, for the group as a whole, did not differ significantly from pretreatment values (150 ± 16/101 ± 10 mmHg after 5 years, 156 ± 14/105 ± 6 mmHg at pretreatment). Only six patients remained normotensive, with diastolic BPs < 95 mmHg. Eight weeks after the resumption of enalapril therapy, all except four patients were normotensive again, with resting blood pressures of 128 ± 12/82 ± 5 mmHg (Fig. 1). Four patients were put on enalapril plus low dose of thiazide treatment.
Figure 1.
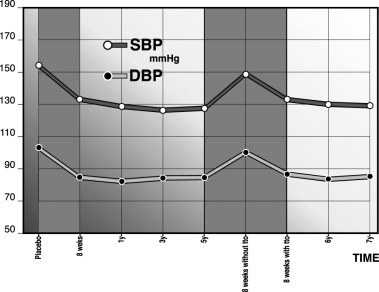
BP during 7 years of enalapril treatment. Eight‐week suspension of treatment after 5 years raised BP to pretreatment values.
LV mass index fell by 39% during the first 5 years treatment, from 148 ± 34 to 90 ± 16 g/m2 (P < 0.001), and septal thickness and LV wall thickness also fell significantly during this time, whereas LV fractional fiber shortening and LV ejection fraction were significantly greater after 5 years treatment than during the pretreatment placebo phase (P < 0.01 and P < 0.05, respectively). At no subsequent examination did either the LV mass index or any index of the LV structure or function exhibit any significant difference from the values recorded at 5‐year follow‐up; in particular, the 8‐week suspension of treatment following 5‐year follow‐up had no significant effect (Table 1 and Fig. 2).
Figure 2.
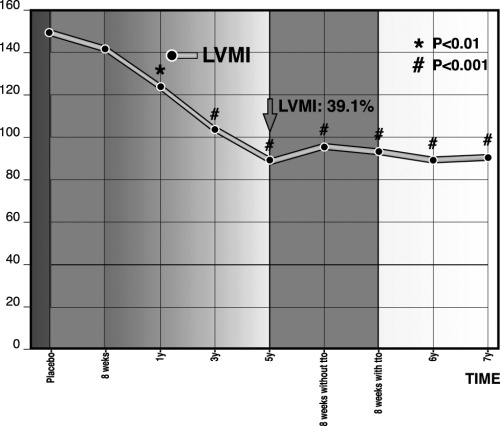
LVMI during 7 years of enalapril treatment. The 8‐week suspension after 5‐year follow‐up had no significant effect.
Serum glucose, cholesterol, creatinine, and Na+ concentrations remained unaltered over the 7 years of the study (during which no patient received treatment for antihyperlipemia). K+ concentration underwent a marginally significant increase from 4.1 to 4.9 mEq/L during the 1st year (P = 0.048), but thereafter returned to lower levels. There were no statistically significant changes in blood cell count and related parameters (hemoglobin, hematocrit, platelet count, and total and specific leukocyte counts) (data not shown).
During the placebo phase, LV mass was significantly correlated with ΔQT (r = 0.65, P < 0.0001) and ΔQTc (r = 0.62, P < 0.0001). Table 2 shows the evolution of QT and related parameters over the following 7 years. Five years enalapril treatment was accompanied by a progressive fall in QT, QTc, and the dispersion measures to significantly lower values (P < 0.01) that were maintained during the following 2 years. Similar to the measures of LV structure and function, QT, QTc , and their dispersions were not significantly affected by the 8‐week suspension of treatment that was tried after 5 years and was found to cause a return of BP to pretreatment values, and at no subsequent examination was any significant difference from the values recorded at 5‐year follow‐up detected (Fig. 3). The results are rate‐corrected by Bazett's formula. Recently, it has been reported that ΔQT remains unchanged during atrial pacing up 120 lpm and submaximal exercise. 18 Furthermore, correction by Bazett's formula results in prolongation of ΔQTc yielding values that may be misleading. 19 We have measured both values having a similar fall in ΔQT and ΔQTc during follow‐up.
Table 2.
ΔQT, ΔQTc, ΔQTr, ΔQT Reduction and ΔQTc Reduction During 7 Years of Enalapril Treatmenta
| Follow‐up | ΔQT | ΔQTc | ΔQTr | ΔQT Reduction (%) | ΔQTc Reduction (%) | ΔQT Reduction in Each Period (%) |
|---|---|---|---|---|---|---|
| Placebo | 61 ± 21 | 67 ± 27 | 7.3 ± 2.2 | – | – | – |
| 8 weeks (57 ± 5 days) | 52 ± 18 | 59 ± 24 | 6.1 ± 2.0 | 14.7 ± 4.6 | 11.9 ± 4.1 | 11.9 ± 4.1 |
| 1 year (11 ± 1 month) | 46 ± 15b | 48 ± 20 | 5.6 ± 1.8 | 24.6 ± 8.7 | 28.3 ± 9.3b | 16.4 ± 5.2 |
| 3 years (37 ± 1 month) | 41 ± 15b | 46 ± 18b | 5.1 ± 1.7b | 32.8 ± 10.9b | 31.3 ± 10.7b | 2.9 ± 0.8b |
| 5 years (59 ± 1 month) | 40 ± 14c | 43 ± 17c | 4.8 ± 1.7c | 34.4 ± 11.9c | 35.8 ± 12.2c | 4.5 ± 1.1c |
| 8 weeks without treatment (56 ± 3 days) | 40 ± 14c | 44 ± 17c | 4.7 ± 1.6c | 34.4 ± 11.6c | 34.3 ± 11.8c | −1.5 ± 0.5c |
| 8 weeks with treatment (96 ± 4 days) | 39 ± 14c | 44 ± 17c | 4.8 ± 1.7c | 36.0 ± 13.1c | 37.3 ± 13.4c | 0 0. ± 3c |
| 6 years (74 ± 1 month) | 38 ± 14c | 42 ± 16c | 4.7 ± 1.6c | 37.7 ± 13.8c | 37.3 ± 12.8c | 2.9 ± 0.7c |
| 7 years (87 ± 1 month) | 37 ± 13c | 41 ± 16c | 4.6 ± 1.7c | 39.3 ± 14.7c | 38.8 ± 14.2c | 1.5 ± 0.4c |
a ΔQT and ΔQTc in ms. b P < 0.05; c P < 0.01 with respect to the pretreatment placebo period.
Figure 3.
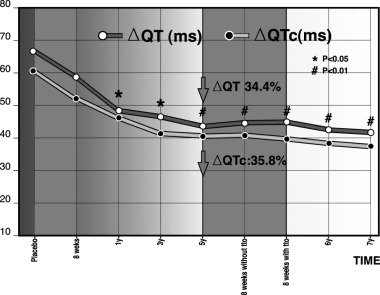
ΔQT and ΔQTc during 7 years of enalapril treatment. They were not affected by the 8‐week suspension of treatment after 5 years.
Although on average ΔQT and ΔQTc fell faster than LV mass index during the 1st year of treatment (especially during the first 8 weeks, coinciding with the normalization of BP), the difference was not statistically significant (Fig. 4).
Figure 4.
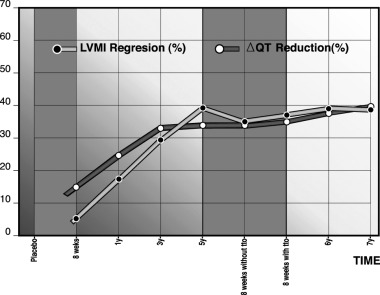
LVMI regression (%) and ΔQTc reduction (%) during 7 years of enalapril treatment.
None of the patients suffered any clinically detectable cardiovascular accident at any time during the 7‐year duration of the study.
DISCUSSION
Epidemiological studies have confirmed that patients with hypertension are more prone to cardiac death and sudden cardiac death if they exhibit LVH, and the combination of LVH and complex ventricular ectopies worsens prognosis. 20 , 21 , 22 In this study, 5 years enalapril treatment of hypertensives with LVH was accompanied by a progressive decrease in LV mass, improvement in LV systolic function indices, and reduction in QT and QTc dispersion. The values of structural, functional, and electrical parameters that had been achieved after 5 years were maintained during further treatment for 2 years. In particular, suspension of treatment for 8 weeks after 5 years caused no regression of the improvement in either QT‐derived parameters or parameters of LV structure and systolic function, even though BPs returned to pretreatment values. This strongly suggests that LV structure and function, rather than acute BP levels, are the primary determinants of QT dispersion.
Changes in BP do not imply simultaneous detectable changes in LV mass index: Manolis et al. 23 found no correlation between the extent of BP reduction and the extent of LV mass index reduction among hypertensives treated with a calcium antagonist or an inhibitor of angiotensin‐converting enzyme (ACE), and in our study there was no response of LV mass index to the rise of BP that occurred during the 8‐week suspension treatment. Furthermore, BP is a less reliable predictor of cardiovascular risk than LV mass index: Verdecchia et al. 24 found that regression of LV mass index in uncomplicated subjects with essential hypertension predicted reduced risk of subsequent cardiovascular disease, and that this association was independent of baseline LV mass, baseline clinic, and ambulatory BP and BP changes between baseline and the follow‐up visit; Muiesan et al. 25 reported that in a group of uncomplicated hypertensives, changes in LV mass index over 10 years were more strongly related to the occurrence of nonfatal cardiovascular events than were sex, cigarette smoking, or baseline or 10‐year values of BP, or of triglycerides, glucose, or total cholesterol concentrations. Although the greater predictive value of LV mass index may be due merely because it constitutes a better measure of long‐term BP control than clinical BP on a single follow‐up visit or ambulatory BP on a single follow‐up day, it seems more likely that it derives from the LV mass index that reflects an improvement in cardiac structure that directly reduces risk. The failure of some patients to achieve reduction of LV mass or regression of LVH in spite of reduction in BP may be due to the progression of coronary artery lesions and other risk factors for LVH.
Ichkhan et al. 26 have reported positive correlations among ΔQT,%ΔQT, and LV mass in patients with systemic hypertension. In our group, pretreatment correlation with LV mass was r = 0.65 for ΔQT and r = 0.62 for ΔQTc (P < 0.0001 in both cases). Karpanou et al. 27 found a correlation between the regression of LVH and improvement in QT dispersion in a group of hypertensive patients treated for 6 months with an ACE inhibitor or a calcium antagonist. Mayet et al. 28 have reported similar results in a subset of patients treated with ramipril or felodipine. In our group of hypertensive patients treated with enalapril, ΔQTc fell by 36% over 5 years whereas LVH, as measured by LV mass index, fell by 39%. Positive correlation between QT dispersion and LV mass index and mean aortic valve gradient has also been observed 29 in a group with another source of pressure overload, aortic stenosis; QT dispersion and LV mass index were furthermore reduced by valve replacement.
The correlation between QT dispersion and LV mass index among hypertensive patients, and the value of the latter for prediction of cardiovascular accidents and/or disease in the same population have led to suggestions that QT dispersion might be a readily determinable predictor of the measure of risk of sudden death. However, in a study 30 of several potentially useful parameters, ΔQT > 80 ms was a predictor of cardiac and sudden death only in the univariate analysis and not in the multivariate analysis. The greatest QT dispersion was found among Lown Class IV patients. Bugra et al. 31 found that different LV geometric patterns in untreated essential hypertension patients were associated with similar QT dispersion values. Mänttari et al. 32 reported that in a coronary risk population increased dispersion of QT peak (QT measured up to the peak of T wave) was an independent risk factor for sudden cardiac death, but not for fatal myocardial infarction. The lack of prognostic value of QT dispersion found in these reports may be due to measurement variability and the insensitivity of ΔQT to alterations of transmural dispersion of the action potential.
The correlation between LV mass index and QT dispersion is in keeping with a number of electrophysiological results obtained with experimental animals or biopsy tissue. Experiments with laboratory animals modeling hypertrophy due to volume overload 33 have revealed an “electrical remodeling” phenomenon (increased duration of the action potential and increased difference between its duration in the left and right ventricles) that is associated with increased susceptibility to induction of torsades de pointes arrhythmias and occurs even in the absence of increased collagen and decreased capillary/fiber ratio. Decreased uniformity of action potential duration has also been found in models of LVH due to pressure overload, 34 and LVH‐related susceptibility to ventricular arrhythmia is attributed to associated fibrosis and ischemia. Also, biopsies of interventricular septum and papillary muscle in patients undergoing replacement of the aortic and mitral valves, respectively, 35 have shown positive correlation between LV mass and myocyte diameter, and negative correlation between myocyte diameter and conduction velocity; this slowing of conduction by hypertrophic myocytes is due to the increased resistivity of intercellular gap junctions, which comes about because LVH reduces the density and alters the nature of the connexins which compose the gap junctions. In addition, experiments with biopsy tissue from heart with LVH show that the action potential is of longer duration in the septum than in the papillary muscle, regardless of the myocyte diameter. Finally, regression of LVH in an experimental model, 36 has been observed to be accompanied by a return of action potential duration and its dispersion to basal values, and by a fall in ventricular arrhythmia inducibility and a rise in ventricular fibrillation threshold.
Increased QT dispersion in patients with LVH may be related to alteration of the ion channels involved in cardiac repolarization. 37 , 38 Abnormalities in the potassium channels of hypertrophied myocytes have been shown to contribute to the prolongation of the action potential, suggesting that changes in potassium channel physiology may increase QT dispersion. Local ischemia, increased anisotropy, and stretching of myocardial fibers are among the other mechanisms that may possibly bring about increased QT dispersion in patients with LVH. The fact that in this study the fall in QT dispersion was on average initially faster than the fall in LV mass index (although the difference was not statistically significant in this small group) may therefore have been due to relaxation of the heart due to normalization of BP.
CONCLUSION
In conclusion, in hypertensive patients treated with enalapril, reduction of QT dispersion is correlated with gradual regression of LV mass index and is not immediately affected to a major extent by changes in BP, although a slight reduction may be induced by the initial normalization of BP.
REFERENCES
- 1. Zabel M, Portnoy S, Franz M. Electrocardiographic indices of dispersion of ventricular repolarization: An isolated heart validation study. J Am Coll Cardiol 1995;25: 746–752. [DOI] [PubMed] [Google Scholar]
- 2. Statters DJ, Malik M, Ward DE, et al. QT dispersion: Problems of methodology and clinical significance. J Cardiovasc Electrophysiol 1994;5: 672–685. [DOI] [PubMed] [Google Scholar]
- 3. Priori SG, Napolitano C, Diehl L, et al. Dispersion of the QT interval: A marker of therapeutic efficacy in the idiopathic long QT syndrome. Circulation 1994;89: 1681–1689. [DOI] [PubMed] [Google Scholar]
- 4. Glancy JM, Garrant CJ, Woods KL, et al. QT dispersion and mortality after myocardial infarction. Lancet 1995;354: 945–948. [DOI] [PubMed] [Google Scholar]
- 5. Perkiomaki JS, Koistinen J, Yli‐Mayri S, et al. Dispersion of QT interval in patients with and without susceptibility to ventricular tachyarrhythmias after previous myocardial infarction. J Am Coll Cardiol 1995;26: 174–179. [DOI] [PubMed] [Google Scholar]
- 6. Baar CS, Nass A, Freemann M, et al. QT dispersion and sudden unexpected death in chronic heart failure. Lancet 1994;343: 327–329. [DOI] [PubMed] [Google Scholar]
- 7. Davey PP, Bateman J, Mulligan IP, et al. QT interval dispersion in chronic heart failure and left ventricular hypertrophy: Relation to autonomic nervous system and Holter tape abnormalities. Br Heart J 1994;71: 268–273. [DOI] [PMC free article] [PubMed] [Google Scholar]
- 8. Pye M, Quinn AC, Cobbe SM. QT interval dispersion: A non‐invasive marker of susceptibility to arrhythmia in patients with sustained ventricular arrhythmias. Br Heart J 1994;71: 511–514. [DOI] [PMC free article] [PubMed] [Google Scholar]
- 9. Buja G, Miorelli M, Turrini P, et al. Comparison of QT dispersion in hypertrophic cardiomyopathy between patients with and without ventricular arrhythmias and sudden death. Am J Cardiol 1993;72: 973–976. [DOI] [PubMed] [Google Scholar]
- 10. Topol EJ, Lerman B. Hypomagnesemic torsades de pointes. Am J Cardiol 1983;52: 1367–1368. [DOI] [PubMed] [Google Scholar]
- 11. Elharrar V, Watanabe AM, Molello J, et al. Adrenergically mediated ventricular fibrillation in probucol‐treated dogs. Roles of alpha and beta adrenergic receptors. PACE 1979;2: 435–443. [DOI] [PubMed] [Google Scholar]
- 12. Herrmann HC, Kaplan LM, Bierer BE. QT prolongation and torsade de pointes ventricular tachycardia produced by the tetracyclic antidepressant agent maprotiline. Am J Cardiol 1983;51: 904–906. [DOI] [PubMed] [Google Scholar]
- 13. Kors J, Van Herpen G, Van Bemmel J. QT Dispersion as an attribute of T‐loop morphology. Circulation 1999;99: 1458–1463. [DOI] [PubMed] [Google Scholar]
- 14. González‐Juanatey JR, Pose A, Varela A, et al. Evolution of left ventricular hypertrophy and function during long‐term treatment of systemic hypertension with enalapril. Am J Cardio 1997;79: 373–376. [DOI] [PubMed] [Google Scholar]
- 15. González Juanatey JR, García Acuña JM, Pose A, et al. Reduction of QT and QTc dispersion during long‐term treatment of systemic hypertension with enalapril. Am J Cardiol 1998;81: 170–174. [DOI] [PubMed] [Google Scholar]
- 16. Devereaux RB, Reichek N. Echocardiographic determination of left ventricular mass in men: Anatomic validation of the method. Circulation 1977;55: 613–618. [DOI] [PubMed] [Google Scholar]
- 17. Bazett HC. An analysis of the time relations of electrocardiograms. Heart 1920;7: 353–370. [Google Scholar]
- 18. Zabel M, Franz MR, Klingenheben T, et al Rate‐dependence of QT dispersion and the QT interval: Comparison of atrial pacing and exercise testing. J Am Coll Cardiol 2000;36 (5):1654–1658. [DOI] [PubMed] [Google Scholar]
- 19. Vassilikos VP, Karagounis LA, Psichogios A, et al. Correction for heart rate is not necessary for QT dispersion in individuals without structural heart disease and patients with ventricular tachycardia. Ann Noninvas Electrocardiol 2002;7(1):47–52. [DOI] [PMC free article] [PubMed] [Google Scholar]
- 20. Haider A, Larson M, Benjamin E, et al. Increased left ventricular mass and hypertrophy are associated with increased risk for sudden death. J Am Coll Cardiol 1998;32: 1454–1459. [DOI] [PubMed] [Google Scholar]
- 21. Bikkina M, Larson M, Levy D. Asymptomatic ventricular arrhythmias and mortality risk in subjects with left ventricular hypertrophy. J Am Coll Cardiol 1993;22: 1111–1116. [DOI] [PubMed] [Google Scholar]
- 22. Schillaci G, Verdecchia P, Borgioni C, et al. Association between persistent pressure overload and ventricular arrhythmias in essential hypertension. Hypertension 1996;28: 284–289. [DOI] [PubMed] [Google Scholar]
- 23. Manolis A, Beldekos D, Handanis S, et al. Comparison of spirapril, isradipine or combination in hypertensive patients with left ventricular hypertrophy. Am J Hypertension 1998;11: 640–648. [DOI] [PubMed] [Google Scholar]
- 24. Verdecchia P, Schillaci G, Borgioni C, et al. Prognostic significance of serial changes in left ventricular mass in essential hypertension. Circulation 1998;97: 48–54. [DOI] [PubMed] [Google Scholar]
- 25. Muiesan L, Salvetti M, Rizzoni D, et al. Association of change in left ventricular mass with prognosis during long‐term antihypertensive treatment. J Hypertension 1995;13: 1091–1095. [DOI] [PubMed] [Google Scholar]
- 26. Ichkhan K, Molnar J, Somberg J. Relation of left ventricular mass and QT dispersion in patients with systematic hypertension. Am J Cardiol 1997;79: 508–511. [DOI] [PubMed] [Google Scholar]
- 27. Karpanou E, Vyssoulis G, Psichogios A, et al. Regression of left ventricular hypertrophy results in improvement of QT dispersion in patients with hypertension. Am Heart J 1998;136: 765–768. [DOI] [PubMed] [Google Scholar]
- 28. Mayet J, Shahi M, McGrath K, et al. Left ventricular hypertrophy and QT dispersion in hypertension. Hypertension 1996;28: 791–796. [DOI] [PubMed] [Google Scholar]
- 29. Darbar D, Cherry C, Kerins D. QT dispersion is reduced after valve replacement in patients with aortic stenosis. Heart 1999;82: 15–18. [DOI] [PMC free article] [PubMed] [Google Scholar]
- 30. Galinier M, Balanescu S, Fourcade J, et al. Prognostic value of arrhythmogenic markers in systemic hypertension. Eur Heart J 1997;18: 1484–1491. [DOI] [PubMed] [Google Scholar]
- 31. Bugra Z, Koylan N, Vural A, et al. Left ventricular geometric patterns and QT dispersion in untreated essential hypertension. Am J Hypertension 1998;11: 1164–1170. [DOI] [PubMed] [Google Scholar]
- 32. Mäntari M, Oikarinen L, Manninen V, et al. QT dispersion as a risk factor for sudden cardiac death and fatal myocardial infarction in a coronary risk population. Heart 1997;78: 268–272. [DOI] [PMC free article] [PubMed] [Google Scholar]
- 33. Vos M, De Groot S, Verduyn S, et al. Enhanced susceptibility for acquired Torsade de Pointes arrhythmias in the dog with chronic, complete AV block is related to cardiac hypertrophy and electrical remodeling. Circulation 1998; 98: 1125–1135. [DOI] [PubMed] [Google Scholar]
- 34. Guillis A, Mathison H, Kulisz E, et al. Dispersion of ventricular repolarization in left ventricular hypertrophy. J Cardiovasc Electrophysiol 1997;9: 988–997. [DOI] [PubMed] [Google Scholar]
- 35. McIntyre H, Fry C. Abnormal action potential conduction in isolated human hypertrophied left ventricular myocardium. J Cardiovasc Electrophysiol 1998;8: 887–894. [DOI] [PubMed] [Google Scholar]
- 36. Rials S, Wu Y, Ford N, et al. Effect of left ventricular hypertrophy and its regression on ventricular electrophysiology and vulnerability to inducible arrhythmia in the feline heart. Circulation 1995;91: 426–430. [DOI] [PubMed] [Google Scholar]
- 37. Rials SJ, Friehling TD, Marinchak RA. Potassium channels in cardiac arrhythmias: Focus on antiarrhythmic drug action. Prog Clin Biol Res 1990;334: 111–121. [PubMed] [Google Scholar]
- 38. Kleiman RB, Houser SR. Calcium currents in normal and hypertrophied isolated feline ventricular myocytes. Am J Physiol 1988;255: 1434–1442. [DOI] [PubMed] [Google Scholar]