Abstract
Introduction: Syncope and sudden death are associated with sympathetic stimulation in LQT1 while LQT2 patients are more susceptible to arrhythmias during nonexertional states. Abnormal spatial (QTd)‐ and transmural (TDR)‐dispersion of repolarization may indicate increased arrhythmogenicity. This study compares the effect of phenylephrine on QTd and TDR in genotyped LQTS to control (C).
Methods and Results: Seventeen LQT1, 12 LQT2, and 18 age‐ and sex‐matched normal controls received 2 mcg/kg of phenylephrine intravenously. At baseline and peak phenylephrine effect, BP, QT, RR, Bazett's QTc, precordial QTd (QTmax−QTmin), and T‐peak to T‐end (Tp‐e) intervals were determined blinded to the patient's clinical and genotype status. Baseline QT intervals and QTc were significantly longer in LQT1 and LQT2 compared to C. Baseline QTd and Tp‐e were greater in LQT2 than either LQT1 or C: QTd = 79 ± 29 ms (LQT2), 53 ± 26 (LQT1), and 45 ± 15 (C) and Tp‐e = 120 ± 30 ms (LQT2), 99 ± 20 (LQT1), and 90 ± 11 (C). Overall, phenylephrine exerted no significant effect on either QTd or Tp‐e except with subgroup analysis of symptomatic LQTS where LQT1 and LQT2 patients had a divergent response with TDR.
Conclusions: Phenylephrine‐induced bradycardia decreased TDR in symptomatic LQT1 but increased TDR in symptomatic LQT2. The observed effects of phenylephrine are consistent with the protective effect of beta‐blocker in LQT1 and the increased arrhythmogenicity noted during nonexertional states in LQT2.
Keywords: Long QT syndrome, electrocardiography, dispersion of repolarization, phenylephrine
The congenital long QT syndrome (LQTS) is typically an autosomal dominant‐inherited arrhythmogenic syndrome characterized by abnormal ventricular repolarization with QT interval prolongation apparent for most affected individuals. Clinical manifestations include syncope or sudden death due to life‐threatening polymorphic ventricular arrhythmias. 1 , 2 , 3 , 4 Genetic linkage and candidate gene mutational analyses over the past decade demonstrate LQTS as a cardiac channelopathy with putative disease‐causing mutations established in five genes encoding critical elements of cardiac ion channels. 5 , 6 , 7 , 8
Mutations in KVLQT1 (KCNQ1) and minK (KCNE1) disrupt the slowly activating delayed rectifier potassium current (IKs) underlying LQT1 and LQT5, respectively. Mutations in HERG (KCNH2) and MiRP1 (KCNE2) perturb the rapidly activating delayed rectifier potassium current (IKr) responsible for LQT2 and LQT6. Finally, mutations in SCN5A cause a “gain‐of‐function” to the cardiac sodium channel (INa) responsible for LQT3. Among the LQT1 and LQT2 forms of LQTS, arrhythmogenic cardiac events such as syncope or sudden cardiac arrest are more commonly associated with exertion and sympathetic stimulation in LQT1 than in LQT2. 9 , 10 In contrast, cardiac events usually occur during rest, arousal from rest, or precipitated by an auditory trigger in LQT2. 3 Cellular mechanisms accounting for these genotype‐specific arrhythmogenic triggers are beginning to emerge.
Recent experimental studies utilizing arterially perfused canine LV wedge preparations demonstrate that the peak of the T wave on the electrocardiogram (ECG) corresponds to full repolarization of epicardial cells whereas the end of the surface T wave occurs simultaneously with the end of action potential in the mid‐myocardial cell layers. 11 , 12 Thus, an assessment of transmural dispersion of repolarization (TDR) through the myocardium may be determined by the interval from the peak of the T wave to the end of the T wave (Tpeak−Tend or Tp‐e). 12 , 13 , 14 In contrast to TDR, the difference between the maximum and the minimum QT value on a 12‐lead ECG (QT dispersion; QTd) may reflect spatial dispersion of repolarization. 15 Phenylephrine, an alpha‐adrenergic agonist, significantly slows heart rate via a reflex vagal response. Since patients with LQT2 are more prone to cardiac events in the setting of relative bradycardia and/or sympathetic withdrawal compared to LQT1, we postulated that phenylephrine may exert a genotype‐specific effect on these indices of repolarization. In particular, we hypothesized that phenylephrine‐induced changes in transmural and spatial dispersion of repolarization would be most apparent in patients with LQT2.
METHODS
Patient Population
Between January 1998 and December 2000, 47 subjects: 17 LQT1 (12 F, 26.9 ± 11.6 years), 12 LQT2 (6 F, 28 ± 13 years), and 18 age‐ and sex‐matched normal controls (10 F, 26.3 ± 12.3 years) underwent phenylephrine provocation in this study approved by the Mayo Foundation Institution Review Board.
Measurements
Continuous 12‐lead body‐surface electrocardiograms (ECGs) were recorded at rest and following bolus infusion of phenylephrine. The sinus cycle length (RR interval; ms) was defined as the interval between R wave to the adjacent R wave. Heart rate (HR; beat per minute) was calculated from the sinus cycle length by 60,000/RR interval. Five consecutive RR intervals were measured and averaged in lead II, V1–V6. The QT interval was defined as the time interval between the onset of QRS and the point at which the isoelectric line intersected a tangential line drawn at the maximal downslope of the positive T wave or at the maximal upslope of the negative T wave.
The T‐peak to T‐end (Tp‐e) interval was defined as the time interval between the peak of the positive T wave or the nadir of the negative T wave and the point at which the isoelectric line intersected a tangential line drawn at the maximal downslope of the positive T wave or at the maximal upslope of the negative T wave. When the T wave had a biphasic or a notched configuration, the peak of the T wave was defined as that of the dominant T wave. The QT dispersion (QTd) was defined as the difference between the maximum and the minimum QT intervals found in the 12‐lead ECG. Corrected QT interval (QTc) was calculated by Bazett's formula: QTc = QT interval/square root of preceding RR interval in milliseconds.
Phenylephrine Administration
All patients were given a phenylephrine bolus intravenously at 2 mcg/kg. At baseline and following the peak phenylephrine effect as determined by the longest sinus cycle length interval, the patient's blood pressure (BP), QT interval, RR interval, Bazett's QTc, QTd, and Tp‐e interval were determined with the investigator (AK) blinded to both the patients' clinical and genotype status.
Statistical Analysis
Data are reported as the mean ± SD. One‐way ANOVA followed by Turkey‐Kramer HSD was used to compare measurements made before and after phenylephrine administration, and to compare each parameter among LQT1, LQT2, and control patients. A value of P < 0.05 was considered to be statistically significant.
RESULTS
Phenylephrine infusion elicited significant slowing of heart rate in all the patients studied. The baseline HR was 59 ± 8 (LQT1), 57 ± 9 (LQT2), and 63 ± 7 bpm (C) decreasing to 47 ± 7, 46 ± 9, and 47 ± 6 bpm, respectively following intravenous infusion of 2 mcg/kg phenylephrine. There were no significant differences in the degree of phenylephrine‐induced bradycardia among the three groups. Baseline blood pressure was similar in all groups. In addition, phenylephrine‐mediated hypertension was seen uniformly in all subjects (Table 1). As expected, baseline QT intervals (482 ± 45 ms and 520 ± 68 vs 414 ± 27) and QTc (476 ± 26 ms and 504 ± 43 vs 422 ± 28) were significantly longer in LQT1 and LQT2 compared to C (P < 0.0001). In addition, baseline QT intervals and QTc in patients with genotyped LQT2 were significantly longer than in LQT1 patients (Fig.1).
Table 1.
Demographics for LQTS and Control Patients
| LQT1 | LQT2 | Control | |
|---|---|---|---|
| Sex (Female/Male) | 12/5 | 6/6 | 10/8 |
| Age (year) | 26.9 ± 11.6 | 28.0 ± 13.0 | 26.3 ± 12.3 |
| Resting QTc (ms) | 476 ± 26 | 504 ± 43 | 422 ± 28 |
| Resting heart rate (bpm) | 59 ± 8 | 57 ± 9 | 63 ± 7 |
| Phenylephrine heart rate (bpm) | 47 ± 7 | 46 ± 10 | 47 ± 6 |
| Resting systolic blood pressure (mmHg) | 128 ± 15 | 127 ± 20 | 131 ± 19 |
| Phenylephrine systolic blood pressure (mmHg) | 138 ± 7 | 138 ± 20 | 147 ± 18 |
| Resting diastolic blood pressure (mmHg) | 71 ± 11 | 72 ± 7 | 73 ± 13 |
| Phenylephrine diastolic blood pressure (mmHg) | 83 ± 14 | 77 ± 9 | 75 ± 21 |
Figure 1.
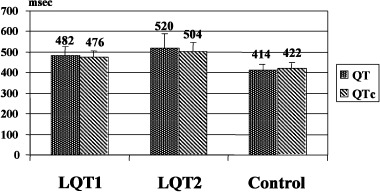
Baseline QT interval and QTc in the study groups. QT and QTc in LQT2 are greater than in LQT1 and control; QT and QTc in LQT1 are also greater than in control (P < 0.0001).
After phenylephrine administration, there was no significant change in absolute QT interval (ΔQT = QT after phenylephrine − QT before phenylephrine) in any group (ΔQT: LQT1, 11 ± 27; LQT2, −2 ± 14; C, 3 ± 6 ms). Because of the phenylephrine‐induced bradycardia, the rate‐corrected QTc was significantly decreased in all groups (ΔQTc: LQT1,−43 ± 31; LQT2, −54 ± 31; C, −56 ± 21 ms) (Fig. 2). However, these changes of QTc were not significantly different among the three groups.
Figure 2.
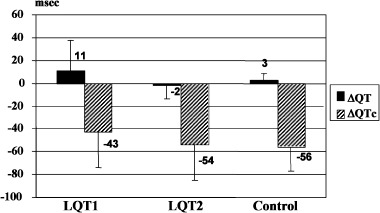
Delta QT and QTc after phenylephrine in the study groups.
The baseline QTd and Tp‐e measurements were significantly greater in LQT2 than either LQT1 or C: QTd = 79 ± 29 ms (LQT2), 53 ± 26 (LQT1), 45 ± 15 (C), P < 0.001, and Tp‐e = 120 ± 30 ms (LQT2), 99 ± 20 (LQT1), and 90 ± 11 (C), P < 0.001 (Fig. 3). The effect of phenylephrine on QTd and Tp‐e are summarized in Table 2. Between genotyped LQTS or C, phenylephrine exerted no significant effect on either QTd or Tp‐e.
Figure 3.
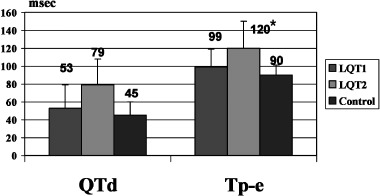
Baseline QTd and Tp‐e in the three groups. *QTd and Tp‐e in LQT2 are greater than in LQT1 and control (P < 0.003).
Table 2.
Phenylephrine‐Induced Changes in Mean QTd and Mean Tp‐e in LQT1, LQT2, and Control Patients. No Significant Difference of QTd (P = 0.17) and Tp‐e (P = 0.37) Before and After Phenylephrine in the Three Groups
| Mean QTd (ms) | Mean Tp‐e (ms) | |||
|---|---|---|---|---|
| Before | After | Before | After | |
| LQT1 pts (n = 17) | 53 ± 26 | 50 ± 20 | 99 ± 21 | 102 ± 12 |
| LQT2 pts (n = 12) | 79 ± 29 | 92 ± 54 | 120 ± 30 | 128 ± 38 |
| Control pts (n = 18) | 45 ± 15 | 49 ± 16 | 90 ± 11 | 92 ± 12 |
However, subset analysis based upon the presence or absence of clinical symptoms revealed a differential response to phenylephrine. Of the 29 genotyped LQTS patients, there were 5 patients with LQT1 and 4 patients with LQT2 who had a history of cardiac events including near drowning, syncope, and/or sudden cardiac arrest. Baseline QTd and Tp‐e are summarized in Table 3. Subgroup analysis of symptomatic LQT1 (n = 5) and symptomatic LQT2 (n = 4) demonstrated a significant difference in the Tp‐e change between symptomatic LQT1 and LQT2 patients following phenylephrine administration. In symptomatic LQT1 patients, Tp‐e decreased 9 ± 27 ms whereas Tp‐e increased by 16 ± 22 ms in symptomatic LQT2 patients, P < 0.02 (Fig. 4). In addition, phenylephrine tended to decrease QTd in symptomatic LQT1 but increase QTd in symptomatic LQT2 (−15 ± 39 and 14 ± 32 ms) but was not statistically significant (P = 0.35) (Fig. 5).
Table 3.
Baseline QTd and Tp‐e in Symptomatic and Asymptomatic LQT1, LQT2
| Mean QTd (ms) | Mean Tp‐e (ms) | |||
|---|---|---|---|---|
| Symptomatic (n = 9) | Asymptomatic (n = 20) | Symptomatic (n = 9) | Asymptomatic (n = 20) | |
| LQT1 pts (n = 17) | 68 ± 41 | 47 ± 15 | 112 ± 29 | 93 ± 13 |
| LQT2 pts (n = 12) | 84 ± 42 | 77 ± 24 | 127 ± 36 | 116 ± 29 |
| Control pts (n = 18) | 45 ± 15 | 90 ± 11 | ||
Figure 4.
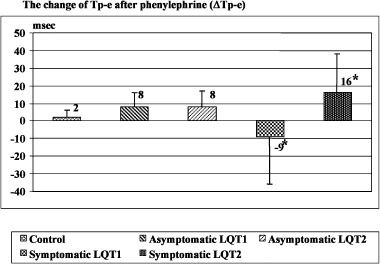
Comparison of the change of Tp‐e after phenylephrine in asymptomatic and symptomatic LQT1, LQT2, and control. The degree of change of Tp‐e is significantly different between symptomatic LQT1 and symptomatic LQT2 *(P <0.02).
Figure 5.
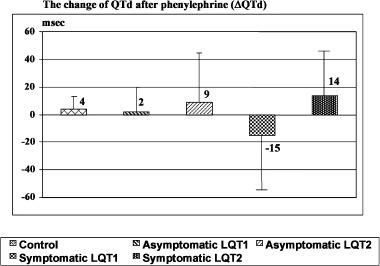
Comparison of the change of QTd after phenylephrine in asymptomatic and symptomatic LQT1, LQT2, and control. The degree of change of QTd is not significantly different in all groups (P = 0.35).
DISCUSSION
Phenylephrine, an alpha‐adrenergic agonist, is a vasopressor, acting mainly on the arterial bed. The increase in afterload produces hypertension that in turn causes reflex vagal activation and the observed slowing of heart rate. This physiological loop was seen uniformly in each participant.
The QT interval is a surface marker of cardiac electrical activity, particularly cellular repolarization. It is generally accepted that the duration of this interval reflects the time from the earliest cardiac activation to the latest repolarization in the myocardium. Generally, most LQTS patients manifest prolonged QT intervals at rest. 16 However, patients may have concealed LQTS with a normal resting ECG but with abnormalities in repolarization detected with provocation. 17 , 18 Nonetheless, the baseline QTc is still one of the most important diagnostic criteria for congenital LQTS. In this study, baseline QT interval and QTc were significant longer in LQTS patients than in controls as expected. Genotype‐phenotype correlative studies have shown that sympathetic stimulation is a key trigger in LQT1 whereas states of relative bradycardia appear to render LQT2 and LQT3 patients more vulnerable. 19 Perhaps, the particular genetic substrate differentially affects the cellular heterogeneity of repolarization seen throughout the heart and across the myocardium.
Spatial and Transmural Dispersion of Repolarization
Although recent reviews 20 , 21 suggests that QTd may not reflect spatial dispersion of repolarization in most instances, LQTS may be an exception. The detection and quantification of QTd showed its effectiveness, but also limitations in LQTS patients. 15 Day et al. 22 provided data supporting the role of QTd to identify spatial heterogeneity of repolarization. They found evidence of abnormally increased QTd in patients with LQTS and showed a direct correlation of the degree of QTd with cardiac events. Recent experimental studies have suggested an important role of transmural dispersion of repolarization (TDR) that is electrical heterogeneity across the ventricular wall. 13 , 14 , 23 Experimental animal studies have suggested that the interval from T‐peak to T‐end (Tp‐e) provides an index of TDR through the various myocardial cell layers. 11 , 12 , 13 , 14 , 24 However, the clinical relevance of this measurement has not been established.
In this study, we determined the effect of phenylephrine on these two parameters (QTd and Tp‐e). Baseline QTd and Tp‐e were greater in LQT2 than either LQT1 or control. Previously, Tanabe et al. 25 observed that both transmural and spatial dispersion of repolarization were increased at rest in patients with congenital LQTS regardless of genotype. Perhaps, this discrepancy can be explained by the symptomatic status of our genotyped subjects. Indeed, subgroup analysis of symptomatic patients with either LQT1 and LQT2 had increased baseline QTd and Tp‐e indices. On the other hand, asymptomatic LQT1 patients had normal indices whereas asymptomatic LQT2 patients still had increased QTd and Tp‐e suggesting that the likelihood of cardiac events in KVLQT1‐based LQT1 may be predicated on the presence of increased spatial and/or transmural dispersion of repolarization.
Effect of Phenylephrine on QTd and TDR
Phenylephrine exerted no significant effect on either QTd or Tp‐e in the three groups. Sun et al. 26 reported that phenylephrine did not increase QTd in patients with LQTS. In that study, they included symptomatic congenital LQTS patients without heed to the underlying genotype. Subgroup analysis of symptomatic patients with LQT1 and LQT2 in our study unveiled significant and divergent changes in Tp‐e following phenylephrine: phenylephrine induced decrease in TDR in LQT1 but phenylephrine accentuated TDR in LQT2. Phenylephrine also tended to impact QTd in the same direction as Tp‐e in LQT1 and LQT2 patients.
Although the precise mechanism underlying the differential phenylephrine‐mediated effect on LQT1 versus LQT2 has not been determined, the explanation is likely provided by rate‐dependent repolarization changes in the setting of IKs (LQT1) and IKr (LQT2) dysfunction. A direct phenylephrine‐mediated effect cannot be absolutely excluded. IKs is normally deficient in LQT1, so that the increase in the depolarizing current flowing through L‐type calcium channels is not compensated by IKs increase with β‐adrenergic activation, resulting in prolonged wedge TDR. 14 The opposite could happen with sympathetic withdrawal after phenylephrine.
Life‐threatening cardiac events in LQTS patients tend to occur under specific circumstances in a gene‐specific manner. Schwartz et al. reported that 62% of LQT1 patients experienced the cardiac events during exercise and only 3% during rest/sleep. This genotype‐phenotype correlation was reversed among LQT2 and LQT3 patients, who were less likely to have events during exercise (13%) and more likely to have events during rest/sleep (29% and 39%). 19 Our data indicate that at least with phenylephrine‐induced bradycardia, patients with LQT2 manifest significantly increased indices of transmural and spatial dispersion of repolarization suggesting a potential cellular substrate for life‐threatening arrhythmias in LQT2 patients.
Phenylephrine, β‐blocker Therapy, and Arrhythmogenesis in Genotyped LQTS
β‐blocker therapy is the mainstay for the treatment of congenital LQTS patients. Moss et al. 27 reported the effectiveness and limitations of β‐blocker therapy in congenital LQTS regardless of genotype and concluded that β‐blockers significantly reduce cardiac events in LQTS patients. However, syncope, aborted cardiac arrest, and LQTS‐related death continue to occur while patients are on prescribed β‐blockers, particularly in those who were symptomatic before starting β‐blocker therapy.
Schwartz et al. 19 reported the percentage of patients who were free of recurrence with β‐blocker therapy was higher and the death rate was lower (81% and 4%, respectively) among LQT1 patients than both LQT2 (59% and 4%, respectively) and LQT3 (50% and 17%) patients. Perhaps, β‐blocker therapy is protective in LQT1 by decreasing QTd and TDR. Our observations that phenylephrine decreased Tp‐e and QTd in the symptomatic LQT1 patients is consistent with such speculation. In contrast, previously symptomatic LQT2 patients further increased TDR and QTd with phenylephrine provocation. It would be worthwhile to determine whether or not serial ECGs in LQT2 genotyped patients shown to be “β‐blocker therapy failures” document increased dispersion of repolarization indices.
Study Limitations
This study involved only genotyped LQT1 and LQT2 patients. It would be interesting to determine the effect of phenylephrine on patients with SCN5A‐based LQT3. This form of LQTS accounts for less than 5% of LQTS. Thus far, we have conducted this phenylephrine provocation on only three LQT3 patients from the same family and the effect of phenylephrine appears LQT2‐like (data not shown). However, a much larger study in LQT3 patients is necessary. If indeed, resting and phenylephrine‐provoked increases in both spatial and transmural dispersion underlie the cellular mechanism for increased arrhythmogenicity during the states of rest in LQT2 and LQT3, then these findings may add to the growing concern about the adequacy of protection afforded by β‐blocker therapy in LQT2 and LQT3. However, it is critical to be reminded that the effects of phenylephrine on dispersion of repolarization may not be the same as the effects of β‐blocker therapy. In addition, the number of symptomatic LQTS patients was low in this cohort (9 of 29). The distinct and statistically significant phenylephrine profile observed between symptomatic LQT1 patients and symptomatic LQT2 patients will require confirmation with future studies.
CONCLUSION
Dispersion of repolarization, both spatial and transmural, was greater in LQT2 than LQT1 patients. Patients with a history of LQTS‐related cardiac events had greater dispersion indices at rest regardless of genotype. Phenylephrine‐induced bradycardia decreased transmural dispersion of repolarization in symptomatic LQT1 patients but increased transmural dispersion of repolarization in symptomatic LQT2 patients. The observed effects of phenylephrine are consistent with the protective effect of β‐blocker therapy in LQT1 and the increased arrhythmogenicity noted during rest/sleep states in LQT2 patients.
REFERENCES
- 1. Moss AJ, Schwartz PJ, Crampton RS, et al The long QT syndrome: A prospective international study. Circulation 1985;71: 17–21. [DOI] [PubMed] [Google Scholar]
- 2. Moss AJ, Schwartz PJ, Crampton RS, et al The long QT syndrome: Prospective longitudinal study of 328 families. Circulation 1991;84: 1136–1144. [DOI] [PubMed] [Google Scholar]
- 3. Li H, Fuentes‐Garcia J, Towbin JA. Current concepts in long QT syndrome. Pediatr Cardiol 2000;21: 542–550. [DOI] [PubMed] [Google Scholar]
- 4. Ackerman MJ. The long QT syndrome: Ion channel diseases of the heart. Mayo Clin Proc 1998;73: 250–269. [DOI] [PubMed] [Google Scholar]
- 5. Ackerman MJ, Clapham DE. Ion channels: Basic science and clinical disease. N Engl J Med 1997: 336: 1575–1586. [DOI] [PubMed] [Google Scholar]
- 6. Vincent GM. The molecular genetics of the long QT syndrome: Genes causing fainting and sudden death. Annu Rev Med 1998;49: 263–274. [DOI] [PubMed] [Google Scholar]
- 7. Chiang C, Roden DM. The long QT syndromes: Genetic basis and clinical implications. J Am Coll Cardiol 2000;36: 1–12. [DOI] [PubMed] [Google Scholar]
- 8. Russel MW. The long QT syndromes. Prog Pediatr Cardiol 1996;6: 43–51. [Google Scholar]
- 9. Ackerman MJ, Tester DJ, Porter CJ. Swimming, a gene‐specific arrhythmogenic trigger for inherited long QT syndrome. Mayo Clin Proc 1999;74: 1088–1094. [DOI] [PubMed] [Google Scholar]
- 10. Zareba W, Moss AJ, Schwartz PJ, et al, for the International Long‐QT Syndrome Registry Research Group . Influence of genotype on the clinical course of the long‐QT syndrome. N Engl J Med 1998;339: 960–965. [DOI] [PubMed] [Google Scholar]
- 11. Yan GX, Shimizu W, Antzelevitch C. Characteristics and distribution of M cells in arterially perfused canine left ventricular wedge preparations. Circulation 1998;98: 1921–1927. [DOI] [PubMed] [Google Scholar]
- 12. Antzelevitch C. Tpeak‐Tend interval as an index of transmural dispersion of repolarization. Eur J Clin Invest 2001;31: 555–557. [DOI] [PubMed] [Google Scholar]
- 13. Shimizu W, Antzelevitch C. Cellular basis for the ECG features of the LQT1 form of the long QT syndrome: Effects of beta‐adrenergic agonists and antagonists and sodium channel blockers on transmural dispersion of repolarization and torsade de pointes. Circulation 1998;21: 2314–2322. [DOI] [PubMed] [Google Scholar]
- 14. Shimuizu W, Antzelevitch C. Differential effects of beta‐adrenergic agonists and antagonists in LQT1, LQT2 and LQT3 models of the long QT syndrome. J Am Coll Cardiol 2000;35: 778–786. [DOI] [PubMed] [Google Scholar]
- 15. Napolitano C, Priori SG, Schwartz PJ. Significance of QT dispersion in the long QT syndrome. Prog Cardiovasc Dis 2000;42: 345–350. [DOI] [PubMed] [Google Scholar]
- 16. Vincent GM, Timothy KW, Leppert M, et al The spectrum of symptoms and QT intervals in carriers of the gene for the long QT syndrome. N Engl J Med 1992;327: 846–852. [DOI] [PubMed] [Google Scholar]
- 17. Ackerman MJ, Tester DJ, Driscoll DJ. Molecular autopsy of sudden unexplained death in the young. Am J Forensic Med Pathol 2001;22: 105–111. [DOI] [PubMed] [Google Scholar]
- 18. Kaufman ES, Priori SG, Napolitano C, et al Electrocardiographic prediction of abnormal genotype in congenital long QT syndrome: Experience in 101 related family members. J Cardiovasc Electrophysiol 2001;12: 455–461. [DOI] [PubMed] [Google Scholar]
- 19. Schwartz PJ, Priori SG, Spazzolini C, et al Genotype‐phenotype correlation in the long QT syndrome gene‐specific triggers for life‐threatening arrhythmias. Circulation 2001;103: 89–95. [DOI] [PubMed] [Google Scholar]
- 20. Malik M, Batchvarov VN. Measurement, interpretation and clinical potential of QT dispersion. J Am Coll Cardiol 2000;36: 1749–1766. [DOI] [PubMed] [Google Scholar]
- 21. Batchvarov V, Malik M. Measurement and interpretation of QT dispersion. Prog Cardiovasc Dis 2000;42: 325–344. [DOI] [PubMed] [Google Scholar]
- 22. Day CP, McComb JM, Campbell RW. QT dispersion: An indication of arrhythmia risk in patients with long QT intervals. Br Heart J 1990;63: 342–344. [DOI] [PMC free article] [PubMed] [Google Scholar]
- 23. Viswanathan PC, Rudy Y. Cellular arrhythmogenic effects of congenital and acquired long QT syndrome in the heterogenous myocardium. Circulation 2000;101: 1192–1198. [DOI] [PubMed] [Google Scholar]
- 24. Yan GX, Antzelevitch C. Cellular basis for the normal T wave and the electrocardiographic manifestations of the long QT syndrome. Circulation 1998;98: 1928–1936. [DOI] [PubMed] [Google Scholar]
- 25. Tanabe Y, Inagaki M, Kurita T, et al Sympathetic stimulation produces a greater increase in both transmural and spatial dispersion of repolarization in LQT1 than LQT2 forms of congential long QT syndrome. J Am Coll Cardiol 2001;37: 911–919. [DOI] [PubMed] [Google Scholar]
- 26. Sun ZH, Swan H, Vitasalo M, et al Effects of epinephrine and phenylephrine on QT interval dispersion in congenital long QT syndrome. J Am Coll Cardiol 1998;31: 1400–1405. [DOI] [PubMed] [Google Scholar]
- 27. Moss AJ, Zareba W, Hall WJ, et al Effectiveness and limitations of β‐blocker therapy in congenital long QT syndrome. Circulation 2000;101: 616–623. [DOI] [PubMed] [Google Scholar]


