Abstract
Background: We need to know the magnetocardiogram (MCG) features regarding waveform and two‐dimensional current distribution in normal subjects in order to classify the abnormal waveform in patients with heart disease. However, a standard MCG waveform has not been produced yet, therefore, we have first made the standard template MCG waveform.
Methods and Results: We used data from 464 normal control subjects' 64‐channel MCGs (268 males, 196 females) to produce a template MCG waveform. The measured data were averaged after shortening or lengthening and normalization. The time interval and amplitude of the averaged data were adjusted to mean values obtained from a database. Furthermore, the current distributions (current arrow maps [CAMs]) were calculated from the produced templates to determine the current distribution pattern.
The produced template of the QRS complex had a typical shape in six regions that we defined (M1, M2, M3, M4, M5, and M6). In the P wave, the main current arrow in CAMs pointing in a lower‐left direction appeared in M1. In the QRS complex, the typical wave appeared in each region, and there were two main current arrows in M2 and M5. There were negative T waves in M1, M4, and M5, and positive T waves in M3 and M6, and the main current arrow pointing in a lower‐left direction appeared in M2.
Conclusion: Template MCG waveforms were produced. These morphologic features were classified into six regions, and the current distribution was characterized in each region. Consequently, the templates and classifications enable understanding MCG features and writing clinical reports.
Keywords: magnetocardiogram, standardization, template, current arrow
Magnetocardiogram (MCG) signals are produced from two‐dimensional tangential components of currents in the heart, which are parallel to a magnetic sensor array (or a measurement plane above the human body) because currents orthogonal to the sensor array hardly produce a magnetic field in the measurement plane according to physical laws of magnetic fields. Using the physical characteristics, two‐dimensional cardiac currents are reconstructed using an inverse‐problem approach. 1 , 2 , 3 , 4 On the other hand, a technique of visualizing pseudo currents (i.e., vector arrow) has been used 5 , 6 , 7 , 8 because the inverse problem gives an ill‐posed solution. We have also used a similar technique that uses a current arrow map (CAM), which visualizes both vector arrows and a contour map of the magnitude of vector arrows, to understand and detect abnormalities in ischemic and arrhythmic cardiac patients. 9 , 10 , 11 , 12 , 13 , 14 , 15 , 16 , 17
MCGs detect a two‐dimensional electrical excitation that occurs in the heart. Distributions of two‐dimensional currents restricted to the hearts of normal control subjects exhibit a very similar pattern that is independent of the body size. Therefore, the morphology of MCG waveforms produced from two‐dimensional currents is very similar in each person. This unique characteristic of MCGs can always be seen when MCG data of normal controls are used. That characteristic enables the production of a template MCG waveform, whereas making a template electrocardiogram (ECG) waveform is difficult because conductivity differences (such as bones, lungs, and skin) in the body often affect ECG waveforms.
In this article, template MCG waveforms are made using normal controls' MCG data of 464 subjects. To make accurate templates, we use simple calculation techniques (such as normalization and shortening or lengthening) according to age‐related and gender‐related features, which were obtained from a database of standard parameters (such as PQ, QRS, QT intervals). Furthermore, we classify the six regions in the measurement area using the template. Using the classifications, the waveform morphology in each region and their main currents are summarized.
PRODUCTION OF TEMPLATE MCG WAVEFORMS
Raw MCG Data
ECGs were taken from 869 Japanese people (493 males, 54 ± 7 years; 376 females, 52 ± 8 years; total: 53 ± 8 years). Out of those 869 people we used 64‐channel MCG data of 464 subjects (268 males, 52 ± 7 years; 196 females, 50 ± 8 years; total: 51 ± 8 years), who were selected as normal controls on the basis of their ECGs. 24
Main Procedure of Making MCG Template
We need to know the features of MCG waveforms before an averaging process is performed to make a template MCG waveform because the optimal averaging process for each parameter needs to be determined. Using MCG time intervals, we plotted the variation of average PQ, QRS, and QT time intervals versus age, as shown in Figure 1. The mean value of each time interval of all 464 subjects is 100%. All time intervals exhibit a small variation at all ages, as shown in Figure 1A. On the other hand, the magnetic‐field amplitude, in particular in the T wave, exhibits a wide variation. According to these features, the time intervals are considered to be a constant parameter. However, the MCG amplitude needs to be normalized to make a template.
Figure 1.
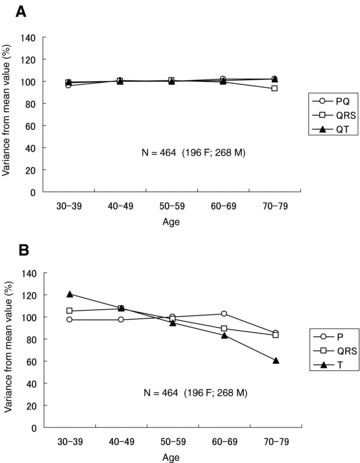
(A) Variance from mean value versus age for PQ, QRS, and QT intervals. (B) Variance from mean value versus age for peak amplitudes of P, QRS, and T waves.
Based on the above features, the main calculation method is provided, as shown in Figure 2. First, each subject's MCG waveforms are separated into three blocks: PQ, QRS, and ST‐T wave. Second, template waveforms of each block are produced, as described in the next two sections. Third, the time interval of each template are either shortened or lengthened to the mean time interval of Table 1, which are calculated from the database of all subjects. Next, the normalized MCG amplitude of each template is adjusted to the mean magnetic amplitude of Table 1. Finally, these three components are combined to make a template MCG waveform.
Figure 2.
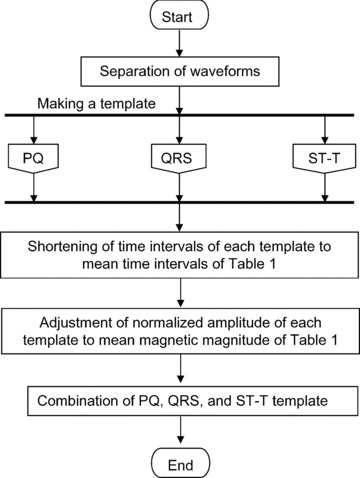
Main procedure for making a template MCG waveform.
Table 1.
Mean MCG Parameters
| Time Interval (ms) | Magnetic Field (pT) | ||||
|---|---|---|---|---|---|
| PQ | QRS | QT | Ppeak | QRSpeak | Tpeak |
| 161.9 | 96.6 | 423.3 | 1.7 | 25.2 | 6.7 |
Method for Making PQ and QRS Template of MCG
There are separate procedures for making PQ and QRS templates of an MCG. First, the length of each subject's MCG measurement data of PQ and QRS waveforms are lengthened to the maximum MCG data because the length of PQ and QRS in subjects varies. The lengthening process is performed by adding data points with zero amplitude from the end of the original data to the maximum time interval of all subjects. Second, the maximum amplitude of PQ and QRS in all channels is normalized to 1. In step (b), each subject's waveform (subject 1, 2, … N) is a signal with the maximum amplitude of the 64 channels measured for each subject. Finally, the signals of the same channel of all subjects are averaged, and the PQ‐waveform template and QRS‐complex template are obtained. This procedure is finished and the calculated data are transferred to the main procedure.
Method for Making ST‐T Template of MCG
The ST waveform has a different feature from the PQ waveform and QRS complex, but the QT time interval does not vary at all ages (see Fig. 1A). The time when the maximum amplitude of the ST‐T waveform occurs varies among the subjects. Therefore, first, we separate the ST‐T waveforms into two waveforms: the ST‐Tpeak waveform and Tpeak‐Tend waveform. Second, the ST‐Tpeak waveforms are extended to 1001 ms. Third, the Tpeak‐Tend waveforms are extended using the ratio of the time interval of the ST‐Tpeak of each subject to 1001 ms. In the next step, the ST‐Tpeak and Tpeak‐Tend waveforms are combined (step 1 at bottom of figure). In the same manner, the time interval of the data is lengthened by adding data points with zero amplitude after the end of the Tend (step 2 at bottom of figure), and the amplitude of the magnetic field of ST‐T waveforms is normalized (step 3 at bottom of figure). Finally, the signals of the same channel of all subjects are averaged, and the ST‐T‐waveform template is obtained. This procedure is finished and data are transferred to the main procedure.
Method for Making Spatial Current Distribution
We produced a CAM, which indicates pseudocurrents (Ix and Iy) from the derivatives of the normal component (Bz) of the MCG signals as
| (1) |
and
| (2) |
The magnitude of the current arrows (I = (Ix2+ Iy2)1/ 2) is plotted as a contour map. The CAM helps us to interpret spatial heart electrical activity. 9 Using the CAM, we visualize a spatial current distribution as a standard electrophysiological activation.
FEATURE OF PRODUCED TEMPLATE MCG WAVEFORMS
MCG‐Template Waveforms
Sixty‐four overlapping MCG‐template waveforms are shown in Figure 3A In the figure, < positive P waves are mainly seen. There are three components in QRS complexes, and T waves have symmetrical positive and negative waves.
Figure 3.
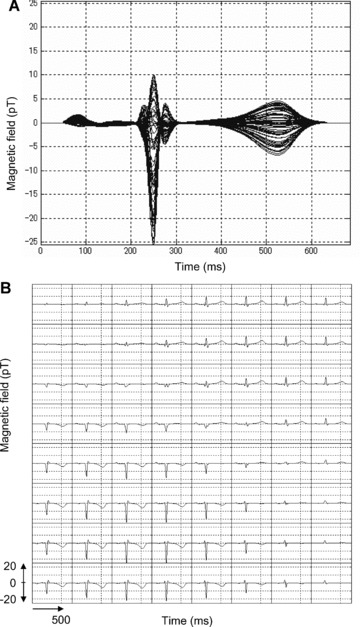
Template MCG waveforms: (A) 64 overlapping template waveforms in one trace, (B) grid map waveforms corresponding to sensor position on heart.
MCG‐template waveforms obtained from each sensor position are plotted in Figure 3B. Positive waves of the QRS complex and T wave appear in the upper right‐hand waveforms (upper‐left side of human body), and negative waves of the QRS complex and T wave are shown in the lower left‐hand waveforms (lower‐right side of human body). The positive P waves appear in the center‐to‐upper position of the sensor measurement area.
Definition of Six Regions (M1, M2, M3, M4, M5, and M6) and Features of MCG‐Template Waveforms
Using Figure 3B, a detailed waveform feature is investigated. As a result, six regions: M1, M2, M3, M4, M5, and M6, which are identified by the QRS‐waveform pattern in the template MCG, are defined, as shown in Figure 4. These regions are convenient for understanding the relationships among the heart regions. M1 indicates right atrium, M2 indicates septum and left ventricle, M3 indicates upper‐left ventricle, M4 indicates right ventricle, M5 indicates apex and lower‐left ventricle, and M6 indicates side wall of left ventricle.
Figure 4.
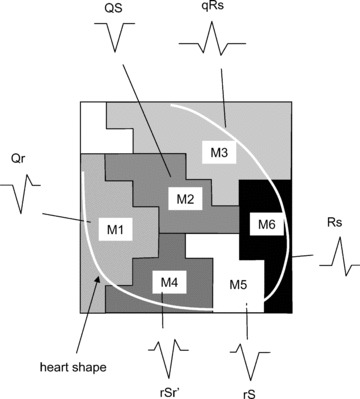
Classification of six regions. M1 indicates right atrium, M2 indicates septum and left ventricle, M3 indicates upper‐left ventricle, M4 indicates right ventricle, M5 indicates apex and lower‐left ventricle, and M6 indicates side wall of left ventricle. Typical QRS waveform shapes are shown.
In each region, a typical feature of waveforms in each P, QRS, and T wave is observed. These features are summarized in Table 2. A dominant waveform of the P wave in all regions is the positive two‐phase wave, which means that the first wave is positive, and the next wave is a small negative wave. In the QRS complex, the dominant waves in M3 and M6 are positive, and in the others (M1, M2, M4, and M5), the dominant waves are negative with a symmetrical shape that has a center line, that is, borderline between two areas. The T‐wave waveform has a simple pattern: negative and positive waves. The symmetrical pattern is similar to that of the QRS complex, as mentioned.
Table 2.
Waveforms in Each Region
| P | QRS | ||||
|---|---|---|---|---|---|
| M1 | Upper: positive two‐phase wave |

|
Qr |

|
Negative wave 
|
| Lower: negative two‐phase wave |

|
– | |||
| M2 | Positive two‐phase wave |

|
QS |

|
– |
| M3 | Positive two‐phase wave |

|
qRs |

|
Positive wave 
|
| M4 | Upper: positive two‐phase wave |

|
rSr′ |

|
Negative wave 
|
| Lower: negative two‐phase wave |

|
||||
| Lower right: negative wave |

|
||||
| M5 | Almost positive two‐phase wave |

|
rS |

|
Negative wave 
|
| Lowest: negative wave |

|
||||
| M6 | Almost positive two‐phase wave |

|
Rs |

|
Positive wave 
|
| Lowest: negative wave |

|
Positive two‐phase wave means that first large wave is positive and next small wave is negative. Negative two‐phase wave means that first large wave is negative and next small wave is positive. In the table, sample waveforms are drawn.
Current Distribution in Heart
P Wave
In Figure 5A, a positive P wave is enclosed in a time window. The window indicates a time slice of data plotted in Figure 5B.
Figure 5.
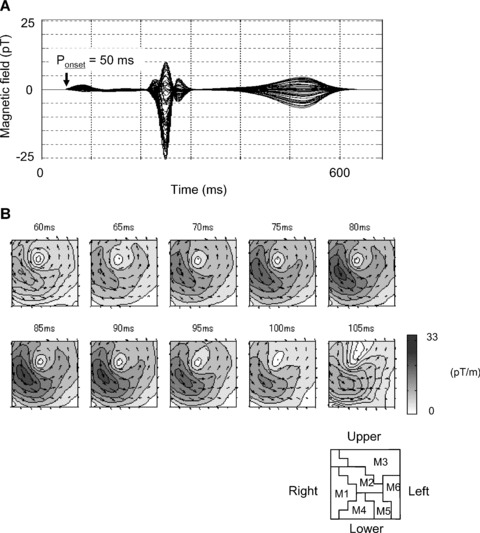
(A) Sixty‐four overlapped MCG waveforms. Time window indicates P‐wave activation time. (B) CAMs in P wave. Current arrow flows to lower‐left side (from right atrium to apex).
The main activation in CAMs of a P wave appears in the lower right chest (M1 region), as shown in Figure 5B. The current arrow propagates toward the lower left above the right atrium (M1 region). In the template P wave, the left atrium activation is not observed.
QRS Complex
The QRS‐complex CAMs consist of three phases: Q, R, and S, which are confirmed in QRS waveforms, as shown in Figure 6A. The window indicates a time slice of data plotted in Figure 6B.
Figure 6.
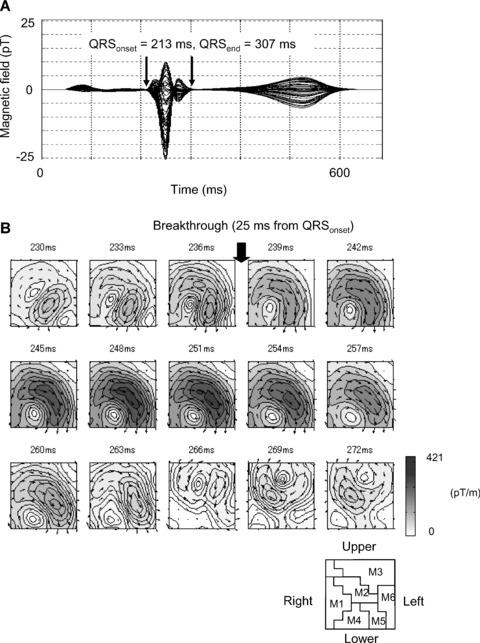
(A) Sixty‐four overlapped MCG waveforms. Time window indicates QRS wave activation time. (B) CAM in QRS complex.
In the CAMs of the first Q wave from 230 to 236 ms, in Figure 6B, a weak current arrow with lower‐right direction appears in the lower left chest (lower position in M2 and position in M4 or M5). The activation indicates a septal vector from the left to right ventricle.
After 236 ms, the activation changes dynamically. The changing time of 238 ms (after the 25 ms from the QRS onset) indicates “breakthrough.” In the R wave from 239 to 263 ms, there is a large left ventricular activation with the main current flow toward the apex, which is located in M2 and M5. The CAM of the R wave has a current that starts from the middle right, flows across the center, and flows down along the left, which is produced by a combination of activations in M2 and M5, as shown in the CAM of 239–254 ms in Figure 6B. The last weak activation with an upper‐right direction of a template Q wave appears in the center right chest (lower‐right position in M2 or left position in M1).
T Wave
A positive and negative T wave is enclosed in a time window in Figure 7A. The data are plotted in Figure 7B.
Figure 7.
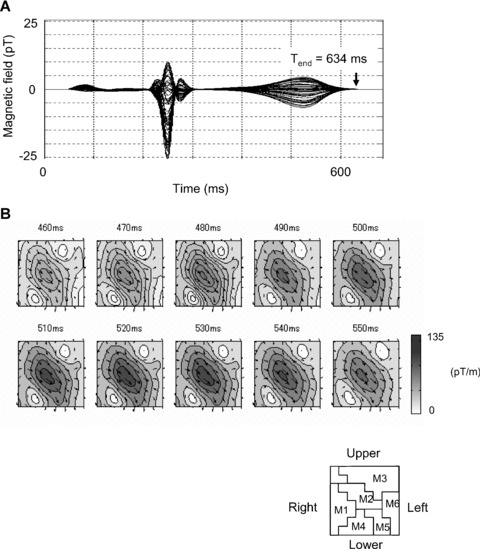
CAMs in T wave. The main current pointing in lower‐left direction appears in the center of measurement region M2 during the T wave.
A time‐sequence CAM of the T wave from 402 to 492 ms is shown in Figure 7B. The main current flows toward the apex (lower‐left direction), and this pattern is almost similar to that during the activation. The main current arrow is located in M2.
These features of the current‐arrow direction in each region are summarized in Table 3. Using Table 3, abnormalities in current arrows can be explained when patients with heart disease are measured.
Table 3.
List of Current Distributions in Each Region
| P | QRS | T | |||
|---|---|---|---|---|---|
| Q | R | S | |||
| M1 | To lower left 
|
– | – | To upper right 
|
– |
| M2 | – | To lower right 
|
To lower left 
|
To upper right 
|
To lower left 
|
| M3 | – | – | – | – | – |
| M4 | – | To lower right 
|
– | – | – |
| M5 | – | To lower right 
|
To lower left 
|
– | – |
| M6 | – | – | – | – | – |
Sample current‐arrow directions are drawn.
DISCUSSION
Typical MCG waveforms show similar morphological features as the ECG such as P, QRS, T waves because the MCG and ECG data are derived from the same current source. However, the MCG is more sensitive to tangential currents in the heart than ECG. The high sensitivity has made it possible to detect the abnormal currents of the patients with long QT syndrome, 12 atrial flutter, 13 and Brugada syndrome. 14 , 16 , 17 The patients with coronary artery disease can also be detected with high sensitivity. 25 , 26 Although there are a lot of new MCG findings by the comparison of patients group and normal group, it is not sufficient to understand the normal MCG features based on the large population because clinical MCG is in an initial stage.
The MCG received manufacturing approval in Japan from the Ministry of Health and Welfare in December 2002. The approval was the first in the world. Because of insufficient utilization since the approval, we need to know the normal MCG features. Therefore, we focus on making the template MCG in this article.
Template MCG waveforms, which reflect the normal MCG features, were produced to determine an average shape in MCG‐waveform morphology using a new method based on MCG features. This simple method was applied to produce templates because conductivities of organs have little effect on MCG signals. The magnetic sensor position was always maintained by a fixed arrangement of the magnetic sensor. If this simple method of analyzing MCG morphology is improved, such as updating the ECG template, 18 types of cardiac disease could be automatically distinguished.
Using the template QRS waveforms, measurement sensor areas are classified into six regions (M1, M2, M3, M4, M5, and M6). The classification enables easily writing reports about the features of waveforms and current arrow distributions in each wave, that is, P, QRS, and T wave.
The CAM patterns of a template MCG of each wave (5, 6, 7) are very similar to the reconstruction result obtained using a Fourier transform analysis. 3 Furthermore, our template P‐wave CAM pattern is close to the P‐wave CAM pattern reported by Dr. Sato, which was produced using MCG data of 20 normal control people. 11 Dr. Sato has reported that 12 cases out of 20 subjects exhibit weak left‐atrium activation along with a large right‐atrium activation in the front measurement plane. However, our template CAM pattern obtained from frontal measurements cannot visualize a left‐atrium electrical activation. The difference in the appearance of the visualization of the left atrium may be caused by the number of subjects. On the other hand, the left‐atrium electrical activation (and back of ventricular activation) is observed from the back. 10 , 11 , 19 Recently, a three‐dimensional activation image using both front and back MCG data was reconstructed, and each atrium was individually visualized. 19 Therefore, the authors considered that the significant atrium activation in front is right‐atrium activation.
The “breakthrough” time (25 ms) in template MCG was determined in CAM pattern of the QRS complex. The breakthrough, which reflects an excitation in front to the right ventricular epicardium, was found in 1963 by body surface potential mapping (BSPM). 22 The time of MCG is almost the same value as breakthrough time (29.2 ± 4.3 ms) in BSPM. 23 The “breakthrough” time in MCG is important to understand a dynamical ventricular excitation change in QRS complex.
MCG data, which were obtained by 64‐channel coaxial gradiometers, 9 were used to produce the template MCG in this study. However, different types of sensors, such as tangential gradiometers, 21 may be used. If a different sensor arrangement is given, our template MCG data may be transformed to a new type of data using a transformation technique 20 based on solving an inverse problem.
In this study, template MCG waveforms were made from a simple signal‐processing procedure including shortening or lengthening and normalization techniques. The templates were produced by averaging MCG data of 464 normal control subjects after the signal‐processing procedure. Using the template MCG waveforms, six regions (M1, M2, M3, M4, M5, and M6) were defined in a simple classification. Features of the waveform and current distribution of normal control subjects in each region were identified using the templates. Therefore, these regions enable cardiologists to easily understand the position in the heart and write reports. In conclusion, the produced template MCG may become standard MCG data used to determine abnormalities in patients with cardiac disease.
Study Limitations
In this study, we have not studied MCG templates obtained from the back. Therefore, we cannot create a database of measurements or templates. We need to study MCG data obtained from the back.
Acknowledgments
Acknowledgments: We gratefully thank Satsuki Yamada of the Mayo Clinic and Keiji Tsukada of Okayama University for their helpful comments. We are also grateful to Shigeaki Naito, Toru Okihara, Hiroki Ihara, and Hiroyuki Suzuki of Hitachi High Technologies for planning the MCG measurements.
REFERENCES
- 1. Hämäläinen MS, Ilmoniemi RJ. Interpreting magnetic fields of the brain: Minimum norm estimates. Med Biol Eng Comput 1994;32:35–42. [DOI] [PubMed] [Google Scholar]
- 2. Killmann R, Jaros GG, Wach P, et al Localisation of myocardial ischaemia from the magnetocardiogram using current density reconstruction method: Computer simulation study. Med Biol Eng Comput 1995;33:643–651. [DOI] [PubMed] [Google Scholar]
- 3. Kandori A, Tsukada K, Haruta Y, et al Reconstruction of two‐dimensional current distribution from tangential MCG measurement. Phys Med Biol 1996;41:1705–1716. [DOI] [PubMed] [Google Scholar]
- 4. Wach P, Tilg B, Lafer G, et al Magnetic source imaging in the human heart: Estimating cardiac electrical sources from simulated and measured magnetocardiogram data. Med Biol Eng Comput 1997;35:157–166. [DOI] [PubMed] [Google Scholar]
- 5. Cohen D, Chandler L. Measurements and a simplified interpretation of magnetocardiograms from humans. Circulation 1969;39:395–402. [DOI] [PubMed] [Google Scholar]
- 6. Hosaka H, Cohen D. Visual determination of generators of the magnetocardiogram. J Electrocardiol 1976;9:426–432. [DOI] [PubMed] [Google Scholar]
- 7. Nakaya Y, Sumi M, Saito K, et al Analysis of current source of the heart using isomagnetic and vector arrow maps. Jpn Heart J 1984;25:701–711. [DOI] [PubMed] [Google Scholar]
- 8. Nomura M, Fujino K, Katayama M, et al Analysis of the T wave of the magnetocardiogram in patients with essential hypertension by means of isomagnetic and vector arrow maps. J Electrocardiol 1988;21:174–182. [DOI] [PubMed] [Google Scholar]
- 9. Tsukada K, Kandori A, Miyashita T, et al A simplified superconducting interference device system to analyze vector components of a cardiac magnetic field. Proc 20th Int Conf IEEE/EMBS (Hong Kong) 1998;524–527.
- 10. Tsukada K, Mitsui T, Terada Y, et al Noninvasive visualization of multiple simultaneously activated regions on torso magnetocardiographic maps during ventricular depolarization. J Electrocardiol 1999;32:305–313. [DOI] [PubMed] [Google Scholar]
- 11. Sato M, Terada Y, Mitsui T, et al Visualization of atrial excitation by magnetocardiogram. Int J Cardiovasc Imaging 2002;18:305–312. [DOI] [PubMed] [Google Scholar]
- 12. Kandori A, Shimizu W, Yokokawa M, et al Detection of spatial repolarization abnormalities in patients with LQT1 and LQT2 forms of congenital long‐QT syndrome. Physiol Meas 2002;23:603–614. [DOI] [PubMed] [Google Scholar]
- 13. Yamada S, Tsukada K, Miyashita T, et al Noninvasive, direct visualization of macro‐reentrant circuits by using magnetocardiograms: Initiation and persistence of atrial flutter. Europace 2003;5:343–350. [DOI] [PubMed] [Google Scholar]
- 14. Kandori A, Shimizu W, Yokokawa M, et al Identifying patterns of spatial current dispersion that characterize and separate the Brugada syndrome and complete right‐bundle branch block. Med Biol Eng Comput 2004;42:236–244. [DOI] [PubMed] [Google Scholar]
- 15. Yamada S, Yamaguchi I. Magnetocardiograms in clinical medicine: Unique information on cardiac ischemia, arrhythmias, and fetal diagnosis, internal medicine 2005;44:1–19. [DOI] [PubMed] [Google Scholar]
- 16. Kandori A, Miyashita T, Ogata K, et al Electrical space‐time abnormalities of ventricular depolarization in patients with Brugada syndrome and patients with complete right‐bundle branch blocks studied by magnetocardiography. Pacing Clin Electrophysiol 2006;29:15–20. [DOI] [PubMed] [Google Scholar]
- 17. Kandori A, Miyashita T, Ogata K, et al Magnetocardiography study on ventricular depolarization‐current pattern in patients with Brugada syndrome and complete right‐bundle branch blocks. Pacing Clin Electrophysiol 2006;29:1359–1367. [DOI] [PubMed] [Google Scholar]
- 18. Compton SJ, Merrill JJ, Dorian P, et al Continuous template collection and updating for electrogram morphology discrimination in implantable cardioverter defibrillators. Pacing Clin Electrophysiol 2006;29:244–254. [DOI] [PubMed] [Google Scholar]
- 19. Ogata K, Kandori A, Miyashita T, et al Visualization of three‐dimensional cardiac electrical excitation using standard heart model and anterior and posterior magnetocardiogram. Int J Cardiovasc Imaging 2006;22:581–593. [DOI] [PubMed] [Google Scholar]
- 20. Burghoff M, Nenonen J, Trahms L, et al Conversion of magnetocardiographic recordings between two different multichannel SQUID devices. IEEE Trans BME 2000;47:869–875. [DOI] [PubMed] [Google Scholar]
- 21. Lee Y‐H, Kim J‐M, Kim K, et al 64‐channel magnetocardiogram system based on double relaxation oscillation SQUID planar gradiometers. Supercond Sci Technol 2006;19:S284–S288. [Google Scholar]
- 22. Taccardi B. Distribution of heart potentials on the thoracic surface of normal human subjects. Circ Res 1963;12:341–352. [DOI] [PubMed] [Google Scholar]
- 23. Kinoshita A, Ohta T, Hirai M, et al Body surface isopotential maps of normal Japanese children. Jpn Circ J 1984;48:484–91. [DOI] [PubMed] [Google Scholar]
- 24. Kandori A, Ogata K, Watanabe Y, et al Space‐time database for standardization of adult magnetocardiogram. Pacing Clin Electrophysiol 2008;31:422–431. [DOI] [PubMed] [Google Scholar]
- 25. Hailer B, Van Leeuwen P, Chaikovsky I, et al The value of magnetocardiography in the course of coronary intervention. Ann Noninvasive Electrocardiol 2005;10:188–196. [DOI] [PMC free article] [PubMed] [Google Scholar]
- 26. Tolstrup K, Madsen BE, Ruiz JA, et al Non‐invasive resting magnetocardiographic imaging for the rapid detection of ischemia in subjects presenting with chest pain. Cardiology 2006;106:270–276. [DOI] [PubMed] [Google Scholar]


