

Abstract
Background: The aim of this study was to investigate the differences in T‐wave alternans (TWA) and heart rate variability (HRV) among patients with myocardial infarction with or without diabetes mellitus and the relationship between TWA and HRV.
Methods: The study population included 133 patients: 59 patients with myocardial infarction (MI) (group post‐MI without diabetes); 40 myocardial infarction with diabetes (group post‐MI with diabetes); and 34 controls (group control). Cardiac autonomic neuropathy assessment was made using frequency domain (low‐frequency [LF] power, high‐frequency [HF] power, LF/HF) and time domain (SDNN, standard deviation of the averaged normal sinus RR intervals for all 5‐minute segments [SDANN]) of HRV indexes. Both TWA and HRV were measured on the Holter monitor, and TWA was calculated automatically using the time‐domain modified moving average method.
Results: TWA values differed significantly between controls (40 ± 16 μV) and group post‐MI with (62 ± 17 μV, P < 0.05) or without (60 ± 15 μV, P < 0.05) diabetes. In addition, group post‐MI with diabetes had lower standard deviation of all normal sinus RR intervals (SDNN), standard deviation of the averaged normal sinus RR intervals for all 5‐minute segments (SDANN), and HF, indicating depressed vagus nerve activity, and higher LF/HF ratio, indicating elevated sympathetic nerve activity, than controls and group post‐MI without diabetes (P < 0.05). TWA correlated with SDNN and SDANN (r = 0.29, 0.31; P < 0.001).
Conclusions: TWA was elevated in patients following myocardial infarction, both in those with or without diabetes. Myocardial infarction patients had a lower time domain, HF, and a higher LF/HF ratio HRV, especially in those with diabetes. The analysis of modified moving agerage (MMA)‐based TWA and HRV can be a useful tool for identifying post–myocardial infarction patients at high risk of arrhythmic events.
Ann Noninvasive Electrocardiol 2011;16(3):232–238
Keywords: T‐wave alternans, heart rate variability, myocardial infarction, diabetes, cardiac autonomic neuropathy
T‐wave alternans (TWA) and heart rate variability (HRV) are useful tools for predicting sudden cardiac death. Microvolt TWA induced by exercise testing, pacing, defibrillator electrogram, or daily activities identifies patients at increased risk of arrhythmia events or sudden cardiac death. TWA represents an increased heterogeneity of ventricle repolarization on a beat‐to‐beat basis, and may provide a substrate for reentry. 1 , 2 , 3 , 4 , 5 , 6 , 7 , 8 Currently, there are both frequency domain and time domain based analysis methods of determining TWA. Our study used a time domain–based method and a modified moving average to analyze Holter‐monitoring TWA. 9 , 10 , 11 , 12
HRV is a beat‐to‐beat variation in cardiac cycle length resulting from autonomic influence on the sinus node of patients in sinus rhythm. HRV in time and frequency domains is a noninvasive index of the heart autonomic function, 13 and represents one of the most promising quantitative markers of autonomic activity. 14 Evidence suggests that decreased HRV is associated with increased ventricular arrhythmias and mortality. The aim of this study was to evaluate TWA and HRV in myocardial infarction patients with and without diabetes, and the relationship between TWA and HRV.
METHODS
Patient Population
One hundred thirty‐three screened patients included 59 with myocardial infarction (group post‐MI without diabetes), 40 myocardial infarction with diabetes (group post‐MI with diabetes), and 34 controls (group control) who had similar age and sex distribution to post‐MI with or without diabetes subjects. Group control included patients with palpitations who underwent Holter ECG examination but were proven negative for ventricular tachyarrhythmias, or organic heart disease by various noninvasive tests, such as 12‐lead standard resting electrocardiogram (ECG), conventional echocardiographic, treadmill exercise test, and so on. All myocardial infarction patients were randomly selected from myocardial infarction cases in the cardiovascular care unit of our hospital. The patients had 24‐hour Holter monitoring 1–3 weeks after hospitalization. The myocardial infarction diagnosis was based on clinical course, serum creatinine kinase levels, and electrocardiogram findings of ST‐segment elevation or a history of myocardial infarction. Diabetes mellitus was defined as a morning‐fasting glucose of ≥126 mg/dL, hemoglobin A1c ≥6.5%, or use of medication. Written informed consent was obtained from each patient before enrollment. All study subjects underwent a full clinical examination and history, from which any concurrent diseases and medication were recorded. Patients with atrial flutter or fibrillation, a cardiac pacemaker, atrioventricular block or bundle branch block, frequent extrasystoles, severe hepatic, or renal diseases were excluded. Patients undergoing antiarrhythmic pharmacotherapy other than beta‐blockers were also excluded from participation as these drugs influence repolarization abnormalities.
T‐Wave Alternans
Analyses of modified moving average‐based TWA and HRV were performed using the MARS PC system (GE Healthcare Inc., Milwaukee, WI, USA) with running software version 7.03. TWA was analyzed from three channel records (V1; NASA, V3; CM3, V5; CM5) using ambulatory Holter monitoring, measured at maximum heart rates (<120 beats/min). The MARS PC software identified periods of possible TWA using the modified moving average algorithm, a time domain‐based method that bifurcates the beat stream and generates separate moving average templates for odd versus even beats. 10 Average values were updated by a weighting factor of one‐eighth difference between the ongoing average and the current pair of beats. TWA magnitude was analyzed as a continuous variable and determined for each 15 seconds of data. An additional algorithm minimized the effects of noise and artifacts, and noise levels of 20 μV were adopted in the system configuration. We had overread and verify reported TWA values using the templates, which aid critical recognition of contamination of TWA values by noise or artifact. Manual editing was performed if the data were ineligible due to noise or artifacts. The maximum TWA value was defined as the highest TWA value in either channel. In our study, TWA > 47 μV was considered positive, according to previous reports. 15 , 16 , 17
Heart Rate Variability
HRV was determined from 24‐hour Holter records, using two time domain measures: standard deviation of all normal sinus RR intervals during a 24‐hour period (SDNN) and standard deviation of the averaged normal sinus RR intervals for all 5‐minute segments (SDANN); and two frequency domain analysis estimates respiratory‐dependent high‐frequency (HF) and low‐frequency (LF) power through spectral analysis. HF(0.15–0.4 Hz) power is considered to be mediated mainly by vagal activity, while LF (0.04–0.15 Hz) power has been suggested as predominantly sympathetic modulation. The LF/HF ratio, which is calculated by dividing LF value by HF value to provide a unit‐less ratio, is a marker of sympathetic nerve activity. 18 , 19 Evidence suggests that decreased time domain and HF HRV is associated with increased ventricular arrhythmias and mortality. In the literature, the 70 ms cutoff for SDNN was considered positive. 20
Statistical Analysis
SSPS version 12.0 (SPSS Inc., Chicago, IL, USA) was used for statistical analysis. Data are expressed as mean ± standard deviation for continuous variables. Continuous variables of baseline data were examined by Student's t‐test. A P value < 0.05 was considered significant. Linear correlation was estimated by the Pearson product‐moment correlation coefficient.
RESULTS
There were no significant differences among the three groups in past medical history, age, hypertension, and laboratory data. The left ventricular‐diastolic dimension and ejection fraction differed significantly between controls and group post‐MI with or without diabetes. There were no differences between group post‐MI with or without diabetes in the sites of infarction or the coronary revascularization procedure. Group post‐MI with diabetes had lower SDNN, SDANN, HF than controls, and group post‐MI without diabetes (P < 0.05) (Table 1).
Table 1.
Characteristics of Enrolled Patients and Heart Rate Variability Indexes
| Group Post‐MI without Diabetes (N = 59) | Group Post‐MI with Diabetes (N = 40) | Group Control (N = 34) | P‐Value | |
|---|---|---|---|---|
| Men | 61.1% | 67.5% | 61.7% | P > 0.05 |
| Age | 58 ± 19 | 60 ± 18 | 56 ± 16 | P = 0.06 |
| Hypertension | ||||
| SBP at rest (mmHg) | 135 ± 25 | 134 ± 20 | 133 ± 18 | P = 0.12 |
| DBP at rest (mmHg) | 75 ± 14 | 76 ± 13 | 73 ± 16 | P = 0.17 |
| Site of infarction | ||||
| Anterior | 18 (18/59) | 13 (13/40) | ‐ | P = 0.84 |
| Lateral | 19 (19/59) | 14 (14/40) | ‐ | P = 0.77 |
| Inferior | 22 (22/59) | 13 (13/40) | ‐ | P = 0.63 |
| Coronary intervention | 51 (51/59) | 31 (31/40) | ‐ | P = 0.36 |
| Coronary bypass surgery | 2 (2/59) | 4 (4/40) | ‐ | P = 0.36 |
| Echocardiographic findings | ||||
| Ejection fraction (%) | 45 ± 12 | 43 ± 10 | 60 ± 16 | P < 0.05a |
| LVDd (mm) | 55 ± 9 | 62 ± 6 | 54 ± 8 | P < 0.05b |
| HRV indexes | ||||
| SDNN (ms) | 102 ± 21a | 86 ± 13a b | 126 ± 28 | P < 0.05 |
| SDANN (ms) | 103 ± 11a | 90 ± 15a b | 122 ± 18 | P < 0.05 |
| LF power (ms) | 19 ± 4 | 16 ± 3a | 25 ± 10 | P < 0.05 |
| HF power (ms) | 13 ± 2a | 9 ± 3a b | 17 ± 7 | P < 0.05 |
| LF/HF | 1.43 ± 0.50 | 2.40 ± 0.43 | 1.27 ± 0.41 | P < 0.05b |
aGroup post‐MI with or without diabetes versus group control, P < 0.05; bGroup post‐MI without diabetes versus group post‐MI with diabetes, P < 0.05. SBP = systolic blood pressure; DBP = diastolic blood pressure; LVDd = left ventricular‐diastolic dimension; SDNN = standard deviation of all normal sinus RR intervals during a 24‐hour period; SDANN = standard deviation of the averaged normal sinus RR intervals for all 5‐minute segments; LF = low‐frequency power; HF = high‐frequency power.
Of the three groups, the highest TWA values were found, as expected, in group post‐MI with diabetes (62 ± 17 μV), while the lowest were found in group control (40 ± 16 μV) (P < 0.05). There was also a significant difference in TWA values between group control and group post‐MI without diabetes (60 ± 15 μV). There was not, however, a difference in TWA values between groups post‐MI with or without diabetes (Fig. 1).
Figure 1.
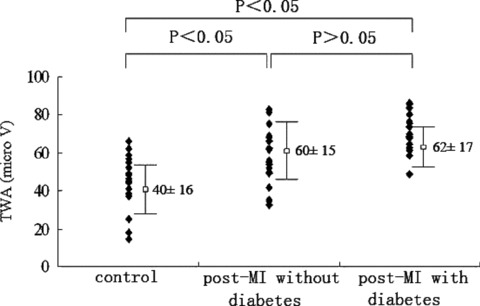
T‐wave alternans values in the three groups: highest in group post‐MI with diabetes and lowest in group control. Significant differences were observed among the groups by multiple comparisons.
With regard to positive results of TWA and HRV, group post‐MI with diabetes had the highest association of positive results for both TWA (P < 0.05) and HRV (P < 0.01), compared with group control the lowest (Table 2).
Table 2.
Positive Results of T‐Wave Alternans and Heart Rate Variability
| Group Post‐MI without Diabetes (N = 59) | Group Post‐MI with Diabetes (N = 40) | Group Control (N = 34) | P‐Value | |
|---|---|---|---|---|
| TWA (TWA > 47 μV) | 42 (71.19%) | 28 (70.00%) | 2 (5.88%) | P < 0.05a b |
| SDNN (SDNN < 70 ms) | 35 (59.32%) | 25 (62.50%) | 4 (11.76%) | P < 0.05a P < 0.01b |
aGroup post‐MI without diabetes versus group control; bGroup post‐MI with diabetes versus group control. TWA = T‐wave alternans; HRV = heart rate variability; SDNN = standard deviation of all normal sinus RR intervals.
We analyzed the relationship between TWA and HRV indexes (SDNN, SDANN, HF, and LF).TWA and HRV were moderately correlated. Our date showed that TWA is correlated with SDNN (r = 0.29, P < 0.001) and SDANN (r = 0.31, P < 0.001) (Fig. 2).
Figure 2.
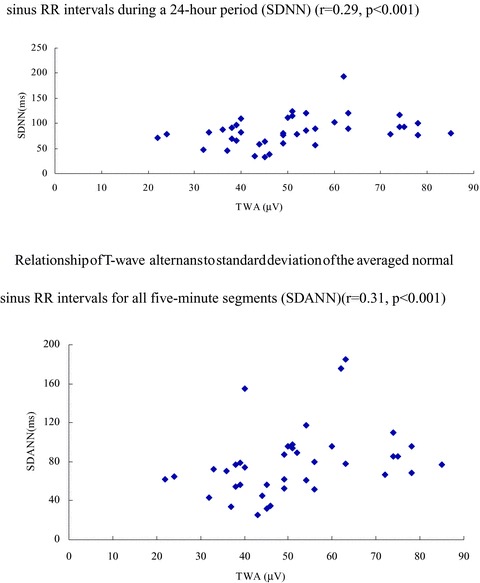
Relationship of T‐wave alternans to standard deviation of all normal sinus RR intervals during a 24‐hour period (SDNN) (r = 0.29, P < 0.001). Relationship of T‐wave alternans to standard deviation of the averaged normal sinus RR intervals for all 5‐minute segments (SDANN) (r = 0.31, P < 0.001).
DISCUSSION
TWA and HRV are useful tools for predicting sudden cardiac death. We observed that TWA was elevated in patients following myocardial infarction, both in those with and without diabetes. And myocardial infarction patients with or without diabetes had higher association of positive results for TWA and HRV. Between TWA and HRV existed the moderate level of correlation.
Our study used a time domain‐based method and a modified moving average to analyze Holter‐monitoring TWA. MMA analysis of TWA has previously been used with ambulatory ECGs to stratify arrhythmia risk in post‐MI patients. Using a nested case‐control approach, Verrieret al. 15 analyzed the ambulatory ECGs of patients enrolled in Autonomic Tone and Reflexes After Myocardial Infarction (ATRAMI) multicenter study. These differences in TWA values between cases and controls translated into a 4‐ to 7‐fold higher odds of life‐threatening arrhythmias predicted by TWA level above the 75th percentile of TWA values in control subjects. Maeda et al. 21 performed a retrospective analysis of 63 consecutive patients who underwent MMA‐based Holter‐TWA. Using a logistic regression model, TWA yielded an odds ratio (OR) of 4.9 (95% confidence interval: 1.2–19.6, P < 0.05), which was the only significant covariate for the incidence of life‐threatening ventricular arrhythmias during a mean follow‐up of 72 months.
Our data showed that myocardial infarction patients with or without diabetes have higher TWA values than controls. In our study, TWA was moderate correlated with SDNN and SDANN, and seemed to be associated with the sympathetic component of the autonomic nervous system. Autonomic nervous system dysfunction is associated with an increased risk of mortality in patients with diabetes and survivors of myocardial infarction. 22 , 23 Mitrani et al. 24 performed cardiac I‐123‐metaiodobenzylguanidine (MIBG) and thallium‐201 single‐photon emission computed tomographic (SPECT) scans at rest in patients, with cardiomyopathy, left ventricular hypertrophy, or a structurally normal heart who presented with monomorphic or polymorphic ventricular tachycardia. These scans were compared with scans in control patients without ventricular tachycardia who had cardiomyopathy or a structurally normal heart. Cardiac sympathetic denervation was defined as myocardial areas having thallium uptake with reduced or absent I‐123‐MIBG uptake. They found that an MIBG defect, which reflects regional sympathetic denervation, occurs frequently in patients with ventricular tachycardia caused by nonischemic heart disease (NIHD). In addition, Harada et al. 25 reported that patients with a positive TWA in NIHD had low heart‐to‐mediastinum ratios and high washout rate, and that cardiac sympathetic denervation and accelerated sympathetic nervous activity both play a role in the development of microvolt‐level TWA. The Hoorn Study 26 found increased mortality in adults with diabetes mellitus who had decreased cardiovascular autonomic function. Schwartz et al. 27 reported a close relationship between TWA and the cardiac sympathetic nervous system, and that the appearance of TWA with syncope could be repeated with effort and fright stimuli in patients with long QT syndrome.
In the previous, the presence of diabetes (DM) is associated with an increased risk of sudden cardiac death. 28 , 29 Nieminen et al. 16 found a significant increase in TWA among diabetics in the Finnish Cardiovascular Study (FINCAVAS) population. They tested in 1037 consecutive patients in the FINCAVAS. The prevalence of diabetes mellitus was the only parameter that differed among the groups with statistical significance of P = 0.04. Molon et al. 30 have shown that in patients with DM and no known cardiovascular disease, abnormal TWA prevalence was similar to that found in the present study. TWA positivity is common (approximately 20%) and is closely correlated with glycaemic control. Jouven et al. 31 conducted a population‐based case‐control study at Group Health Cooperative. Cases (n = 2040) experienced out‐of‐hospital cardiac arrest due to heart disease. They observed progressively higher risk of SCD associated with borderline diabetes (OR = 1.24 [0.98–1.57]), diabetes without microvascular disease (OR = 1.73 [1.28–2.34]), and diabetes with microvascular disease (OR = 2.66 [1.84–3.85]), after adjustment for potential confounders (P‐value for trend, 0.001). Higher glucose levels were also associated with the risk of sudden cardiac death both in the absence and in the presence of microvascular disease.
HRV is a noninvasive index of the autonomic function of the heart. Our data show that myocardial infarction patients with or without diabetes have a lower time domain, HF, and a higher LF/HF ratio HRV than controls. Some studies 32 , 33 , 34 have also shown that a decreased HRV can indicate an increased risk of arrhythmic events and an increased mortality rate in patients with a previous myocardial infarction.
In conclusion, the present results indicate that patients with myocardial infarction, especially those complicated with diabetes, have a high risk of life‐threatening ventricular arrhythmias possibly because of increased repolarization heterogeneity and abnormal autonomic function. Combined analysis using MMA‐based TWA and HRV may be an easy and useful method of predicting patients at high risk for such arrhythmic events.
REFERENCES
- 1. Pastore JM, Girouard SD, Laurita KR, et al Mechanism linking T‐wave alternans to the genesis of cardiac fibrillation. Circulation 1999;99:1385–1394. [DOI] [PubMed] [Google Scholar]
- 2. Rosenbaum DS, Jackson LE, Smith JM, et al Electrical alternans and vulnerability to ventricular arrhythmias. N Engl J Med 1994;330:235–241. [DOI] [PubMed] [Google Scholar]
- 3. Bloomfield DM, Steinman RC, Namerow PB, et al Microvolt T‐wave alternans distinguishes between patients likely and patients not likely to benefit from implanted cardiac defibrillator therapy: A solution to the Multicenter Automatic Defibrillator Implantation Trial (MADIT) II conundrum. Circulation 2004;110:1885–1889. [DOI] [PubMed] [Google Scholar]
- 4. Narayan SM. T‐wave alternans and the susceptibility to ventricular arrhythmias. J Am Coll Cardiol 2006;47:269–281. [DOI] [PubMed] [Google Scholar]
- 5. Ikeda T, Sakata T, Takami M, et al Combined assessment of T‐wave alternans and late potentials used to predict arrhythmic events after myocardial infarction: A prospective study. J Am Coll Cardiol 2000;35:722–730. [DOI] [PubMed] [Google Scholar]
- 6. Ikeda T, Saito H, Tanno K, et al T‐wave alternans as a predictor for sudden cardiac death after myocardial infarction. Am J Cardiol 2002;89:79–82. [DOI] [PubMed] [Google Scholar]
- 7. Ikeda T, Yoshino H, Sugi K, et al Predictive value of microvolt T‐wave alternans for sudden cardiac death in patients with preserved cardiac function after acute myocardial infarction: Results of a collaborative cohort study. J Am Coll Cardiol 2006;48:2268–2274. [DOI] [PubMed] [Google Scholar]
- 8. Kim JW, Pak HN, Park JH, et al Defibrillator electrogram T wave alternans as a predictor of spontaneous ventricular tachyarrhythmias in defibrillator recipiensts. Circ J 2009;73:55–62. [DOI] [PubMed] [Google Scholar]
- 9. Zipes DP, Camm AJ, Borggrefe M, et al ACC/AHA/ESC 2006 Guidelines for Management of Patients With Ventricular Arrhythmias and the Prevention of Sudden Cardiac Death: A report of the American College of Cardiology American Heart Association Task Force and the European Society of Cardiology Committee for Practice Guidelines (writing committee to develop Guidelines for Management of Patients With Ventricular Arrhythmias and the Prevention of Sudden Cardiac Death): Developed in collaboration with the European Heart Rhythm Association and the Heart Rhythm Society. Circulation 2006;114:e385–e484. [DOI] [PubMed] [Google Scholar]
- 10. Nearing BD, Verrier RL. Modified moving average analysis of T‐wave alternans to predict ventricular fibrillation with high accuracy. J Appl Physiol 2002;92:541–549. [DOI] [PubMed] [Google Scholar]
- 11. Stein PK, Sanghavi D, Domitrovich PP, et al Ambulatory ECG‐based T‐wave alternans predicts sudden cardiac death in high‐risk post‐MI patients with left ventricular dysfunction in the EPHESUS study. J Cardiovasc Electrophysiol 2008;10:1037–1042. [DOI] [PubMed] [Google Scholar]
- 12. Sakaki K, Ikeda T, Miwa Y, et al Time‐domain T‐wave alternans measured from Holter electrocardiograms predicts cardiac mortality in patients with left ventricular dysfunction: A prospective study. Heart Rhythm 2009;6:332–337. [DOI] [PubMed] [Google Scholar]
- 13. Heart rate variability : Standards of measurement, physiological interpretation and clinical use. Task Force of the European Society of Cardiology and the North American Society of Pacing and Electrophysiology. Circulation 1996;93:1043–1065. [PubMed] [Google Scholar]
- 14. Heart rate variability for risk stratification of life‐threatening arrhythmias . American College of Cardiology Cardiovascular Technology Assessment Committee. J Am Coll Cardiol 1993;22:948–950. [DOI] [PubMed] [Google Scholar]
- 15. Verrier RL, Nearing BD, La Rovere MT, et al Ambulatory electrocardiogram‐based tracking of T‐wave alternans in postmyocardial infarction patients to assess risk of cardiac arrest or arrhythmic death. J Cardiovasc Electrophysiol 2003;14:705–711. [DOI] [PubMed] [Google Scholar]
- 16. Nieminen T, Lehtimaki T, Viik J, et al T‐wave alternans predict mortality in a population undergoing a clinically indicated exercise test. Eur Heart J 2007;28:2332–2337. [DOI] [PubMed] [Google Scholar]
- 17. Stein P, Sanghavi D, Domitrovich PP, et al Ambulatory ECG‐based T‐wave alternans predicts sudden cardiac death in high‐risk post‐MI patients with left ventricular dysfunction in the EPHESUS study. J Cardiovasc Electrophysio 2008;19:1037–1042. [DOI] [PubMed] [Google Scholar]
- 18. Akselord S, Gordon D, Ubel FA, et al Power spectrum analysis of heart rate fluctuation: A quantitative probe of beat‐to‐beat cardiovascular control. Science 1981;213:220–222. [DOI] [PubMed] [Google Scholar]
- 19. Pomeranz B, Macaulay RJ, Caudill MA, et al Assessment of autonomic function in humans by heart rate spectral analysis. Am J Physiol 1985;248(1 Pt 2):H151–H153. [DOI] [PubMed] [Google Scholar]
- 20. La Rovere MT, Bigger JT Jr, Marcus FI, et al Baroreflex sensitivity and heart‐rate variability in prediction of total cardiac mortality after myocardial infarction. ATRAMI (Autonomic Tone and Reflexes After Myocardial Infarction) Investigators. Lancet 1998;351:478–484. [DOI] [PubMed] [Google Scholar]
- 21. Maeda S, Nishizaki M, Yamawake N, et al Ambulatory ECG‐based T‐wave alternans and heart rate turbulence predict high risk of arrhythmic events in patients with old myocardial infarction. Circ J 2009;73:2223–2228. [DOI] [PubMed] [Google Scholar]
- 22. Ewing DJ, Campbell IW, Clarke BF. The natural history of diabetic autonomic neuropathy. QJM 1980;49:95–108. [PubMed] [Google Scholar]
- 23. Gerritsen J, Dekker JM, TenVoorde BJ, et al Impaired autonomic function is associated with increased mortality, especially in subjects with diabetes, hypertension, or a history of cardiovascular disease: The Hoorn Study. Diabetes Care 2001;24:1793–1798. [DOI] [PubMed] [Google Scholar]
- 24. Mitrani RD, Klein LS, Miles WM, et al Regional cardiac sympathetic denervation in patients with ventricular tachycardia in the absence of coronary artery disease. J Am Coll Cardiol 1993;22:1344–1353. [DOI] [PubMed] [Google Scholar]
- 25. Harada M, Shimizu A, Murata M, et al Relation between microvolt‐level T‐wave alternans and cardiac sympathetic nervous system abnormality using iodine‐123 metaiodobenzylguanidine imaging in patients with idiopathic dilated cardiomyopathy. Am J Cardiol 2003;92:998–1001. [DOI] [PubMed] [Google Scholar]
- 26. Gerritsen J, Dekker JM, TenVoorde BJ, et al Glucose tolerance and other determinants of cardiovascular autonomic function: The Hoorn Study. Diabetologia 2000;43:561–570. [DOI] [PubMed] [Google Scholar]
- 27. Schwartz PJ, Malliani A. Electrical alternation of the T‐wave: Clinical and experimental evidence of its relationship with the sympathetic nervous system and with the long QT syndrome. Am Heart J 1975;89:45–50. [DOI] [PubMed] [Google Scholar]
- 28. Curb JD, Rodriguez BL, Burchfiel CM, et al Sudden death, impaired glucose tolerance, and diabetes in Japanese American men. Circulation 1995;91:2591–2595. [DOI] [PubMed] [Google Scholar]
- 29. El‐Atat FA, McFarlane SI, Sowers JR, et al Sudden cardiac death in patients with diabetes. Curr Diab Rep 2004;4:187–193. [DOI] [PubMed] [Google Scholar]
- 30. Molon G, Targher G, Costa A, et al Measurement of microvolt T‐wave alternans, a new arrhythmic risk stratification test, in type 2 diabetic patients without clinical cardiovascular disease. Diabet Med 2006;23:207–210. [DOI] [PubMed] [Google Scholar]
- 31. Jouven X, Lemaître RN, Rea TD, et al Diabetes, glucose level, and risk of sudden cardiac death. Eur Heart J 2005;26:2142–2147. [DOI] [PubMed] [Google Scholar]
- 32. Bigger JT, Fleiss JL, Steinman RC, et al Frequency domain measures of heart period variability and mortality after myocardial infarction. Circulation 1992;85:164–171. [DOI] [PubMed] [Google Scholar]
- 33. Shehab A, Elnour AA, Struthers AD. Heart rate variability as an indicator of left ventricular systolic dysfunction. Cardiovasc J Afr 2009;20:278–283. [PMC free article] [PubMed] [Google Scholar]
- 34. Ewing DJ, Martyn CN, Young RJ, et al The value of cardiovascular autonomic function tests: 10 years experience in diabetes. Diabetes Care 1985;8:491–498. [DOI] [PubMed] [Google Scholar]