

Abstract
Background: The aim of this study was to compare the reproducibility and sensitivity of four commonly used methods for QT interval assessment when applied to ECG data obtained after infusion of ibutilide.
Methods: Four methods were compared: (1) 12‐lead simultaneous ECG (12‐SIM), (2) lead II ECG (LEAD II), both measured on a digitizing board, (3) 3‐LEAD ECG using a manual tangential method, and (4) a computer‐based, proprietary algorithm, 12SL™ ECG Analysis software (AUT). QT intervals were measured in 10 healthy volunteers at multiple time points during 24 hours at baseline and after single intravenous doses of ibutilide 0.25 and 0.5 mg. Changes in QT interval from baseline were calculated and compared across ECG methods, using Bland–Altman plots. Variability was studied using a mixed linear model.
Results: Baseline QT values differed between methods (range 376–395 ms), mainly based on the number of leads incorporated into the measurement, with LEAD II and 3‐LEAD providing the shortest intervals. The 3‐LEAD generated the largest QT change from baseline, whereas LEAD II and 12‐SIM generated essentially identical result within narrow limits of agreement (0.4 ms mean difference, 95% confidence interval ± 20.5 ms). Variability with AUT (standard deviation 15.8 ms for within‐subject values) was clearly larger than with 3‐LEAD, LEAD II, and 12‐SIM (9.6, 10.0, and 11.3 ms).
Conclusion: This study demonstrated significant differences among four commonly used methods for QT interval measurement after pharmacological prolongation of cardiac repolarization. Observed large differences in variability of measurements will have a substantial impact on the sample size required to detect QT prolongation in the range that is currently advised in regulatory guidance.
Keywords: QT interval, QT prolongation, ECG methodology, ibutilide
Drug‐induced QT interval prolongation and associated proarrhythmias have been a major cause of drug withdrawals during recent years. 1 , 2 Pharmaceutical industry, regulators, and academia have invested numerous resources to improve nonclinical as well as clinical methods to identify cardiac safety issues early in the development of new chemical entities. 3 , 4 , 5 Since 1997, when the European Committee of Proprietary Medicinal Products issued a “points‐to‐consider” document, 5 a practice has evolved under which an increasing proportion of new chemical entities are scrutinized for this effect. In November 2002, the US FDA and Health Canada issued the concept paper. “The Clinical Evaluation of QT/QTc Interval Prolongation and Proarrhythmic Potential for Non‐antiarrhythmic Drugs” that outlines and provides guidance to the pharmaceutical industry on this topic. 3 This article has now entered the ICH (International Conference on Harmonization of Technical Requirements for Registration of Pharmaceuticals for Human Use) harmonization process, which confirmed that all new drugs should undergo thorough ECG evaluation, typically in a single highly powered trial, early in development to define their cardiac safety with focus on the QT interval effects. The use of a “positive control,” which reproducibly and consistently prolongs the QT interval by about 5 ms, is strongly advocated to validate the design and ECG methodology used providing assay sensitivity.
The ability to accurately detect a small mean QT prolongation is limited by the methodology applied in a clinical trial and also by the degree of physiologic spontaneous variation of the interval's duration. Many factors affect the variability of QT measurements, including choice of lead(s) and the method by which measurements are made. 6 There is currently a lack of standardization of methods for measuring the QT intervals and several different methods are used. 3 Commonly, the interval is measured only in standard limb lead II, in which there is often a clear separation of the T and U waves. 4 Measuring QT from the earliest Q to the latest T in any lead on an ECG recording that simultaneously displays all 12 leads has also been proposed. 7 Inter‐ and intraobserver variability may be reduced by using computer‐derived, automatic algorithms, 8 , 9 but these automated measurement methods are generally not accepted for “thorough ECG studies,” if not manually overread by trained observers.
To allow detection of 5 ms mean increase in the QTc interval duration it is thus important to study the variability of proposed methods, not only for baseline values but also for drug‐induced changes. In this study we compared four commonly used methods applied to ECG data before and after an intravenous infusion of ibutilide (Corvert®), which is a marketed class III antiarrhythmic compound. 10 , 11 , 12 , 13 The primary objective was to assess the sensitivity of each method to detect changes from baseline and to compare the overall performance of each method over a wide range of QT intervals.
METHODS
Design and Subjects
This was an open label, randomized study, consisting of a baseline and two treatment periods. During the 24‐hour baseline period, laboratory screening, ECG, and Holter recordings were performed. During the two study periods, a 10‐minute infusion of either 0.25 or 0.5 mg ibutilide was given in randomized order at approximately 08:00 AM. The first treatment period started the next day (on day 2), and the second 48 hours thereafter (on day 4). Subjects were confined to the research clinic and under continuous telemetry for the entire duration of the study and were discharged 24 hours after the second dose, in the morning of day 5. Subjects were kept fasted 10 hours prior to and 4 hours after dosing and were confined to bed in supine position postdosing during the same time. Blood samples were collected for determination of ibutilide plasma levels at the start of and 15, 30, and 60 minutes after the start of the infusion. Plasma concentrations were measured with a validated HPLC assay using fluorescence detection.
Healthy subjects between 18 and 45 years of age with normal medical history, physical examination, and laboratory screening within 30 days of study initiation, were enrolled. No concomitant medication was allowed within 7 days prior to study participation. Females had to be on medically accepted birth control methods for at least 90 days prior to and 30 days after study completion. Exclusion criteria included family history of torsades de pointes, baseline QTc (Bazett correction) exceeding 440 ms, or any other significant ECG abnormality. All volunteers gave a written informed consent and the ethics committee of the Bronson Hospital in Kalamazoo, MI, USA approved the protocol. The study was conducted at Pharmacia's Clinical Research Unit at the hospital.
ECG Recordings and Measurements
All ECGs were recorded on a Marquette MAC VU® ECG recorder (GE Medical Systems, Milwaukee, WI, USA) after 5 minutes' supine rest at the beginning of the infusion and 15, 30, and 45 minutes and 1, 2, 4, 6, 8, 12, and 24 hours after the start of the infusion during the two treatment periods and at corresponding clock times at baseline. For the ECG interval measurements, three manual and one computerized method were used, recorded in immediate succession using the same sequence each time, as shown below. The automated measurements were derived from the standard 12‐lead format.
-
1
Earliest Q to latest T in any of 12 leads displayed simultaneously (12‐SIM).
-
2
Lead II measurements from the standard 12‐lead format (LEAD II). For both methods, ECGs were recorded at a paper speed of 25 mm/s at amplitude of 10 mm/mV. Intervals were measured at a core ECG laboratory using a digitizing board (“digipad,” eResearch Technology Inc, Philadelphia, PA) with magnification of the paper ECG coupled with digitization software whereby point‐to‐point determination of onset and offset points was made by trained analysts. 14
-
3
Three‐lead ECGs (3‐LEAD) were recorded at 50 mm/s and amplitude of 20 mm/mV on a format that simultaneously displayed leads II, aVF, and V2. A pen and ruler were used to draw a tangent to the steepest portion of the downward slope of the T wave in each lead. The end of the T wave was calculated as the point where this tangent crossed the isoelectric line and the lead with the longest QT interval, measured with calipers, was used. 15 Trained technicians at the participating research clinic made the measurements, with overread by the attending physician. For the manual methods (LEAD II, 12‐SIM, and 3‐LEAD), the intervals were calculated as the mean of three beats.
-
4
A proprietary computerized algorithm using the GE Medical System's 12SL™ ECG Analysis software (AUT). This algorithm first constructs a median beat for each lead, and then calculates the QT interval as the earliest Q in any lead to the latest T‐wave deflection in any lead. The end of the T wave is defined as the point where the downward slope is less than 25% of the maximum slope after the peak of the T wave.
Statistical Methods
Descriptive statistics, 95% limits of agreement intervals, and Bland–Altman plots 16 , 17 were used to compare the four methods, in a pairwise fashion, for absolute QT intervals and for changes of the QT interval from baseline (where baseline was the average of all 10 recordings during the baseline day). Since the measured heart rates were essentially identical with all four methods (within one beat per minute for all methods at the same time point), analyses were performed on the uncorrected QT interval. In the Bland–Altman plots, the differences between values obtained for two methods are plotted against the averages of the values. Limits of agreement between the two methods were defined as the 95% confidence interval (CI) of the differences.
To compare methods with respect to their power to detect treatment differences, a mixed linear model was fit to the change scores, by method, incorporating factors for subject, gender, dose, study hour, study day, and appropriate interactions. The square root of the residual mean square error (residual standard deviation) from this model was used to contrast the within‐subject variability attributed to each method after adjusting for the factors in the model. The between‐subject variability was estimated using the square root of the mean square error for subjects.
RESULTS
Ten healthy volunteers (five women) aged between 21 and 42 years (mean ± standard deviation: 28 ± 6 years) and weighing between 57 and 102 kg (72 ± 10 kg, body mass index 24.1 ± 2.2 kg/m2) were enrolled into the study. All enrolled subjects completed both treatment periods and no drug‐related adverse reactions were reported.
Changes in QT Interval Following Ibutilide Infusion
The mean QT interval for all methods at baseline and during the study treatments are shown in Table 1. The QTc, corrected according to Fridericia 18 increased in a dose‐ and concentration‐dependent manner (Figs. 1 and 2). The mean time for the maximum QT value (Tmax) ranged between 15 and 26.7 minutes and between 16.5 and 25.5 minutes after the 0.25 mg and 0.5 mg doses, respectively (Table 2). Fifteen minutes after start of the 10‐minute infusion of 0.25 mg ibutilide, at which time the maximum QT interval was observed in most subjects, the prolongation measured with 3‐LEAD was on average 12, 8, and 5 ms larger than the values obtained with AUT, 12‐SIM, and LEAD II, respectively. The same pattern was observed after the 0.5 mg infusion, with an 11, 10, and 6 ms difference between 3‐LEAD and AUT, LEAD II and 12‐SIM. The average Tmax after both infusions ranged between 15 and 23 minutes for LEAD II, 3‐LEAD, and 12‐SIM, but was clearly longer for values obtained with AUT (27 and 26 minutes, after exclusion of two outliers).
Table 1.
Mean QT Intervals During the Baseline and Study Days
| LEAD 11 QT (ms) | 12‐SIM QT (ms) | 3‐LEAD QT (ms) | AUT QT (ms) | ||
|---|---|---|---|---|---|
| BL | Mean | 376.4 | 387.5 | 376.9 | 396.7 |
| SE | 5.3 | 5.3 | 5.0 | 4.0 | |
| 0.25 | Mean | 383.5 | 393.8 | 385.8 | 400.0 |
| SE | 7.0 | 7.2 | 7.2 | 6.6 | |
| 0.5 | Mean | 388.8 | 401.5 | 394.8 | 406.1 |
| SE | 6.5 | 7.3 | 6.9 | 5.8 | |
Mean of 10 recordings at baseline and 11 recordings during study treatment. Method abbreviation as defined in the text. BL = baseline; QT = uncorrected QT interval; SE = standard error.
Figure 1.
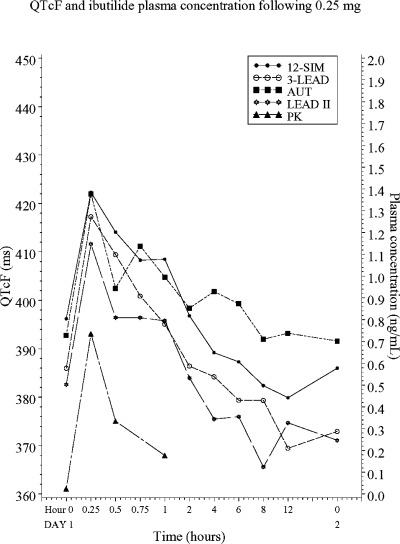
QTc values, corrected according to Fridericia, after 0.25 mg of intravenous ibutilide.
Figure 2.
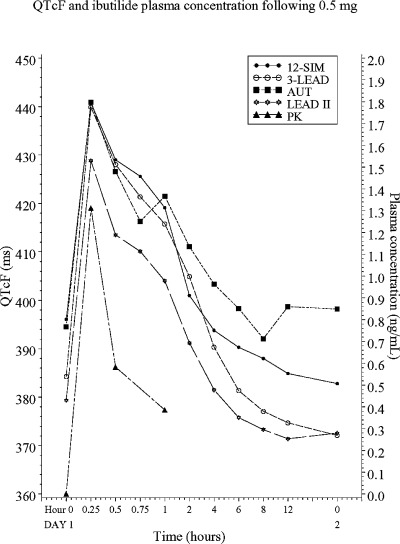
QTc values, corrected according to Fridericia, after 0.5 mg of intravenous ibutilide.
Table 2.
QT Prolongation at 15 Minutes, Maximum QT Prolongation and Tmax After Ibutilide Infusion
| Method | Baseline QT (ms) | 0.25 mg Ibutilide | 0.5 mg Ibutilide | ||||
|---|---|---|---|---|---|---|---|
| QT at 15 minutes (ms) | Max QT (ms) | Tmax minutes | QT at 15 minutes (ms) | Max QT (ms) | Tmax minutes | ||
| Lead II | 376.4 ± 5.3 | 38.6 ± 4.0 | 40.1± 4.4 | 21.0 | 53.6 ± 3.0 | 54.6 ± 2.7 | 18.0 |
| 12‐SIM | 387.5 ± 5.3 | 35.4 ± 3.4 | 38.2 ± 4.1 | 22.5 | 56.5 ± 5.5 | 56.6 ± 5.5 | 16.5 |
| 3‐LEAD | 376.9 ± 5.0 | 43.2 ± 4.6 | 43.2 ± 4.6 | 15 | 63.4 ± 4.2 | 64.0 ± 4.1 | 16.5 |
| AUT | 394.7 ± 4.7 | 31.1 ± 6.5 | 36.1 ± 5.5 | 26.7a | 52.9 ± 5.7 | 58.9 ± 3.3 | 25.5b |
Values are mean ± standard error. QT △= change of QT interval; Tmax= the time at which the maximum QT interval was recorded.
aExcluding one subject with Tmax= 4 hours after start of infusion.
bExcluding one subject with Tmax= 24 hours after start of infusion.
The methods were compared in a pairwise fashion for absolute QT intervals at baseline and during the two treatment periods, and for change in QT interval from baseline. For each of the 11 time points after dosing of 0.25 and 0.5 mg ibutilide, the change from the mean QT value at baseline (10 recordings) was calculated for each method. These changes were then compared pairwise between methods plotting the difference of the methods versus the average of the two methods. 16 , 17 The limits of agreement, defined as the 95% CI for all differences, were included in the plots (Table 3 and Fig. 3A–C). The differences between methods for absolute QT intervals were quite large, and the values obtained with AUT were 17.9, 15.1, and 6.5 ms larger than LEAD II, 3‐LEAD, and 12‐SIM, with clearly wider limits of agreements for all comparisons involving AUT (Table 3). The differences in change from baseline was, however, much smaller, and largest with 3‐LEAD (4.0, 3.3, and 2.9 ms larger than AUT, LEAD II, and 12‐SIM). The best agreement between methods was observed for LEAD II and 12‐SIM with only 0.4 ms in mean difference, within 41 ms limits of agreement. The limits of agreement were also narrow between 3‐LEAD and LEAD II, even though 3‐LEAD consistently produced a somewhat larger change from baseline (3.3 ms). The mean difference between 12 SIM and AUT and between LEAD II and AUT was small (1.1 and 0.7 ms), but the limits of agreement were wide, as in all comparisons with AUT.
Table 3.
Agreement Between Methods for Absolute QT Interval Measurement at Baseline and During Study Periods, and for Change of QT Interval from Baseline
| Pair‐Wise Comparisons | Absolute QT | QT Change from Baseline | ||
|---|---|---|---|---|
| Mean Difference (ms) | Width of 95% Limits of Agreement (ms) | Mean Difference (ms) | Width of 95% Limits of Agreement (ms) | |
| 12‐SIM/LEAD II | 11.4 | 47.6 | 0.4 | 41.0 |
| 12‐SIM/3‐LEAD | 8.6 | 42.0 | −2.9 | 40.5 |
| 12‐SIM/AUT | −6.5 | 78.8 | 1.1 | 65.8 |
| 3‐LEAD/LEAD II | 2.8 | 50.3 | 3.3 | 38.1 |
| 3‐LEAD/AUT | −15.1 | 79.8 | 4.0 | 67.9 |
| AUT/LEAD II | 17.9 | 71.0 | −0.7 | 59.9 |
Figure 3.
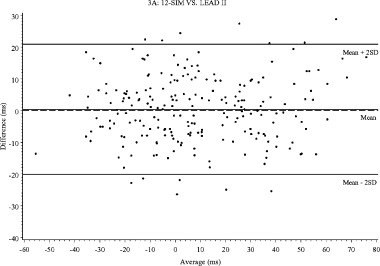
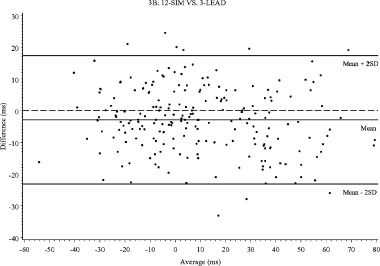
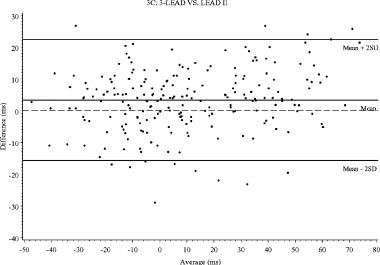
Bland–Altman plots for change of QT interval from baseline: (A) 12‐SIM versus LEAD II, (B) 12‐SIM versus 3‐LEAD, (C) 3‐LEAD versus LEAD II.
Categorical Analyses
The number of ECGs with uncorrected QT intervals exceeding 450 and 480 ms at baseline and during study treatment and the proportion of outliers for QT change from baseline are shown in Table 4. There were no values exceeding 500 ms and no changes from baseline larger than 90 ms. The number of ECGs with QT interval above 450 ms was somewhat greater with 12‐SIM and AUT, 5.3% and 6.6% respectively, compared to 2.2% and 3.4% for LEAD II and 3‐LEAD. The number of ECGs with change from baseline exceeding 30 and 60 ms was larger for 3‐LEAD (28.7%) compared to other methods, and AUT also yielded a somewhat higher proportion in the ≥60 ms category (4.5%).
Table 4.
The Number of ECGs for Each Method with QT Interval and Changes from Baseline Exceeding Defined Cutoff
| QT Interval (ms) | Lead II (N = 320) | 12‐SIM (N = 320) | 3‐LEAD (N = 320) | AUT (N = 320) | ||||
|---|---|---|---|---|---|---|---|---|
| n | % | n | % | N | % | N | % | |
| ≤450 | 313 | 97.8 | 303 | 94.7 | 309 | 96.6 | 299 | 93.4 |
| >450 | 7 | 2.2 | 15 | 4.7 | 11 | 3.4 | 20 | 6.3 |
| >480 | 2 | 0.6 | 1 | 0.3 | ||||
| QT Interval From Baseline | Lead II (N = 220) | 12‐SIM (N = 220) | 3‐LEAD (N = 220) | AUT (N = 220) | ||||
|---|---|---|---|---|---|---|---|---|
| n | % | n | % | N | % | N | % | |
| <30 | 170 | 77.3 | 174 | 79.1 | 157 | 71.4 | 171 | 77.7 |
| ≥30 | 46 | 20.9 | 39 | 17.7 | 51 | 23.2 | 39 | 17.7 |
| ≥60 | 4 | 1.8 | 7 | 3.2 | 12 | 5.5 | 10 | 4.5 |
N is the total number of ECGs during for each method; n and % represent number and proportion of ECGs with value exceeding the denoted limits.
Variability in QT Interval Measurement
The variability within and between subjects for absolute QT intervals and for change from baseline was larger for AUT than for any other method and smallest for 3‐LEAD (Table 5). For change from baseline, the standard deviation for within‐subjects values ranged between 9.6 (3‐LEAD) and 15.8 ms (AUT), with somewhat larger variability for between‐subjects values (11.8–17.8 ms).
Table 5.
Estimates of Standard Deviation Derived from Fitted Mixed Linear Models
| Method | Within Subject | Between Subject | ||
|---|---|---|---|---|
| Absolute QT | QT Change from Baseline | Absolute QT | QT Change from Baseline | |
| LEAD II | 10.4 | 10.0 | 22.0 | 12.2 |
| 12‐SIM | 11.1 | 11.3 | 23.5 | 13.0 |
| 3‐LEAD | 9.8 | 9.6 | 21.0 | 11.8 |
| AUT | 15.8 | 15.8 | 24.3 | 17.8 |
DISCUSSION
Prolonged cardiac repolarization with nonantiarrhythmic compounds has been an area of intense research and debate during the last 6 years. Recently published draft regulatory guidance 3 emphasizes the use of “thoroughly conducted ECG studies” in early drug development to address this fearsome and potentially life‐threatening side effect. It is proposed that these studies should be powered to detect a 5 ms difference between placebo and the studied compound, and that the use of a “positive control” is the most direct way to validate the used design and methodology. A positive control may either be pharmacological or nonpharmacological, such as autonomic maneouvers, and should consistently and reproducibly produce a QT prolongation in the range of 5 ms.
This study evaluated the differences among four different methods of QT measurement. Besides differences in the baseline values, the four methods exhibited dissimilar characteristics when the QT interval was prolonged with ibutilide. The LEAD II method, in which Lead II intervals are measured using a digitizing board, is one of the most widely used methods for centralized, core laboratory ECG evaluation. Using this approach, it has been possible to demonstrate mean QT interval effects as small as 6 ms in a population exposed to noncardiac drugs. 19 Provided sufficiently trained technicians perform the measurements alongside overread by cardiologists, the high reproducibility and relative ease of this method has made it widely adopted and used in drug development. 20 , 21 , 22 In the 3‐LEAD method, measurements were made by “eyeball and caliper” on recordings at a higher paper speed (50 mm/s) with double (20 mm/mV) amplitude, and a “tangential” technique to delineate the end of the T wave was applied on the longest of three leads (II, aVF, and V2). This method, as originally proposed by Browne, 15 was used to demonstrate the lack of effect on the QT interval by concomitant administration of azelastine and ketoconazole. 23 In contrast to these two methods in which measurements essentially are made in one lead, 12‐SIM and AUT use all leads to calculate the “earliest Q to latest T interval duration.” Not surprisingly, these dissimilarities meant that not only baseline values were different, but also was the timing and degree of QT prolongation, as well as measurement variability.
The shortest mean baseline values were obtained with LEAD II and 3‐LEAD (376.4 ± 5.3 and 376.9 ± 5.0), whereas 12‐SIM and AUT yielded a mean of 11–18 ms longer baseline intervals. Since the two latter methods basically incorporate the longest QT interval found in any of the 12 leads into the measurements, this is an expected outcome. Interestingly, the tangential method with 3‐LEAD provided nearly identical baseline values as LEAD II. After infusion of ibutilide, the mean maximum QT prolongation (based on all four methods) after 0.25 and 0.5 mg of ibutilide was 39.4 ms (10.3%) and 58.5 ms (15.2%). Five minutes after the end of the 0.25 mg infusion, the mean QT prolongation ranged between 31.1 (AUT) and 43.2 ms (3‐LEAD), and the corresponding range after 0.5 mg was between 52.9 (AUT) and 63.4 ms (3‐LEAD). These differences diminished somewhat at Tmax, which also differed between methods, but the pattern remained with 3‐LEAD yielding the largest QT prolongation. The larger QT prolongation seen with 3‐LEAD was probably not the result of the relatively short baseline value, but may be a reflection of changed T‐wave morphology. With pure IKr blockers, such as dofetilide and almokalant, a rapid lowering of the T‐wave amplitude has been reported, 8 , 24 , 25 which results in a more shallow tangent of the down slope of the T wave and thereby a relatively larger increase in the QT interval, compared to point‐to‐point determinations.
When the methods were compared pairwise, the same differences came through. For the change from baseline analysis, LEAD II and 12‐SIM provided nearly equal values when compared over the full range of normal and prolonged QT intervals. The mean difference between LEAD II and 12‐SIM was only 0.4 ms within narrow limits of agreement (41.0 ms). This is close to the inter‐ and intraobserver variability observed for repeated LEAD II measurements in a recent study in which sotalol was used to prolong the QT interval (0.2 and 1.0 ms within 32.3 and 33.9 ms). 21 Based on the similar outcome of the two methods, it is difficult to see the advantage of the 12‐SIM method for thoroughly conducted ECG studies, given the larger complexity and cost of this approach. A negligible difference (0.7 ms) was also observed when LEAD II was compared with AUT, but with substantially greater variability (59.9 ms) and, in general, AUT seemed to generate values with larger variability and thereby wider limits of agreements for all comparisons. Changes from baseline for the 3‐LEAD method were larger than for any other method, which resulted in mean differences ranging from 2.9 ms (vs 12‐SIM) to 4.0 ms (vs AUT). Since the 3‐LEAD method results in a larger degree of QT prolongation, this method may thus generate more “false positives” QT studies and thereby cause termination of development of potentially valuable new medications. It should, however be acknowledged that it is not currently known which ECG method, if any, best measures cardiac repolarization. Given the uncertainty on how to interpret T‐wave morphological changes, such as lowering of the T‐wave amplitude, the 3‐LEAD method therefore seems less suited for thoroughly conducted ECG studies.
The proportion of outliers for absolute QT intervals (Table 4) is to a large degree influenced by the baseline value and to a lesser extent by the degree of QT prolongation. Since the degree of QT prolongation in this study was moderate, the primary determinant seemed to be the baseline value. Accordingly, AUT and 12‐SIM, both with relatively long baseline values, produced more QT intervals exceeding 450 and 480 ms, which are cutoffs defined in recent regulatory guidance. 3 For analysis of change from baseline, the baseline value may merely have a random impact due to “regression toward the mean” if subjects with relatively longer baseline values are excluded from trial participation, as often is the case in early clinical trials. 2 The baseline QTc interval exclusion criterion in this study was not overly stringent (> 440 ms), but since there was no placebo group, this random effect cannot be accounted or controlled for. Based on the larger degree of QT prolongation for the 3‐LEAD method, the proportion of outliers (≥30 ms) was substantially larger for this method (28.7%) compared to LEAD II (22.7%), 12‐SIM (20.9%), and AUT (22.2%).
Table 5 gives the estimates of variability (standard deviation) after adjusting for subject, gender, treatment, study day, study hour, and appropriate interactions. The AUT method had clearly the greatest variability for both within‐ and between‐subject values (15.8 and 17.8 ms). The 3‐LEAD, LEAD II, and 12‐SIM exhibited smaller variability within similar range, with the lowest observed values for 3‐LEAD (9.6 and 11.8 ms). It is noteworthy that the variability was in the same range using a method with trained in‐house nurses (3‐LEAD) than with methods performed at a professional core ECG laboratory (LEAD II and 12‐SIM). This may partly be explained by the higher paper speed and amplification of the recordings used for this method. The differences in variability may seem small, but translate into large differences for sample size, if an ECG study is to be powered to detect a 5 ms difference between placebo and a positive control. The number of subjects that would be required for a crossover study in which alpha is set to 0.05 and with 80% power to detect a 5 ms placebo‐corrected difference, would be 31 using the 3‐LEAD method, 34 with LEAD II, 43 with 12‐SIM, and 81 with AUT. For studies using parallel groups, which may be warranted if a drug with long half‐life or multiple doses of a drug is used, the numbers would be even greater (89, 95, 108, and 200, respectively, for each treatment group). These are clearly larger sample sizes than commonly used to date for similar studies. 26 , 27 , 28 , 29 , 30 Differences in variability from commonly used methods may thus cause greater than a two‐fold increase in the sample size required to detect such a small effect as regulatory guidance currently define as relevant. Clearly, other ways to decrease variability of used methods, such as replicate ECGs at each time point, must be sought to enable studies with manageable sample sizes.
In this study, ibutilide was given at doses that prolonged the QT interval in substantial excess of 5 ms, and it may be argued that the results thereby are not transferable to studies in which detection of a smaller degree of QT prolongation is targeted. The way the Bland–Altman plots are constructed, the differences between methods are visualized throughout the range of QT prolongations. These plots (Fig. 3A–C) do not reveal any apparent discrepancies in the differences between methods for mildly and more markedly prolonged intervals. It can therefore be concluded that the observed differences will have a major impact on the result of any “thoroughly conducted” ECG study, and must be accounted for when designing such a study. In addition, it does not seem appropriate to pool results from studies using different methodologies, if not counterbalanced by large number of subjects and trials, as in meta‐analyses using a “population pharmacodynamic” approach. For early studies designed to give a definitive answer whether a compound in development has an effect on cardiac repolarization, it seems prudent to use the same ECG methodology for all studies in which results are to be pooled.
Ten‐second ECG recordings were performed in immediate succession, using the same sequence each time (12‐SIM, LEAD II, 3‐LEAD, AUT derived from LEAD II). The onset and subsequent decline of the QT prolongation observed after an infusion of ibutilide are rapid (Fig. 1), and differences in timing may therefore account for some of the observed differences across methods. This potential bias was not controlled for by randomized treatment sequences.
The lack of a placebo group in the study limits the interpretation of some of these results, such as the proportion of outliers. Although there was a total of 32 ECGs per subject, the number of subjects was small (n = 10), which should limit any discussion on small differences between the methods. The correlation of intervals within a subject was not taken into account in the summary plots and tables, thus results may vary with more subjects and fewer observations.
In conclusion, this study demonstrated significant differences among four commonly used methods for measurement of the QT interval. These dissimilarities translate into large differences in variability of the measured intervals, which have a substantial impact on the sample size required to detect QT prolongation in the range that is currently advised in regulatory guidance. Based on the existing abundance of published studies, the relative ease of the method, and the current results that demonstrated a low variability and consistent results, LEAD II seems to be the preferred method among the four assessed in this study, for thoroughly conducted ECG studies.
Acknowledgments
Acknowledgments: The authors would like to acknowledge the valuable comments on the manuscript made by Roy Bullingham, M.D., Ph.D., Vice President, Nenad Sarapa, M.D., Clinical Pharmacology, Pharmacia Corp, and Joel Morganroth, M.D., Ph.D., University of Pennsylvania and eResearch Technology. Data management and processing were efficiently performed by William T Chen, Global Statistics and Programming and pharmacokinetic analysis by Gail Jungbluth, Ph.D. and Nancy Hopkins, B.S., Clinical Pharmacology, Pharmacia Corp.
REFERENCES
- 1. Darpo B. Spectrum of drugs prolonging the QT interval and the incidence of torsades de pointes. Eur Heart J 2001;3(Suppl. K):K70–K80. [Google Scholar]
- 2. Shah RR. The significance of QT interval in drug development. Br J Clin Pharmacol 2002;54: 188–202. [DOI] [PMC free article] [PubMed] [Google Scholar]
- 3. Food and Drug Administration and Health Canada . The clinical evaluation of QT/QTc interval prolongation and proarrhythmic potential for non‐antiarrhythmic drugs. Preliminary Concept paper, November 15, 2002. Available at http://www.fda.gov/cder/workshop.htm#upcoming.
- 4. Haverkamp W, Breithardt G, Camm AJ, et al The potential for QT prolongation and proarrhythmia by non‐antiarrhythmic drugs: Clinical and regulatory implications. Report on a policy conference of the European Society of Cardiology. Eur Heart J 2000;21: 1216–1231. [DOI] [PubMed] [Google Scholar]
- 5. Committee for Proprietary Medicinal Products (CPMP/986/96). EMEA. Points to Consider: The assessment of the Potential for QT Interval Prolongation by Non‐cardiovascular Medicinal Products., December 17, 1997, London .
- 6. Malik M, Camm AJ. Evaluation of drug‐induced QT interval prolongation: Implications for drug approval and labelling. Drug Saf 2001;24: 323–351. [DOI] [PubMed] [Google Scholar]
- 7. Morganroth J, Brown AM, Critz S, et al Variability of the QTc interval: Impact on defining drug effect and low‐frequency cardiac event. Am J Cardiol 1993;72: 26B–31B. [DOI] [PubMed] [Google Scholar]
- 8. Dota C, Skallefell B, Edvardsson N, et al Computer‐based analysis of dynamic QT changes: Toward high precision and individual rate correction. Ann Noninvas Electrocardiol 2002;7: 289–301. [DOI] [PMC free article] [PubMed] [Google Scholar]
- 9. Willems JL, Abreu‐Lima C, Arnaud P, et al The diagnostic performance of computer programs for the interpretation of electrocardiograms. N Engl J Med 1991;325: 1767–1773. [DOI] [PubMed] [Google Scholar]
- 10. Yang T, Snyders D, Roden DM. Drug block of I(kr): Model systems and relevance to human arrhythmias. J Cardiovasc Pharmacol 2001;38: 737–744. [DOI] [PubMed] [Google Scholar]
- 11. Reiffel JA, Blitzer M. The actions of ibutilide and class Ic drugs on the slow sodium channel: New insights regarding individual pharmacologic effects elucidated through combination therapies. J Cardiovasc Pharmacol Ther 2000;5: 177–181. [DOI] [PubMed] [Google Scholar]
- 12. Naccarelli GV, Lee KS, Gibson JK, et al Electrophysiology and pharmacology of ibutilide. Am J Cardiol 1996;78: 12–16. [DOI] [PubMed] [Google Scholar]
- 13. Ellenbogen KA, Stambler BS, Wood MA, et al Efficacy of intravenous ibutilide for rapid termination of atrial fibrillation and atrial flutter: A dose‐response study. J Am Coll Cardiol 1996;28: 130–136. [DOI] [PubMed] [Google Scholar]
- 14. Morganroth J. Focus on issues in measuring and interpreting changes in the QTc interval duration. Eur Heart J 2001;3 (Suppl. K:):K105–K111. [Google Scholar]
- 15. Browne KF, Prystowsky E, Heger JJ, et al Prolongation of the Q‐T interval in man during sleep. Am J Cardiol 1983;52: 55–59. [DOI] [PubMed] [Google Scholar]
- 16. Bland JM, Altman DG. Statistical methods for assessing agreement between two methods of clinical measurement. Lancet 1986;1: 307–310. [PubMed] [Google Scholar]
- 17. Bland JM, Altman DG. Comparing methods of measurement: Why plotting difference against standard method is misleading. Lancet 1995;346: 1085–1087. [DOI] [PubMed] [Google Scholar]
- 18. Fridericia LS. Die Systolendauer im Elektrokardiogramm bei normalen Menchen und bei Herzkranken. Acta Med Scand 1920;53: 469–486. [Google Scholar]
- 19. Pratt CM, Ruberg S, Morganroth J, et al Dose‐response relation between terfenadine (Seldane) and the QTc interval on the scalar electrocardiogram: Distinguishing a drug effect from spontaneous variability. Am Heart J 1996;131: 472–480. [DOI] [PubMed] [Google Scholar]
- 20. Kautzner J, Yi G, Camm AJ, et al Short‐ and long‐term reproducibility of QT, QTc, and QT dispersion measurement in healthy subjects. Pacing Clin Electrophysiol 1994;17: 928–937. [DOI] [PubMed] [Google Scholar]
- 21. Sarapa N, Morganroth J, Couderc JP, et al Electrocardiographic identification of drug‐induced QT prolongation: Assessment by different recording and measurement methods. Ann Noninvas Electrocardiol 2004;9: 48–57. [DOI] [PMC free article] [PubMed] [Google Scholar]
- 22. Fleishaker JC, Francom SF, Herman BD, et al Lack of effect of reboxetine on cardiac repolarization. Clin Pharmacol Ther 2001;70: 261–269. [DOI] [PubMed] [Google Scholar]
- 23. Morganroth J, Lyness WH, Perhach JL, et al Lack of effect of azelastine and ketoconazole coadministration on electrocardiographic parameters in healthy volunteers. J Clin Pharmacol 1997;37: 1065–1072. [DOI] [PubMed] [Google Scholar]
- 24. Darpo B, Almgren O, Bergstrand R, et al Assessment of frequency dependency of the class III effects of almokalant: A study using programmed stimulation and recording of monophasic action potentials and ventricular paced QT intervals. Cardiovasc Drugs Ther 1996;10: 539–547. [DOI] [PubMed] [Google Scholar]
- 25. Darpo B, Vallin H, Almgren O, et al Selective Ik blocker almokalant exhibits class III–specific effects on the repolarization and refractoriness of the human heart: A study of healthy volunteers using right ventricular monophasic action potential recordings. J Cardiovasc Pharmacol 1995;26: 530–540. [DOI] [PubMed] [Google Scholar]
- 26. Demolis JL, Charransol A, Funck‐Brentano C, et al. Effects of a single oral dose of sparfloxacin on ventricular repolarization in healthy volunteers. Br J Clin Pharmacol 1996;41: 499–503. [DOI] [PMC free article] [PubMed] [Google Scholar]
- 27. Demolis JL, Kubitza D, Tenneze L, et al Effect of a single oral dose of moxifloxacin (400 mg and 800 mg) on ventricular repolarization in healthy subjects. Clin Pharmacol Ther 2000;68: 658–666. [DOI] [PubMed] [Google Scholar]
- 28. Honig PK, Wortham DC, Zamani K, et al Terfenadine‐ketoconazole interaction. Pharmacokinetic and electrocardiographic consequences. JAMA 1993;269: 1513–1518. [PubMed] [Google Scholar]
- 29. Kivisto KT, Lilja JJ, Backman JT, et al Repeated consumption of grapefruit juice considerably increases plasma concentrations of cisapride. Clin Pharmacol Ther 1999;66: 448–453. [DOI] [PubMed] [Google Scholar]
- 30. Van Haarst AD, Van't Klooster GA, Van Gerven JM, et al The influence of cisapride and clarithromycin on QT intervals in healthy volunteers. Clin Pharmacol Ther 1998;64: 542–546. [DOI] [PubMed] [Google Scholar]