

Abstract
Background: Various disciplines use quantification of heart rate variability (HRV) as an indicator of autonomic function without recognizing the importance of using standardized methodologies. The aim of this study was to assess the influence of tachogram length and period of recording on HRV indicator values.
Methods: To test the influence of the length of the recording time, HRV indicator values calculated from 180, 300, 420, and 600 seconds recording periods (supine and standing) were compared. Also individual 3‐ minute periods (0–180 seconds, 180–360 seconds, 360–540 seconds) from 10‐minute (supine and standing) tachograms were compared.
Results: In the supine position, vagal‐efferent HRV indicators were not influenced by tachogram length varying between 3 and 10 minutes (P > 0.05). Supine HRV indicator values representing combined sympathetic and parasympathetic influences were tachogram length‐dependent (P < 0.05). During orthostatic stress all HRV indicators were tachogram length‐dependent (P < 0.05). Upon standing up marked vagal withdrawal and sympathetic activation occurred. Vagal withdrawal tapered off during the 3–6‐minute period after rising while indicators representing combined vagal and sympathetic activation were totally reversed.
Conclusions: During application of orthostatic stress the exact starting point of recording, as well as the length of recording, is critical due to the activation and normalization of homeostatic mechanisms. Starting the tachogram recording too late will miss out on part of the initial response to change in body position. Longer recording times will give a combination of values recorded during the stress response and values obtained after stabilization in the standing position.
Ann Noninvasive Electrocardiol 2011;16(2):131–139
Keywords: electrophysiology, autonomic nervous system, noninvasive techniques, head‐up tilt testing, heart rate variability
Heart rate variability (HRV) analysis investigates the variation in individual cardiac periods regulated by the influence of the sympathetic and parasympathetic branches of the autonomic nervous system (ANS) on the sinoatrial node and it is used in a wide variety of disciplines including neuroscience, cardiovascular diseases, psychiatry, sports medicine, and many more. Quantification of these rhythms gives insight into central oscillator function, humoral factors, sympathetic and vagal‐efferent activity, as well as sinus node activity. 1 Reduced HRV is associated with increased cardiac 2 and noncardiac mortality 3 and autonomic function is therefore investigated by quantification of HRV in a variety of clinical, physiological, and psychological settings. 4 , 5
The use of HRV as a noninvasive indicator of ANS function has increased exponentially over the past three decades. In May 2010, a Medline article search on HRV and humans reported nine published articles for the period 1980–1990, 996 articles for 1990 to 2000 and 1622 for 2000 to 2010. Previously the measurement of HRV required state of the art equipment such as high‐quality electrocardiogram with sampling rates of above 250 Hz, as well as an a accurate algorithm to detect the QRS complex. 6 However, today wireless heart rate monitoring allows easy and affordable, though accurate (compared to ambulatory ECG) determination of HRV. 7 This technology puts the determination of HRV within reach of most clinical and sport researchers.
Although the measurement of HRV has been a prolific source of publications on new applications, theories, as well as controversies, there are few clinical acknowledged standards available. 8 The definition of what is normal and what is pathological ANS behavior as reflected by specific HRV indicator values, is not yet fully understood. Nonstandardization in data collection methods and analytical techniques, used during quantification of HRV, impede the process by producing inconsistent results. Examples of nonstandardization in technique include the use (or not) of normal or paced breathing, variation in tachogram length or recording times, and indiscriminate selection of periods for analysis from longer tachogram recordings. 9
In 1996, the European Society of Cardiology and the North American Society of Pacing and Electrophysiology organized a Task Force to develop appropriate standards for HRV measurement. 1
Over the years these recommendations resulted in a wide array of interpretations by different researchers using HRV quantification. Today many published articles using HRV claim adherence to these general guidelines and recommendations by the Task Force. However, although the recommended sampling time (tachogram length) for short‐term HRV analysis is 5 minutes, numerous studies employ different time windows. For example 2 minutes, 3 minutes, 5 minutes, 10 minutes, and 15 minutes. 9 In addition, recordings are often done without an initial standard resting period for reaching homeostatic equilibrium, thus violating the stationary prerequisite. Information on the effects of variations in recording times on short‐duration study results is not readily available, and may be overlooked by many a researcher using HRV quantification.
Information on the influence of tachogram length is not only required for recording of supine RR intervals, but also during orthostatic testing. The latter is important as it is accepted that reduced responsiveness to a postural change (supine to sit or standing, and head‐up tilt) is an HRV trademark of certain pathophysiological conditions. 8 Alberto Malliani, for instance, reported a reduction in the responsiveness of sympathovagal balance in several conditions marked by abnormal autonomic regulation. 10 However, despite the diagnostic importance of the orthostatic response, variations in technical methods are often seen in the assessment of orthostatic responses. Hardly any information is available on standardized methodology for the best timing or specific duration of the short tachogram sample, other than the Task Force recommendations that refer only to the tachogram length. Some studies employ 2 or 3 minutes for blood pressure equilibration upon standing up before recording of the RR intervals, 11 , 12 , 13 while others just state that 256 continuous RR intervals were selected from supine and standing tachograms, without reporting when measuring started, that is, after 10 minutes resting supine, during standing up, or seconds or minutes after standing up. 14
The present study focused on the influence of the length and the specific period of short‐term tachogram recordings (<10 minutes) used for analysis. The aims of the study were (1) to assess whether mean HRV indicator values obtained by different short tachogram lengths (in the supine position and during an orthostatic stressor) are comparable, and (2) to determine the stability of HRV indicator values over a 10‐minute period by analyzing successive 3‐minute tachogram periods or snapshots (supine and standing). The latter is of importance as it is known that only segments from longer recordings are sometimes selected for analysis on the basis of better tachogram quality (less interference or artifacts).
METHODS
Participants consisted of 150 healthy individuals between 18 and 22 years of age (Mass = 61.11 kg, SD = 8.32 kg; Height = 165.88 cm, SD = 12.75 cm). Ethical clearance was obtained from the Research Ethics Committee of University of Pretoria and all participants gave written informed consent.
Data were sampled in a quiet environment at a room temperature of 22˚C between 07:00 and 11:00 hours. The participants were instructed not to drink any alcohol or caffeine, or exercise during the previous 24 hours and they were allowed to eat a low‐protein breakfast (cereal with milk) on the morning of testing.
Short‐range telemetry was used in a great number of the articles published during the past decade. For this reason the HRV was determined by analysis of the RR‐interval data sets (tachograms) that were obtained by POLAR RS810 heart rate monitors (Polar Electro Oy, Kempele, Finland), which acquired the heart rate signal continuously at a 1‐kHz sampling frequency.
HRV Quantification
The RR‐interval sets were analyzed using HRV Analysis Software 1.1 for windows developed by The Biomedical Signal Analysis Group, Department of Applied Physics, University of Kuopio, Finland. Smoothn priors for trend and Model Eye program settings were used for detrending with an alpha value of 500. The autoregressive model order value was 16 and the interpolation rate was 4 Hz. The analysis techniques (Table 1) used for the evaluation of HRV from RR‐interval data sets, were grouped into three categories: time domain, frequency domain, 1 , 15 and nonlinear analysis (Poincarè plot analysis) as described by Tulppo et al. 16 HRV indicators determined are listed in Table 1 with an explanation of the efferent source of stimulation (sympathetic or parasympathetic branch of ANS). 1 , 17 Normalized units for low‐frequency (LF) and high‐frequency (HF) power can also be determined to represent the relative value of each power component in proportion to the total power minus the very low‐frequency (VLF) component. However, LF and HF normalized units were not calculated for this study as the measurement of VLF from very short‐term recordings (<5 minutes) is not recommended. As recordings of at least 1 minute to assess HF power and 2 minutes for the LF component is recommended, 1 this study used and compared 3‐, 6‐, and 9‐minute tachograms.
Table 1.
Summary of HRV Analysis Techniques Used, Specific HRV Indicators Used, and Origins of Variability
| Time Domain Analysis | Mean RR (s) | The mean of the intervals between successive QRS complexes, result of vagal (short term), and sympathetic (long term) influence on HRV. |
| SDNN (s) | Standard deviation of intervals between successive QRS complexes, indicator of vagal (short term), and sympathetic (long term) influence on HRV (Overall HRV). | |
| RMSSD (ms) | Root mean square of the standard deviation between RR intervals, indicator of vagal influence (short term). | |
| pNN50 (%) | The percentage of successive RR‐interval differences larger than 50 ms computed over the entire recording, indicator of vagal influence (short term) on HRV. | |
| Poincarè Plot Analysis | SD1 (ms) | Indicator of the standard deviation of the immediate, or short‐term RR variability due to parasympathetic efferent (vagal) influence on the sinoatrial node. |
| SD2 (ms) | Indicator of the standard deviation of the long‐term or slow variability of the heart rate. It is accepted that this value is representative of the global variation in HRV. | |
| Frequency Domain Analysis | LF power (ms2) | Indicator of sympathetic influence, but also including a parasympathetic component. |
| HF power (ms2) | Indicator of only parasympathetic influence. | |
| LF/HF | Indicator of autonomic balance. |
The first aim of the study was to assess whether mean HRV indicator values obtained by different short tachogram lengths are comparable. This was investigated both in the supine position and during orthostatic stress. Recordings in the supine position were preceded by a 2‐minute resting period in the supine position. Determination of the influence of the tachogram length on the mean HRV indicator values in the supine position included comparisons between results obtained over 180‐, 300‐, 420‐, and 600‐second tachogram periods. Registration of the standing measurements started from the moment participants changed from supine to the upright position, standing with their backs against a wall and feet apart. Again 180‐, 300‐, 420‐, and 600‐second tachogram periods were compared to each other.
The second aim was to determine the stability of HRV indicator values over a 10‐minute period by analyzing successive 3‐minute tachogram periods or snapshots, in the supine and in the standing period, respectively. Thus, to examine the possible changes in mean HRV indicator values over 10‐minute supine and a 10‐minute standing periods, respectively, consecutive 3‐minute tachograms were recorded, analyzed, and compared, commencing (1) directly after, (2) 180 seconds after, and (3) 360 seconds after the initial 2‐minute resting period and again (1) directly after, (2) 180 seconds after, and (3) 360 seconds after standing up. This resulted in three data sets containing RR intervals of 3‐minute tachograms from the supine period and three data sets from the standing period. Three‐minute periods were used because tachograms of 10 minutes allowed for three sets of data each for supine and standing.
Statistical Analysis
The SAS procedure MIXED was used to determine the effect of the different time intervals on each of the HRV measurements. A linear model with HRV measurement as dependent and time as explanatory variable was fitted to the data allowing for correlation between consecutive time intervals [AR (1) covariance structure]. The F‐test was performed in each case to test whether there was an overall time effect and for each time interval the least squares means were estimated.
RESULTS
When the influence of different tachogram lengths (180, 300, 420, and 600 seconds) on mean HRV indicator values were examined (Table 2), results from recordings in the supine position showed that the mean values of the parasympathetic nervous system‐dependent indicators (RMSSD, pNN50, SD1, HF) and the indicator of autonomic balance (LF/HF), did not differ significantly (P > 0.05). However, as seen in Table 2, HRV indicators influenced simultaneously by both the sympathetic and parasympathetic branches of the ANS (SDNN, SD2 and LF), showed significant (P < 0.05) tachogram length‐dependency in the supine position. During application of an orthostatic stressor, the indicator of autonomic balance (LF/HF) remained stable (P > 0.05), while all HRV indicators showed significant differences (p < 0.05) between recording times of 180, 300, 420, and 600 minutes (Table 2).
Table 2.
Comparison between Heart Rate Variability (HRV) Indicator Values Obtained with Four Different Tachogram Lengths in the Supine, and Four Different Tachogram Lengths in the Standing Position
| HRV indicatora | Supine | Standing | ||||||||
|---|---|---|---|---|---|---|---|---|---|---|
| 180s | 300s | 420s | 600s | P‐value | 180s | 300s | 420s | 600s | P‐value | |
| Mean HR | 73.75 | 73.57 | 73.47 | 73.49 | 0.019 | 89.02 | 90.39 | 91.13 | 91.85 | 0.0001 |
| Mean RR | 0.84 | 0.84 | 0.84 | 0.84 | 0.022 | 0.69 | 0.69 | 0.68 | 0.67 | 0.0001 |
| SDNN | 0.05 | 0.052 | 0.052 | 0.051 | 0.016 | 0.047 | 0.044 | 0.040 | 0.042 | 0.0001 |
| RMSSD | 60.90 | 61.14 | 61.26 | 61.69 | 0.69 | 38.81 | 35.00 | 32.39 | 30.31 | 0.0001 |
| pNN50 | 33.46 | 33.22 | 33.03 | 32.86 | 0.44 | 14.32 | 11.71 | 10.37 | 9.39 | 0.0001 |
| SD1 | 43.21 | 43.45 | 43.55 | 43.51 | 0.60 | 27.89 | 25.09 | 23.19 | 21.70 | 0.0001 |
| SD2 | 73.26 | 75.51 | 78.31 | 81.97 | 0.0001 | 118.72 | 104.28 | 95.14 | 101.44 | 0.0001 |
| LF | 320.75 | 349.54 | 351.49 | 366.15 | 0.014 | 451.47 | 367.42 | 328.83 | 301.76 | 0.0001 |
| HF | 403.57 | 387.11 | 384.37 | 389.18 | 0.17 | 156.04 | 137.68 | 113.59 | 98.31 | 0.011 |
| LF/HF | 1.12 | 0.96 | 1.04 | 1.09 | 0.74 | 5.45 | 6.48 | 7.09 | 6.56 | 0.67 |
aAbbreviation of HRV indicators explained in Table 1; s: seconds.
During investigation of the stability of supine HRV indicator values over different 3‐minute periods (Table 3) there were no significant differences except for SD2 (P = 0.038). However, in the standing position all HRV indicator values measured during the 2nd (780–960 seconds) period and the 3rd (960–1140 seconds) period were highly significant different (P < 0.0001) from the 1st standing period (600—780 seconds) indicating time‐period dependency.
Figures 1 and 2 represent an overview of the reaction of the ANS branches to standing (10 minutes) after 10 minutes in the supine position. The HRV indicator values were expressed as percentage change compared to the first 3 minutes mean supine values. Example: percentage change in RMSSD during the 180–360 seconds supine period: (60.93–61.36)/61.36 × 100 =−0.7%. Percentage change was used to enable the presentation of all indicators on the same graph. Figure 1 represents the HRV indicators influenced by only the parasympathetic branch of the ANS (RMSSD, pNN50, SD1, HF), and Figure 2 the HRV indicators influenced by both the sympathetic and parasympathetic branch (SDNN, SD2, and LF).
Figure 1.
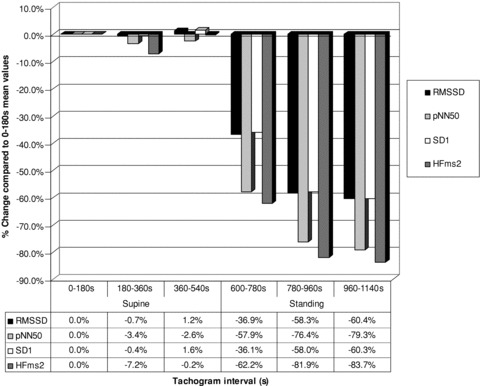
Parasympathetic mediated ANS activity during 600 seconds (s) in the supine position followed by 600 seconds (s) standing as calculated by the change compared to the first 3‐minutes mean supine values.
Figure 2.
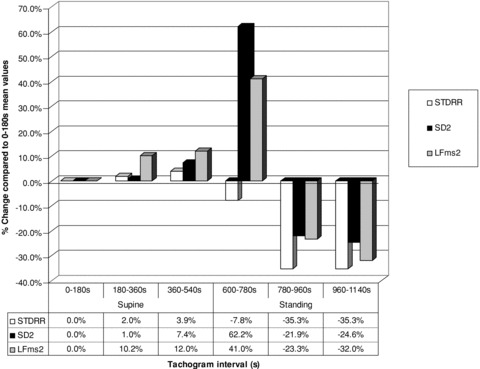
HRV indicators influenced by both sympathetic and parasympathetic ANS activity during 600 seconds (s) in the supine position followed by 600 seconds (s) standing as calculated by the change compared to the first 3‐minutes mean supine values.
DISCUSSION
When comparing the findings of different studies it is important to know the validity of comparing results from studies that used dissimilar recording times. It is fairly obvious that recording times, or tachogram lengths, would be a factor when long tachograms are involved, but the situation is not clear for periods between 3 and 10 minutes. As recording times of between 180 and 600 seconds are generally used, it is important to know whether comparable results are obtained with tachogram lengths varying between 180 and 600 seconds. The primary aim of this study was therefore to assess whether mean HRV indicator values are influenced by the length over which the tachogram is recorded. To test for a possible influence of the length of the recording time, HRV indicator values calculated from 180, 300, 420, and 600 seconds recording periods, respectively, were compared. This was done for the supine position, as well as during the application of an orthostatic stressor. As, in the assessment of the influence of tachogram length, a number of HRV indicator values differed between the different recording times (tachogram lengths), individual 3‐minutes periods (snapshots) from 10‐minute supine recorded tachograms were subsequently compared in an attempt to ascertain over which 3‐minute periods the differences occurred. This was also done for consecutive 3‐minute snapshots from a 10‐minute tachogram recorded during application of an orthostatic stressor. Last, in an attempt to visually present the changes in all HRV indicators, over the total period (supine, as well as standing), indicator values were expressed as percentage changes.
Influence of Tachogram Length
As seen in Table 2, the mean supine values for parasympathetic (vagal) HRV indicators (RMSSD, pNN50, SD1, HF) and the LF/HF did not differ (P > 0.05) between tachograms of different lengths. It is thus feasible to accept that recordings varying between 3 and 10 minutes give similar results. The mean supine HRV indicator values of mixed origin (sympathetic and parasympathetic combined), that is, SDNN, SD2, and LF,, all showed significant (p < 0.05) tachogram length‐dependency in the supine position. It would thus appear that studies focussing only on quantification of the supine parasympathetic‐induced variability of heart rate and autonomic balance, where tachograms vary between 180 and 600 seconds, may be compared. In contrast, the same could not be said for comparisons of supine HRV indicators influenced simultaneously by the sympathetic and parasympathetic branches (SDNN, SD2, and LF). As tachogram length appeared to be important when indicators reflecting mixed origin are assessed, individual 3‐minute periods from 10‐minute recordings were analyzed. The results are discussed under the next subheading.
During application of an orthostatic stressor, and as would be expected from a physiological point of view, all HRV indicators showed significant differences (P < 0.05) between recording times of 180, 300, 420, and 600 seconds (Table 2). This tachogram length‐dependent effect from the moment of rising until the end of the 10‐minute period is due to the homeostatic processes involved in the regulation of blood pressure upon postural change. The question is therefore not whether different tachogram lengths will give different results during the application of an orthostatic stressor, but rather the length of the period over which changes in autonomic function will occur before stabilization in the standing position. This was addressed in the second aim of the study where 3‐minute snapshots from within the 10‐minute recordings were examined.
Comparison of Different 3‐Minute Periods within a 10‐Minute Tachogram
In an attempt to gain a better understanding of the differences found with variations in tachogram lengths, different 180‐second tachogram periods (snapshots) from a 600‐second supine recorded tachogram were compared, as well as different 180‐second snapshots from a 600‐second tachogram recorded during application of the orthostatic stressor.
With comparison of the supine tachograms recorded over different 3‐minute periods (Table 3) there were again no significant differences in the vagal‐determined indicators (RMSSD, pNN50, SD1, HF) between the first 180 seconds and the second 180 seconds, the second 180 seconds and the third 180 seconds, or between the first and third 180 seconds tachograms. This confirmed the possibility of comparing vagal‐dependent variables from recording times between 3 and 10 minutes. For HRV indicators influenced simultaneously by the sympathetic and parasympathetic branches of the ANS, only the third period SD2 value differed significantly from that obtained in the first and second 180‐second periods. SDNN and LF did not differ significantly (P > 0.05) between the different 180‐second periods. SD2 is obtained by nonlinear analysis (Poincarè plot analysis), of the recorded intervals and is known to have only a moderate correlation with LF at rest. 16 It is seen as an indicator of the complex, long‐term global variability of the heart rate. The fact that only SD2 were able to identify HRV instability in the supine position may be due to the fact that Poincarè analysis takes into account the nonlinear nature and dynamics of the cardiac control system while time domain and frequency domain analysis does not, thus making it more sensitive to subtle changes in HRV.
Table 3.
Changes in Mean HRV Indicator Values from Six Different 180‐Second Tachograms (Snapshots) Starting at 0 Seconds (Supine), 180 Seconds (Supine), 360 Seconds (Supine), 600 Seconds (Standing), 780 Seconds (Standing), and 960 Seconds (Standing)
| HRV indicatora | Supine | Standing | |||||||
|---|---|---|---|---|---|---|---|---|---|
| 0–180s | 180–360s | 360–540s | P‐value | HRV indicatora | 600–780s | 780–960s | 960–1140s | P‐value | |
| Mean HR | 73.74 | 73.20 | 73.02 | 0.066 | Mean HR | 89.04 | 92.11 | 93.44 | <0.0001 |
| Mean RR | 0.84 | 0.85 | 0.85 | 0.29 | MeanRR | 0.69 | 0.67 | 0.66 | <0.0001 |
| SDNN | 0.051 | 0.052 | 0.053 | 0.34 | SDNN | 0.047 | 0.033 | 0.033 | <0.0001 |
| RMSSD | 61.36 | 60.93 | 62.11 | 0.58 | RMSSD | 38.72 | 25.56 | 24.27 | <0.0001 |
| pNN50 | 33.79 | 32.64 | 32.92 | 0.25 | pNN50 | 14.22 | 7.97 | 7.00 | <0.0001 |
| SD1 | 43.55 | 43.37 | 44.23 | 0.59 | SD1 | 27.83 | 18.29 | 17.27 | <0.0001 |
| SD2 | 73.49 | 74.22 | 78.90 | 0.038 | SD2 | 119.19 | 57.41 | 55.42 | <0.0001 |
| LF | 321.79 | 354.48 | 360.35 | 0.48 | LF | 453.68 | 246.75 | 218.94 | <0.0001 |
| HF | 410.63 | 380.99 | 409.96 | 0.39 | HF | 155.20 | 74.24 | 67.01 | <0.0001 |
| LF/HF | 1.93 | 2.13 | 2.15 | 0.78 | LF/HF | 5.83 | 12.82 | 11.22 | 0.0026 |
aAbbreviation of HRV indicators explained in Table 1; s: seconds.
When the 3‐minute snapshots from the 10‐minute tachograms recorded during application of the orthostatic stressor were examined, the recording length‐dependency of the results were confirmed (Table 3). In addition, the differences seen between the recording periods were in line with the physiological adaptations expected upon postural change (supine to standing). It is generally accepted that, in order to prevent a fall in blood pressure, an acute shift in autonomic activity must take place when rising from the supine position, but that stabilization of autonomic activity for the maintenance of blood pressure in the standing position should thereafter occur. The initial response was beautifully illustrated in the decreased values of the vagal‐dependent indicators RMSSD (from 62.11 to 38.72), pNN50 (from 32.92 to 14.22), and SD1 (from 44.23 to 27.83) during the first period of the standing position (Table 3). At the same time, increased values for SD2 (from 78.90 to119.19) and LF (from 360.35 to 453.68), were observed.
As these last two values are indicators of the combined power/strength of the vagal and sympathetic branches, the increased values thus reflected increases in sympathetic activity, as it was just shown that the pure vagal activity decreased.
The overt changes from supine to standing up did not persist. In fact, a decline in the initial vagal withdrawal and inverse of the initial increased sympathetic activity was seen as standing time increased. During standing all HRV indicator values obtained during the second (780–960 seconds in Table 3) and third standing period (960–1140 seconds in Table 3) differed significantly from that of the first 180 seconds of standing (600–780 seconds in Table 3). Vagal indicators (RMSSD, pNN50, SD1, HF) continued to decline from the first (600–780 seconds in Table 3) to the second standing period (780–960 seconds in Table 3), but not at the same rate. In contrast indicators of mixed origin (SD2, LF), which increased dramatically from supine to standing up, now also decreased. It is thus clear that the first standing period (600–780 seconds in Table 3) measured the autonomic response to a change in the position of the body, and that recordings of subsequent periods, were influenced by body position rather than by the change in body position. The question now would be at what stage stabilization in the standing position occurred. No significant differences for either vagal or indicators of mixed origin were found between the second and third periods of standing—pointing toward stabilization of ANS activity in the standing position during the second 3‐minute tachogram period (780–960 seconds in Table 3) in the upright position.
From the above it is thus obvious that variations in the recoding time (tachogram length) will give different values for the orthostatic response, as longer periods will include values obtained after stabilization in the standing position. In other words, longer recording times (5, 7, and 9 minutes) will obscure information about autonomic modulation of RR intervals that is available in shorter (3 minutes) recordings, in the same way as Malik et al. (Task Force, 1996) observed that “...24‐hour period averages obscure the detailed information about autonomic modulation of RR intervals that is available in shorter recordings.” 1
Percentage Changes over Total Recording Period
In an effort to visually demonstrate the changes occurring throughout the total period of recording, that is, from after the 2‐minute stabilization period in the supine position (0–180 seconds) up to the last 180 seconds of standing (960–1140 seconds), mean HRV indicator values of different periods (supine 180–360, supine 360–540, standing 600–780, standing 780–960, and standing 960–1140 seconds), were expressed as percentage changes of the values obtained in the first 3‐minutes supine position (0–180 seconds). These are shown in Figure 1 (vagal activity indicators) and Figure 2 (combined vagal and sympathetic activity indicators). These figures confirm that for the supine position, even with recording times of 10 minutes and less, standardization is preferable for indicators influenced by both vagal and sympathetic activity. Figure 1 demonstrates the dramatic, previously described, vagal withdrawal during the first 180‐second period after application of the orthostatic stressor (600–780 seconds), followed by stabilization during the second 180‐second period onward (780–960 seconds and 960–1140 seconds). The indicators SD2 and LF influenced by sympathetic as well as parasympathetic activity (Fig. 2), showed increased activity over the first 180‐second period (600–780 seconds). SDNN did not show the same increase. Although SDNN is considered, by some, as comparable to SD2 and LF (indicators of combined ANS influences), parasympathetic activity would appear to have a stronger influence on SDNN than sympathetic activity. During the second and third periods (780–960 seconds and 960–1140 seconds) a decline occurred in these indicators (SDNN, SD2, and LF) These visual representations of percentage changes in ANS functioning in response to an orthostatic stressor thus confirm what was already gleamed from the examination of individual 3‐minute snapshots. In short, vagal activity decreased greatly in the first period and stabilized, at a still lower level, during the second period of standing. In contrast, the sympathetic influence increased dramatically during the first (600–780 seconds) and plummeted during the second period (780–960 seconds) of standing, where it appears to stabilize. In view of these findings the following recommendations can be made:
-
1
An initial resting period of 2 minutes for stabilization in the supine position is sufficient before starting the tachogram recording to be analyzed. This naturally does not apply if the subject was physically active beforehand (e.g., climbing stairs, running).
-
2
In the supine position the indicators reflecting parasympathetic function remains stable over different time periods within a 10‐minute recording and can thus be compared. However, indicators that include sympathetic influences, especially SD2, are less stable and it is advised that supine recordings of between 3 and 6 minutes after stabilization, be used.
-
3
If the purpose is to assess the autonomic response to posture change, the recording should be done over the first 3 minutes of standing. If the purpose is to assess autonomic functioning during standing, the first 3 minutes recorded in the standing position should not be included as it represents the autonomic adaptation to a change in the position of the body rather than body position itself
In conclusion, it can be said that recording times in the supine position should preferably be standardized. However, standardization is absolutely necessary during assessment of the orthostatic stress response. Upon standing up (orthostatic stressor), the exact starting point, as well as the length of recording, is critical due to the activation and normalization of homeostatic mechanisms. In addition, choosing segments for analysis on the basis of quality, rather than adhering to standardized selection periods, should be strongly discouraged.
REFERENCES
- 1. Task Force of the European Society of Cardiology and the North American Society of Pacing and Electrophysiology . Heart rate variability: Standards of measurement, physiological interpretation and clinical use. Circulation 1996;93:1043–1065. [PubMed] [Google Scholar]
- 2. Kleiger RE, Stein PK, Bigger T Jr. Heart rate variability: Measurement and clinical utility. Ann Non-invasive Electrocardiol 2005;10:88–101. [DOI] [PMC free article] [PubMed] [Google Scholar]
- 3. Dekker JM, Evert GS, Klootwijk P, et al Heart rate variability from short electrocardiographic recordings predicts mortality from all causes in middle‐aged and elderly men. Am J Epidemiol 1997;145:899–908. [DOI] [PubMed] [Google Scholar]
- 4. Grant CC, Steenkamp B, Gauche L, et al Dysrhythmogenic potential in acute admissions to psychiatric hospitals and clinics. Cardiovasc J South Afr 2007;18:140–144. [PMC free article] [PubMed] [Google Scholar]
- 5. Fogt DL, Cooper PJ, Freeman CN, et al Heart rate variability to assess combat readiness. Mil Med 2009;174:491–495. [DOI] [PubMed] [Google Scholar]
- 6. Gamelin FX, Berthoin S, Bosquet L. Validity of the polar S810 heart rate monitor to measure R‐R intervals at rest. Med Sci Sports Exerc 2006;38:887–893. [DOI] [PubMed] [Google Scholar]
- 7. Kingsley M, Lewis MJ, Marson RE. Comparison of Polar 810s and an ambulatory ECG system for RR interval measurement during progressive exercise. Int J Sports Med 2005;26:39–44. [DOI] [PubMed] [Google Scholar]
- 8. Montano N, Porta A, Cogliati C, et al Heart rate variability explored in the frequency domain: A tool to investigate the link between heart and behaviour. Neurosci Biobehav R 2009;33:71–80. [DOI] [PubMed] [Google Scholar]
- 9. Grant CC, Ker JA. Review: Autonomic response to exercise as measured by cardiovascular variability. S Afr J Sports Med 2008;20:102–108. [Google Scholar]
- 10. Malliani A. Principles of Cardiovascular Neural Regulation in Health and Disease. Dordrecht , Kluwer Academic Publishers, 2000. [Google Scholar]
- 11. Carnethon MR, Liao D, Evans GW, et al Does the cardiac autonomic response to postural change predict incident coronary heart disease and mortality? Am J Epidemiol 2002;155:48–56. [DOI] [PubMed] [Google Scholar]
- 12. Nagaraj D, Raghunandan DS, Mallavarapu BE, et al Beat‐to‐beat heart rate and QT variability in patients with congestive cardiac failure: Blunted response to orthostatic challenge. Ann Noninvas Electro 2004;9:323–329. [DOI] [PMC free article] [PubMed] [Google Scholar]
- 13. Vuksanovic V, Gal V. Correlation properties and regularity of heart period time series. Ann N Y Acad Sci 2005;1048:422–426. [DOI] [PubMed] [Google Scholar]
- 14. Gilder M, Ramsbottom R. Change in heart rate variability following orthostasis relates to volume of exercise in healthy woman. Aut Neurosci 2008;143:73–76. [DOI] [PubMed] [Google Scholar]
- 15. Niskanen JP, Tarvainen MP, Ranta‐aho PO, et al Software for advanced HRV analysis. Comp Meth Progr Biomed 2004;76:73–81. [DOI] [PubMed] [Google Scholar]
- 16. Tulppo MP, Makikallio TH, Takala ES, et al Quantitative beat‐to‐beat analysis of heart rate dynamics during exercise. Am J Physiol 1996;271:H244–252. [DOI] [PubMed] [Google Scholar]
- 17. Mourot I, Bouhaddi M, Perrey S, et al Quantitative Poincare plot analysis of heart rate variability: Effect of endurance training. Eur J Appl Physiol 2004;91:79–87. [DOI] [PubMed] [Google Scholar]