

Abstract
Objective
To evaluate whether the amplitude of fibrillatory wave (F wave) on electrocardiography could predict the recurrence in persistent atrial fibrillation (AF) patients who underwent catheter ablation.
Methods
All consecutive persistent AF patients who underwent catheter ablation at Peking Union Medical College Hospital between November 2006 and February 2012, were enrolled. The amplitude of F wave was measured on three orthogonal leads (leads I, V1 and aVF) on the Prucka CardioLab recording system. The primary end point was the recurrence after catheter ablation.
Results
A total of 54 persistent AF patients were enrolled. Fifty patients (age: 58 ± 11years, 72% male) constituted the study population after excluding four patients lost of follow‐up. The duration of AF was 9 ± 7 (2–18) months. Twenty‐four patients (48%) recurred during the follow‐up of 25 ± 19 months, constituted recurrence group. The remaining 26 patients constituted control group. The F‐wave amplitude in recurrence group was significantly lower than control group (lead aVF, 0.085 ± 0.018 vs. 0.111 ± 0.036mV, P = 0.002; lead V1, 0.116 ± 0.031 vs. 0.148 ± 0.047mV, P = 0.008). The amplitudes of leads aVF (P = 0.023) and V1 (P = 0.031) were the independent predictors of AF recurrence. The sensitivity and specificity of F‐wave amplitude of lead aVF < 0.093mV or V1 < 0.123mV to predict the recurrence were 75% and 73%, 68% and 64%, respectively.
Conclusion
The low amplitudes of F wave in leads aVF and V1 could predict the recurrence of patients with persistent AF who underwent catheter ablation.
Keywords: electrocardiography, fibrillatory wave, recurrence, persistent atrial fibrillation, catheter ablation
Catheter ablation of atrial fibrillation (AF) in symptomatic patients with persistent AF is now a reasonable recommendation (class IIa) according to the latest expert consensus.1 Nonetheless, the selection of suitable patient with persistent AF for catheter ablation remains a challenge and published data about mid and long term outcomes underscore the fact that results vary significantly 2. Accordingly, characteristics such as longer AF duration, larger left atrium (LA) and co‐morbidities like congestive heart failure predicted more complicated catheter ablation procedures and higher recurrence rate.3, 4 Therefore, the selection of appropriate patients with persistent AF for catheter ablation is very important for the better outcome of catheter ablation. Fibrillatory wave (F wave) amplitude on the surface electrocardiography (ECG) is dependent on the magnitude of the underlying voltage which related to the magnitude of remaining viable atrial muscle. It is simple to measure the F‐wave amplitude with electronic calipers on the Prucka CardioLab (GE Healthcare, Waukesha, WI, USA) recording system and has been shown to be repeatable from one ECG to another over 24 hours in clinically stable patients.5 Previous studies 6 reported that F‐wave amplitude associated with LA size, left atrial appendage (LAA) function and embolic risk with variable results.
This study sought to determine if F‐wave amplitude on the surface ECG could be predictive of the recurrence of patients with persistent AF who underwent catheter ablation.
METHODS
Patients
All consecutive symptomatic patients with persistent AF who underwent catheter ablation at Peking Union Medical College Hospital (PUMCH) between November 2006 and February 2012, were enrolled. Persistent AF is defined as continuous AF that is sustained beyond seven days.1
Data Collection
We performed a detailed examination of the medical records of the study patients after obtaining the approval from Institutional Review Board of PUMCH. A review of the medical records was performed by a team of physicians blinded to the results.
The baseline data before catheter ablation were collected, including gender, age, height, weight, New York Heart Association (NYHA) functional class, duration of AF, comorbidities (hypertension, hyperlipidemia, diabetes mellitus, coronary heart disease, chronic heart failure, chronic kidney disease [CKD] and thrombo‐embolism events) and medicines at discharge. Body mass index (BMI) was calculated according to the equation of weight (kg) / height (m)2. CKD was defined by eGFR < 60 ml/min/1.73 m2 according to the equation 7: eGFR = 186 × SCr−1.154 × Age−0.203 [× 0.742 Female] ml/min/1.73 m2.
The echocardiography (ECHO) data was collected for the following characteristics: left atrial dimension (LAD), left ventricular end of diastolic diameter (LVEDD), left ventricular end of systolic diameter (LVESD), left ventricular ejection fraction (LVEF) and pericardial effusion. Trans‐thoracic ECHO was performed using commercially available GE Vivid 7 Ultrasound machines. The LAD, LVEDD and LVESD were measured in standard fashion.8 LVEF was assessed using the biplane Simpson's equation from apical 2‐chamber views.
ECG Measurement
The amplitude of F wave was measured on three orthogonal leads (leads I, V1 and aVF) with electronic calipers on the Prucka CardioLab recording system. Three 10‐second ECG recordings with at least one minute interval prior to catheter ablation were randomly selected to measure the amplitude of F wave, except the F waves overlapped with QRS and T waves. The intracardiac electrogram A wave recorded by coronary sinus electrodes 5/6 was used to identify the F wave, before and after A wave 80ms defined the width of F wave. The amplitude of each F wave was the voltage (mV) between the peak and nadir points within the width of F wave. The amplitude of F wave of each lead was the average voltage of all the measured F waves from the three 10‐second ECG recordings. Lead gain was uniform (1 mV/10 mm) with paper speed of 200 mm/s. The method of F‐wave measurements was showed in Figure 1. The initial cardiologist and a second cardiologist, both blinded to the results of the first analysis and to the results, reassessed 300 F‐wave measurements over the same recording period, intraobserver and interobserver variability were calculated. The Bland‐Altman method 9 was used to validate the agreement between the two cardiologists.
Figure 1.
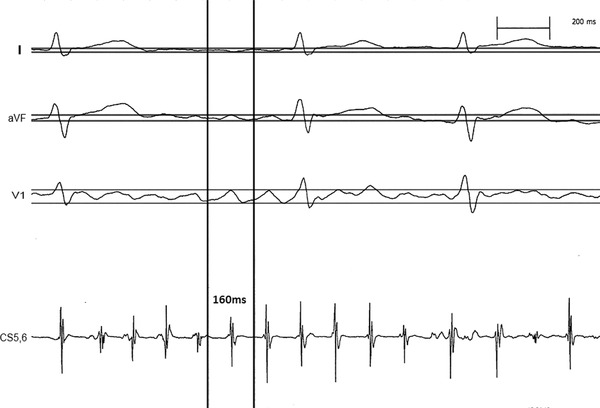
The method of F‐wave measurements.
Catheter Ablation Protocol
All patients underwent transesophageal ECHO to make sure no thrombus in LA within 24 hours before catheter ablation. The catheter ablation was performed in a fasting and sedated state on all patients. All patients provided informed consent before the procedure. A standard ten‐pole diagnostic catheter was positioned in the coronary sinus as reference. Transseptal procedure was done for twice, following which a bolus of 80 IU/kg heparin was administered. One was for placement of ten‐pole circumferential mapping catheter (Lasso, Biosense‐Webster Diamond Bar, CA, USA), another was for 3.5‐mm externally irrigated tip ablation catheter (thermocool, Biosense‐Webster). Radiofrequency catheter ablation was performed in temperature control mode with a target tissue temperature not exceeding 45°C. Power of 20 to 35 Watts was used with the saline perfusate of 17 ml/min. Catheter ablation was performed sequentially as follows: 1) Pulmonary veins isolation; 2) Linear lesions (roof and mitral lines); 3) Electrogram‐based ablation. The procedural end point was AF termination with or without electrical cardioversion. After restoration of sinus rhythm, pulmonary veins isolation was confirmed and the lines previously performed during AF were completed, if necessary, in order to achieve bidirectional conduction blocks.
Primary End Point and Follow‐Up
The primary end point was the recurrence after catheter ablation. The definition of recurrence was atrial tachycardia or atrial fibrillation or atrial flutter lasting at least 30 seconds which recorded by ECG or 24‐hour ECG. All patients were followed up by telephone or clinic visits.
Statistical Analysis
Continuous variables were presented as mean ± 1 SD. Continuous variables were compared using an unpaired Student t‐test in the case of normal distribution and a Mann‐Whitney U test in case of nonnormal distribution. Categorical variables were compared using chi‐square test except for those with n ≤ 5 for 1 or more expected values, for which we used the Fisher exact test. The areas of ROC curves were done for the amplitudes of F wave of leads V1 and aVF to select the optimal cutoff values between patients with and without recurrence. Multivariate logistic regression analysis was used to identify the independent predictors of recurrence after catheter ablation. The F‐wave amplitudes of leads I, V1 and aVF did the multivariate logistic regression, respectively. Statistics were performed on SPSS statistical software (release 18.0, SPSS, Chicago, IL, USA). A p value < 0.05 was considered statistically significant.
RESULTS
Patients’ Characteristics
A total of 54 symptomatic patients with persistent AF underwent radiofrequency catheter ablation at PUMCH between November 2006 and February 2012. Four patients (7%) lost of follow‐up. Therefore, fifty patients constituted the study population. The mean age was 58 ± 11 years, male was predominance (72%). The duration of AF was 9 ± 7 (range from 2 to 18) months. Hypertension (74%) was the most common co‐morbidity, followed by hyperlipidemia (40%), diabetes mellitus (34%), coronary heart disease (22%) and chronic heart failure (18%). Thromboembolism events were seen in 9 patients (18%). Table 1 summarized the patient's characteristics of the study population.
Table 1.
Patients’ Characteristics and Echocardiographic Parameters
| Variables | |
|---|---|
| Male | 36 (72%) |
| Age (years) | 58 ± 11 |
| Height (cm) | 168.64 ± 6.60 (152–183) |
| Weight (kg) | 73.51 ± 11.45 (48–93) |
| BMI (kg/m2) | 25.70 ± 3.00 (17.0–31.4) |
| NYHA functional class | |
| I | 21 (42%) |
| II | 20 (40%) |
| III | 9 (18%) |
| Duration (months) | 9 ± 7 (2–18) |
| Hypertension | 37 (74%) |
| Hyperlipidemia | 20 (40%) |
| Diabetes mellitus | 17 (34%) |
| Coronary heart disease | 11 (22%) |
| Chronic heart failure | 9 (18%) |
| Thromboembolism events | 9 (18%) |
| CHADS2 scores | 2.1 ± 1.3 |
| Echocardiographic parameters | |
| LAD (mm) | 42.42 ± 4.62 (30–59) |
| LVEDD (mm) | 46.82 ± 5.42 (33–67) |
| LVESD (mm) | 28.12 ± 5.42 (19–43) |
| LVEF (%) | 65.00 ± 9.46 (30–81) |
| Pericardial effusion | 9 (18%) |
BMI = body mass index, NYHA = New York Heart Association, LAD = left atrial dimension, LVEDD = left ventricular end of diastolic dimension, LVESD = left ventricular end of systolic dimension, LVEF = left ventricular ejection fraction.
Catheter Ablation Protocol, Medicines during the First 3 Months after Ablation and Follow‐Up
The majority of patients (n = 40, 80%) underwent pulmonary veins isolation and lines lesion (roof and mitral isthmus). Six patients (12%) underwent pulmonary veins isolation only, and 4 patients (8%) underwent pulmonary veins isolation and lines lesion as well as electrogram‐based ablation. AF terminated during catheter ablation in 13 patients (26%), another 37 patients (74%) terminated with electrical cardioversion. All patients took warfarin and the majority of patients took amiodarone or propafenone during the first 3 months after catheter ablation. A total of 24 patients (48%) recurred during the follow‐up of 25 ± 19 months, only 4 patients (8%) underwent repeated catheter ablation. Table 2 summarized the catheter ablation protocol, medicines and follow‐up.
Table 2.
Catheter Ablation Protocol, Medicines during the First 3 months after Ablation and Follow‐Up
| Variables | |
|---|---|
| Catheter ablation protocol | |
| Pulmonary veins isolation | 6 (12%) |
| Pulmonary veins isolation + linesa | 40 (80%) |
| Pulmonary veins isolation + linesa + Egm ablation | 4 (8%) |
| AF termination during catheter ablation | 13 (26%) |
| AF termination with CV | 37 (74%) |
| Medicines during the first 3 months after ablation | |
| Amiodarone | 46 (92%) |
| Propafenone | 3 (6%) |
| Warfarin | 50 (100%) |
| Follow‐up (months) | 25 ± 19 (4–68) |
| Recurrence (%) | 24 (48%) |
| Repeated catheter ablation | 4 (8%) |
Including left atrial roof and isthmus lines, AF = Atrial Fibrillation, CV = Cardioversion.
Validation of F‐Wave Measurement
Intraobserver variability calculation showed a correlation coefficient (r) of 0.94 for the mean amplitude of F‐wave measurements. The Bland and Altman method showed good agreement between the two cardiologists.
Comparison between Patients with and Without Recurrence
The patients in recurrence group were more likely in NYHA functional class III (33% vs 4%, P = 0.026), larger LAD (43.88 ± 4.35 vs 41.08 ± 4.53mm, P = 0.031) and LVEDD (49.83 ± 4.84 vs 44.04 ± 4.40mm, P = 0.001), as well as significantly lower amplitudes of leads aVF (0.085 ± 0.018 vs 0.111 ± 0.036mV, P = 0.002) and V1 (0.116 ± 0.031 vs 0.148 ± 0.047mV, P = 0.008), than the patients in control group. Table 3 summarized the comparison between patients with and without recurrence.
Table 3.
Comparison between Patients with and without Recurrence
| Recurrence | Control | ||
|---|---|---|---|
| (n = 24) | (n = 26) | P | |
| Male (%) | 18 (75%) | 18 (69%) | 0.650 |
| Age (years) | 59.8 ± 10.1 | 56.2 ± 12.2 | 0.269 |
| Height (cm) | 168.5 ± 5.8 | 168.8 ± 7.4 | 0.854 |
| Weight (kg) | 71.5 ± 11.1 | 75.3 ± 11.7 | 0.247 |
| BMI (kg/m2) | 26.2 ± 3.1 | 25.1 ± 2.9 | 0.186 |
| NYHA functional class | 0.026 | ||
| I | 8 (33%) | 13 (50%) | |
| II | 8 (33%) | 12 (46%) | |
| III | 8 (33%) | 1 (4%) | |
| Duration (months) | 74.0 ± 52.7 | 50.7 ± 54.5 | 0.131 |
| Hypertension | 19 (79.2%) | 18 (69.2%) | 0.760 |
| Hyperlipidemia | 10 (41.7%) | 10 (38.5%) | 0.817 |
| Diabetes mellitus | 8 (33.3%) | 9 (34.6%) | 0.924 |
| Coronary heart disease | 5 (20.8%) | 6 (25.0%) | 0.848 |
| Thromboembolism events | 5 (20.8%) | 4 (15.4%) | 0.721 |
| Chronic heart failure | 5 (20.8%) | 4 (15.4%) | 0.721 |
| CHADS2 scores | 2.25 ± 1.23 | 1.92 ± 1.44 | 0.393 |
| Echocardiographic parameters | |||
| LAD (mm) | 43.88 ± 4.35 | 41.08 ± 4.53 | 0.031 |
| LVEDD (mm) | 49.83 ± 4.84 | 44.04 ± 4.40 | 0.001 |
| LVESD (mm) | 29.50 ± 6.14 | 26.85 ± 4.39 | 0.083 |
| LVEF (%) | 65.29 ± 11.80 | 64.73 ± 6.86 | 0.836 |
| Pericardial effusion | 6 (25.0%) | 3 (11.5%) | 0.281 |
| Catheter ablation protocola | 0.519 | ||
| Protocol 1 | 2 (8.3%) | 4 (15.4%) | |
| Protocol 2 | 21 (87.5%) | 19 (73.1%) | |
| Protocol 3 | 1 (4.2%) | 3 (11.5%) | |
| AF termination with CV | 18 (75.0%) | 19 (73.1%) | 1.000 |
| The amplitude of F waves | |||
| Lead I (mV) | 0.053 ± 0.011 | 0.060 ± 0.012 | 0.077 |
| Lead aVF (mV) | 0.085 ± 0.018 | 0.111 ± 0.036 | 0.002 |
| Lead V1 (mV) | 0.116 ± 0.031 | 0.148 ± 0.047 | 0.008 |
BMI = body mass index, NYHA = New York Heart Association, LAD = left atrial dimension, LVEDD = left ventricular end of diastolic dimension, LVESD = left ventricular end of systolic dimension, LVEF = left ventricular ejection fraction, AF = atrial fibrillation, CV = cardioversion.
Protocol 1 = Pulmonary veins isolation, Protocol 2 = Pulmonary veins isolation + roof and isthmus lines, Protocol 3 = Pulmonary veins isolation + roof and isthmus lines + electrogram ablation.
Independent Predictors of AF Recurrence after Catheter Ablation
The multivariate logistic regression analysis showed that the amplitudes of leads aVF (P = 0.023) and V1 (P = 0.031) were the only independent predictors of AF recurrence after adjusting the NYHA functional class, LAD and LVEDD.
Optimal Cutoff Values of F‐Wave Amplitudes of Lead aVF and V1
Based on the areas of ROC curves, the optimal cutoff values of F‐wave amplitude of leads aVF and V1 to predict the recurrence after catheter ablation were < 0.093mV and < 0.123mV, respectively. The sensitivity, specificity, positive and negative predictive values of F‐wave amplitude of lead aVF < 0.093mV to predict the recurrence were 75%, 73%, 72% and 76%. The sensitivity, specificity, positive and negative predictive values of F‐wave amplitude of lead V1 < 0.123mV to predict the recurrence were 68%, 64%, 65% and 67%.
DISCUSSION
The main finding of the present study was the amplitudes of F wave of leads aVF and V1 could predict the recurrence of persistent AF after catheter ablation. The sensitivity and specificity of F‐wave amplitudes of leads aVF < 0.093mV and V1 < 0.123mV were 75% and 73, 68% and 64%. The persistent AF patients in the recurrence group were more likely with the low F‐wave amplitudes of leads aVF and V1. The possible explanation was the F‐wave amplitude reflecting the amount of viable atrial myocyte, the amount of viable atrial myocyte was less in low F‐wave amplitude patients. Therefore, it's difficult to maintain sinus rhythm in persistent AF patients with low F‐wave amplitudes than patients with high F‐wave amplitudes. It had important implications for physician, although it's difficult to measure the accurate F‐wave amplitudes of leads aVF and V1 in the clinics. It could guide the physician to select more suitable persistent AF patients and give more valuable advice about the success and recurrence who planned to undergo catheter ablation. The persistent AF patients with more evident F wave on leads aVF and V1 were more likely to have better outcome after catheter ablation.
The result of present study was consistent with previous study. Nault et al. 10 reported 90 persistent AF patients who underwent catheter ablation, found that higher F‐wave amplitude (≥0.1mV in lead II) at baseline could predict AF termination during catheter ablation and freedom from AF recurrence upon follow‐up. There were several studies about the ECG parameters to predict the development of AF. 11, 12, 13, 14, 15 Perez et al. 11 analyzed 42,751 ECGs and found that the P‐wave index, the standard deviation of P‐wave duration across all leads, was one of the strongest predictors of AF. Bacquer et al. 12 found the combination of longer duration with morphologic changes (notched or deflected) in the P wave was a very important risk indicator for the development of AF over 10 years in apparently healthy subjects aged 55 to 74 years. Ozdemir et al. 13 found that the maximal P‐wave duration > 134.5ms was a predictor of AF in patients with hypertrophic cardiomyopathy. Zhang et al. 14 did a meta‐analysis of ten studies and found prolonged P‐wave duration and signal average P wave increased the risk of AF after coronary artery bypass graft. Xi et al. 15 analyzed F wave in 238 patients with AF and found higher F‐wave frequency in permanent than paroxysmal AF, which was consistent with that F wave was modified by both electrophysiologic and structural remodeling.
There were several limitations of the present study. Firstly, the number of persistent AF patient who underwent catheter ablation was small. Secondly, the recurrence was defined by the recordings of ECG or 24‐hour ECG. The recurrence of asymptomatic patients might be omitted due to the absence of the recordings of ECG or 24‐hour ECG. Thirdly, the measurement of F‐wave amplitude was done with electronic calipers on the Prucka CardioLab recording system and the F wave was identified according to the recording of coronary sinus catheter. Therefore, it's difficult to apply it in the clinics because of lack of the precise tools to identify and measure the F wave on ECG. Although the above limitations, it still had important implications for physicians that the low amplitudes of F wave in leads aVF and V1 predicting the high risk of recurrence of persistent AF patients after catheter ablation.
CONCLUSION
The low amplitudes of F wave in leads aVF and V1 could predict the high risk of recurrence of patients with persistent AF after catheter ablation. However, the predictive values of the amplitudes of F wave need to be further investigated in a large patient cohort.
Disclose: None.
REFERENCES
- 1. Calkins H, Kuck KH, Cappato R, et al. 2012 HRS/EHRA/ECAS Expert Consensus Statement on Catheter and Surgical Ablation of Atrial Fibrillation: recommendations for patient selection, procedural techniques, patient management and follow‐up, definitions, endpoints, and research trial design. Europace 2012;14:528–606. [DOI] [PubMed] [Google Scholar]
- 2. Nademanee K, Schwab MC, Kosar EM, et al. Clinical outcomes of catheter substrate ablation for high‐risk patients with atrial fibrillation. J Am Coll Cardiol 2008;51:843–849. [DOI] [PubMed] [Google Scholar]
- 3. Sauer WH, McKernan ML, Lin D, et al. Clinical predictors and outcomes associated with acute return of pulmonary vein conduction during pulmonary vein isolation for treatment of atrial fibrillation. Heart Rhythm 2006;3:1024–1028. [DOI] [PubMed] [Google Scholar]
- 4. Jongnarangsin K, Chugh A, Good E, et al. Body mass index, obstructive sleep apnea, and outcomes of catheter ablation of atrial fibrillation. J Cardiovasc Electrophysiol 2008;19:668–672. [DOI] [PubMed] [Google Scholar]
- 5. Xi Q, Sahakian AV, Ng J, et al. Atrial fibrillatory wave characteristics on surface electrogram: ECG to ECG repeatability over twenty‐four hours in clinically stable patients. J Cardiovasc Electrophysiol 2004;15:911–917. [DOI] [PubMed] [Google Scholar]
- 6. Yamamoto S, Suwa M, Ito T, et al. Comparison of frequency of thromboembolic events and echocardiographic findings in patients with chronic nonvalvular atrial fibrillation and coarse versus fine electrocardiographic fibrillatory waves. Am J Cardiol 2005;96:408–411. [DOI] [PubMed] [Google Scholar]
- 7. National Kidney Foundation . K/DOQI clinical practice guidelines for chronic kidney disease: Evaluation, classification, and stratification. Am J Kidney Dis 2002;39:S1–266. [PubMed] [Google Scholar]
- 8. Gardin JM, Adams DB, Douglas PS, et al. American Society of Echocardiography. Recommendations for a standardized report for adult transthoracic echocardiography: A report from the American Society of Echocardiography's Nomenclature and Standards Committee and Task Force for a Standardized Echocardiography Report. J Am Soc Echocardiogr 2002;15:275–290. [DOI] [PubMed] [Google Scholar]
- 9. Bland JM, Altman DG. Statistical methods for assessing agreement between two methods of clinical measurement. Lancet 1986;1:307–310. [PubMed] [Google Scholar]
- 10. Nault I, Lellouche N, Matsuo S, et al. Clinical value of fibrillatory wave amplitude on surface ECG in patients with persistent atrial fibrillation. J Interv Card Electrophysiol 2009;26:11–19. [DOI] [PubMed] [Google Scholar]
- 11. Perez MV, Dewey FE, Marcus R, et al. Electrocardiographic predictors of atrial fibrillation. Am Heart J 2009;158:622–628. [DOI] [PubMed] [Google Scholar]
- 12. De Bacquer D, Willekens J, De Backer G. Long‐term prognostic value of p‐wave characteristics for the development of atrial fibrillation in subjects aged 55 to 74 years at baseline. Am J Cardiol 2007;100:850–854. [DOI] [PubMed] [Google Scholar]
- 13. Ozdemir O, Soylu M, Demir AD, et al. P‐wave durations as a predictor for atrial fibrillation development in patients with hypertrophic cardiomyopathy. Int J Cardiol 2004;94:163–166. [DOI] [PubMed] [Google Scholar]
- 14. Zhang BC, Che WL, Li WM, et al. Meta‐analysis of P wave character as predictor of atrial fibrillation after coronary artery bypass grafting. Int J Cardiol 2011;152:260–262. [DOI] [PubMed] [Google Scholar]
- 15. Xi Q, Sahakian AV, Frohlich TG, et al. Relationship between pattern of occurrence of atrial fibrillation and surface electrocardiographic fibrillatory wave characteristics. Heart Rhythm 2004;1:656–663. [DOI] [PubMed] [Google Scholar]