

Abstract
Introduction: The aim of the study was to assess the time course effect of IKr blockade on ECG biomarkers of ventricular repolarization and to evaluate the accuracy of a fully automatic approach for QT duration evaluation.
Methods: Twelve‐lead digital ECG Holter was recorded in 38 healthy subjects (27 males, mean age = 27.4 ± 8.0 years) on baseline conditions (day 0) and after administration of 160 mg (day 1) and 320 mg (day 2) of d‐l sotalol. For each 24‐hour period and each subject, ECGs were extracted every 10 minutes during the 4‐hour period following drug dosage. Ventricular repolarization was characterized using three biomarker categories: conventional ECG time intervals, principal component analysis (PCA) analysis on the T wave, and fully automatic biomarkers computed from a mathematical model of the T wave.
Results: QT interval was significantly prolonged starting 1 hour 20 minutes after drug dosing with 160 mg and 1 hour 10 minutes after drug dosing with 320 mg. PCA ventricular repolarization parameters sotalol‐induced changes were delayed (>3 hours). After sotalol dosing, the early phase of the T wave changed earlier than the late phase prolongation. Globally, the modeled surrogate QT paralleled manual QT changes.
The duration of manual QT and automatic surrogate QT were strongly correlated (R2= 0.92, P < 0.001). The Bland and Altman plot revealed a nonstationary systematic bias (bias = 26.5 ms ± 1.96*SD = 16 ms).
Conclusions: Changes in different ECG biomarkers of ventricular repolarization display different kinetics after administration of a potent potassium channel blocker. These differences need to be taken into account when designing ventricular repolarization ECG studies.
Ann Noninvasive Electrocardiol 2010;15(1):26–35
Keywords: ECG, ventricular repolarization, sotalol
The interaction of cardiac or noncardiac drugs with ventricular repolarization is a well‐recognized safety concern linked to the risk of drug‐induced life‐threatening ventricular arrhythmias. 1 , 2 , 3 Ventricular repolarization evaluation has been centered on its duration, a parameter that can be accurately evaluated measuring QT interval duration from the surface ECG.
Although it is still considered as a “gold standard,” QT interval is hampered by both methodological and pathophysiological limitations. Indeed, accurate QT end evaluation is not simple. Manual measurement remains recommended as a standard. 4 As a consequence the precise QT duration evaluation is based on time‐consuming and expensive expert analyses. Hence a reliable automatic method for QT duration measurement is strongly needed.
An even more critical weakness is in that QT/QTc duration alone is clearly not a good surrogate for the risk of drug‐induced torsades de pointes. 5 , 6 Experimental data strongly suggest that spatial and/or temporal heterogeneities of ventricular repolarization may provide more accurate indexes for arrhythmic substratum in drug‐induced QT prolongation condition as well as in numerous other arrhythmic conditions. 7 , 8 , 9 , 10 , 11 , 12
Accordingly, the search for ECG biomarkers of ventricular repolarization heterogeneities has become a main area of investigation. Both experimental and in silico models suggest that morphology parameter of the T wave might enable to assess the degree of ventricular repolarization dispersion. 13 , 14 Hence, both scalar measurements and principal component analysis (PCA) have been used to describe T‐wave morphology and changes in T‐wave morphology parameters have been associated with impaired repolarization and bad prognosis. 15 , 16 , 17 , 18 , 19 , 20 The relative time course of QT prolonging drugs effect on these new biomarkers has been so far poorly evaluated.
The aim of this study was twofold: (1) to assess the time course effect of IKr blockade (a condition associated with both QT prolongation, increased dispersion of ventricular repolarization, and a risk of torsades de pointes) on ECG biomarkers of ventricular repolarization (2) to evaluate the accuracy of a fully automatic approach for QT duration evaluation. We took advantage of a previous study 21 in which single‐dose administration design enables the assessment of sotalol effect at different plasma concentration.
METHODS
Study Population and Design
The study population consisted of 38 healthy subjects (27 males, mean age = 27.4 ± 8.0 years) in whom 12‐lead digital ECG Holter was recorded on two or three consecutive days. No drug was given on the first day (baseline), while 160 mg of d‐l Sotalol was given on the second day (single dose) 1 hour after the start of the recording and 320 mg was given on the third day (double dose) to a subset of the initial group. Sotalol blood plasma concentration was also measured at fixed time points. Full details of the study protocol have been previously described. 21
ECG Recordings
From the 24‐hour Holter 12 leads recording (H12 recorders, Mortara Instrument, Milwaukee, WI, USA), 10‐second long strips were automatically extracted at predefined time points using the Antares software (AMPS llc, New York, NY, USA). The exported ECGs were the least noise‐affected strips among those with normal beats and preceded by stable heart rate. ECG snapshots were extracted every 10 minutes starting at 8 AM and ending at noon, just prior to meal intake leading to 25 ECGs per recording for each subject (Fig. 1 panel A).
Figure 1.
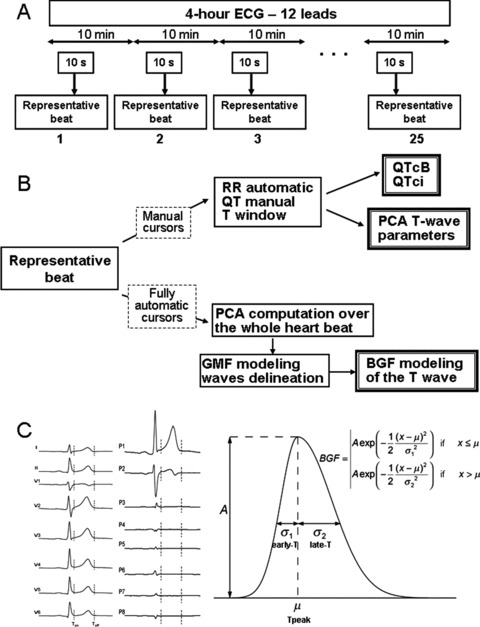
(A) Study design and time points for ECG extraction. (B) Biomarker categories: (1) manual cursors are set for both conventional ECG time intervals and markers derived from a PCA analysis on the T wave, (2) fully automatic biomarkers computation from the bi‐Gaussian function (BGF) model. (C) Left part: standard eight‐lead ECG change to PCA eight‐lead transformation. Right part: Bi‐Gaussian function model of the T wave.
Biomarkers
All measurements were computed on representative median beats derived from the available consecutive cardiac cycles of each 12 leads snapshot.
To characterize ventricular repolarization, three biomarker categories were considered (Fig. 1 panel B): (i) conventional ECG time intervals: QT interval, corrected QT, and heart rate; (ii) 3D markers derived from a PCA analysis on the T wave; and (iii) fully automatic biomarkers computed from a mathematical model of the T wave named bi‐Gaussian function (BGF).
For each representative beat QRS onset/offset and T offset calipers were set manually by an experienced cardiologist (FE). These cursors were used only for conventional and PCA analyses whereas the Bi‐Gaussian modeling was fully automatic.
Conventional Manual ECG Time Intervals: QT, RR, QTci, QTcB
QT duration was corrected for heart rate using correcting formula derived from the power‐law (log‐log) QT/RR model: QTc = QT/RRα where α= 0.5 for the Bazett's correction (QTcB) or α= i estimated from the individual QT/RR relationship (QTci). 22 , 23
3D Manual Vectocardiographic Approach
PCA analysis was based on singular value decomposition. 24 , 25 , 26 , 27
Using PCA on 12‐lead ECGs, the orthogonal eigenvectors delineate an eight‐dimensional space whereas the eigenvalues (λ1, … , λ8) represent the energy in each dimension. Singular value decomposition was applied independently on QRS complex and T wave to obtain the eigenvectors and the eigenvalues for each part of the signal. The angle θ between QRS and T is defined as the angle between the principal vector of the QRS complex, and the principal vector extracted from the T wave.
The projection of the T wave on the subspace defined by the last five eigenvectors is commonly named the nondipolar components The “T‐wave residuum” (TWR) is defined as the ratio between the energy of the nondipolar component to the total energy of the T wave:
 |
In each dimension, the dispersion of the T‐wave PCA loop is given by sigma (σi, expressed in mV) where σi is defined as  , i = 1 … 8. The ratio of the second to the first σ (σ2/σ1) is the so‐called PCA ratio and provides an estimate of the roundness of the PCA T‐wave loop.
BGF Mathematical Model
The P, QRS, and T‐wave extraction from each representative cardiac complex is obtained with a fully automatic procedure. 28 , 29 , 30
Subsequently, the projection of the T wave on the PCA principal dimension is modeled by a four‐parameter function called bi‐Gaussian function estimated by minimization of the least‐square error between the BGF model and the T‐wave signal.
For a given T wave, the BGF model is computed with the following outputs: “A” as the T‐wave amplitude surrogate measured at Tpeak, “early‐T” fitting the ascending phase of the T‐wave and “late‐T” describing the descending phase of the T wave (Fig. 1, panel C). The ratio between the ascending and descending phases (early/late) was also computed. Finally, the sum in milliseconds of QTpeak interval + 2·late‐T was calculated as a surrogate for the total QT interval duration.
Statistical Analysis
Normality distribution was verified for all parameters (ECG, PCA, and GMF), and correlation matrices were computed.
Averaged values of parameters were compared between time‐matched baseline and the two drug‐dosing levels using the paired t‐test with a confidence interval of 95%.
Subsequently, all parameters were analyzed involving the development of generalized linear model (GLM), using Minitab statistical software (Minitab Inc., State College, PA, USA). We built various GLM models for the identification of the best parameter that could first identify the presence of drugs. We then compared the time‐matched data, to identify the first time point and the time‐interval at which each GLM model (one for each analyzed parameter) would be significant in identifying the presence of the drug, both for single and double dose. All GLMs were corrected for RR as covariate and the comparison was computed using Bonferroni's method and with a confidence interval of 95%.
In all tests a P value < 0.05 was considered statistically significant.
RESULTS
Sotalol Effect on Ventricular Repolarization Parameters at Maximum Drug Concentration
Table 1 shows the sotalol effect at maximum plasma concentration on ventricular repolarization parameters. Sotalol administration was followed by an increase of the RR, QT, and QTci interval durations. PCA parameters changes were not statistically significant at Tmax for both single and double dose of sotalol.
Table 1.
ECG Ventricular Repolarization Biomarkers
| Baseline | Sotalol 160 mg | Sotalol 320 mg | |
|---|---|---|---|
| Time for tmax | 2h50′± 47′ | 2h44′± 52′ | |
| Sotalol plasma concentration (ng/mL) | 1490 ± 376 | 3164 ± 667 | |
| RR (ms) | 898 ± 142 | 1096 ± 150* | 1149 ± 117*† |
| QT (ms) | 373 ± 25 | 440 ± 27* | 462 ± 33*† |
| QTci (ms) | 387 ± 16 | 427 ± 29* | 438 ± 28*† |
| TWR | 0.059 ± 0.026 | 0.063 ± 0.026 | 0.062 ± 0.018 |
| PCA ratio | 0.19 ± 0.08 | 0.22 ± 0.13 | 0.22 ± 0.07 |
| QRS‐T angle | 49 ± 29 | 51 ± 38 | 48 ± 30 |
| A (μV) | 721 ± 273 | 742 ± 286 | 742 ± 181* |
| QTpeak (ms) | 286 ± 25 | 340 ± 26* | 351 ± 28*† |
| Early‐T (ms) | 68 ± 16 | 99 ± 19* | 116 ± 24*† |
| Late‐T (ms) | 30 ± 5 | 40 ± 13* | 45 ± 11*† |
| Early/Late | 2.3 ± 0.8 | 2.6 ± 0.6 | 2.6 ± 0.5* |
| Surrogate QT (ms) | 346 ± 28 | 420 ± 32* | 441 ± 37*† |
| Tpeak‐Tend (ms) | 59 ± 10 | 81 ± 25* | 90 ± 22*† |
Tmax effect of Sotalol 160 mg and 320 mg versus time‐matched baseline.
*P < 0.05 versus baseline, †P < 0.05 versus sotalol 160 mg. QTci= QT heart rate corrected with subject‐specific formula; TWR = T‐wave residuum; PCA = principal component analysis; A = Amplitude at T peak. The value of the different parameters are not corrected for heart rate.
The T‐wave mathematical model outputs were significantly prolonged at Tmax after both low and high sotalol dosing. Paralleling sotalol‐induced QT prolongation, the QT mathematical surrogate QT was prolonged up to 80 ms. The ascending phase of the T wave (early‐T) was prolonged in average by 31 ms and 48 ms with sotalol 160 mg and 320 mg respectively, whereas the descending phase of the T wave (late‐T) was prolonged by 10 ms and 15 ms, respectively.
Time Course of Sotalol Effect on Ventricular Repolarization Parameters
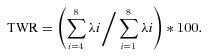
The upper panel of Figure 2 displays the sotalol plasma concentration after sotalol 160 mg administration.
Figure 2.
Upper panel: time course of sotalol concentration after single‐dose administration (160 mg). Lower panels: sotalol effects on ventricular repolarization biomarkers expressed as a percentage change relative to the baseline period. H0 to H4: time after sotalol administration in hours (H).
The first time point at which ECG models significantly identified a drug effect, both for single and double dose is presented in Table 2 and Figure 2.
Table 2.
Time Point of First Statistically Significant Time‐Matched Difference
| Sotalol 160 mg | Sotalol 320 mg | |||
|---|---|---|---|---|
| Time First Significant | Δ Versus Baseline | Time First Significant | Δ Versus Baseline | |
| QT (ms) | 1 h 20 min | 14 | 1 h 10 min | 26 |
| QTci (ms) | 1 h 20 min | 15 | 1 h 10 min | 23 |
| TWR | 3 h 10 min | 0.019 | 2 h 50 min | 0.015 |
| PCA ratio | NS | NS | ||
| QRS‐T angle | NS | NS | ||
| A (μV) | 3 h 20 min | −101 | 1 h 00 min | −137 |
| QTpeak (ms) | 2 h 10 min | 23 | 1 h 50 min | 19 |
| Early‐T (ms) | 1 h 20 min | 9 | 1 h 20 min | 14 |
| Late‐T (ms) | 3 h | 8 | 2 h 10 min | 8 |
| Early/Late | 2 h | 0.38 | NS | |
| Surrogate QT (ms) | 1 h 30 min | 18 | 1 h 10 min | 27 |
| Tpeak‐Tend (ms) | 2 h 40 min | 11 | 2 h 10 min | 16 |
P value < 0.05 was considered statistically significant. QTci= QT heart rate corrected with subject specific formula; TWR = T‐wave residuum; PCA = principal component analysis; A = amplitude at Tpeak; NS = significance never reached. Each GLM model was corrected for heart rate.
The duration of the QT interval is significantly prolonged 1 hour 10 minutes after 320 mg drug dosing and 1 hour 20 minutes after 160 mg dosing. Rate corrected QTci showed almost identical results.
PCA ventricular repolarization parameters sotalol‐induced changes were delayed when compared to QT changes.
Automatic modeling data provide further information. After sotalol dosing, early‐T changes preceded late‐T prolongation. Accordingly, the early/late ratio changed significantly 2 hours after sotalol 160 mg dosing but no significant change was observed after the second sotalol dosing. Globally, the modeled surrogate QT paralleled manual QT changes (Figure 2).
T‐wave amplitude time course changes showed a biphasic pattern at sotalol low dose, and a decrease at high dose, more pronounced at later stages.
Table 3 displays the maximum time‐matched sotalol effect on all ventricular repolarization parameters. With the exception of the early/late T‐wave ratio, all parameters showing a significant increase continued to increase reaching a maximum sotalol effect before the end of the time window evaluated in the study.
Table 3.
Time Point of Maximal Significant Time‐Matched Difference
| Sotalol 160 mg | Sotalol 320 mg | |||
|---|---|---|---|---|
| Time of Max Effect | Δ Versus Baseline | Time of Max Effect | Δ Versus Baseline | |
| QT (ms) | 3 h 40 min | 45 | 3 h 10 min | 59 |
| QTci (ms) | 3 h 30 min | 45 | 3 h 10 min | 57 |
| TWR | 3 h 50 min | 0.023 | 4 h | 0.018 |
| PCA ratio | NS | NS | ||
| QRS‐T angle | NS | NS | ||
| A (μV) | 4 h | −105 | 3 h 40 min | −204 |
| QTpeak (ms) | 3 h 40 min | 29 | 3 h 40 min | 40 |
| Early‐T (ms) | 4 h | 25 | 3 h 40 min | 38 |
| Late‐T (ms) | 3 h 50 min | 9 | 3 h 40 min | 10 |
| Early/Late | 2 h | 0.38 | NS | |
| Surrogate QT (ms) | 3 h 40 min | 48 | 3 h 40 min | 67 |
| Tpeak‐Tend (ms) | 3 h 30 min | 18 | 3 h 00 min | 19 |
P value < 0.05 was considered statistically significant. QTci = QT heart rate corrected with subject‐specific formula; TWR = T‐wave residuum; PCA = principal component analysis; A = amplitude at Tpeak; NS = significance never reached. GLM model was corrected for heart rate.
Accuracy of the Fully Automatic Method
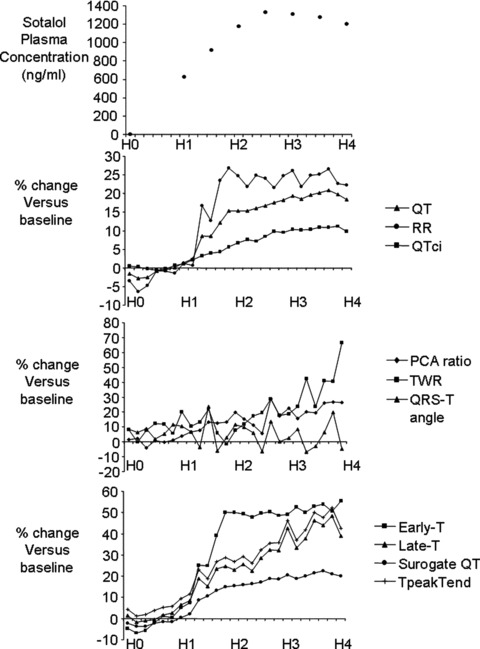
In Figure 3 (panel A) the relationship between manual QT and automatic surrogate QT is shown. The two measures were strongly correlated (automatic QT = 1.06 * manual QT − 48.5, R2= 0.92, P < 0.001). Panel B displays the Bland and Altman plot: the systematic bias was 26.5 ms with 1.96*SD lower and upper bound equal 10.5 ms and 42.5 ms, respectively. The bias was, however, slightly but significantly dependent on QT duration (y =−0.102 * x + 63.8, R2= 0.108, P < 0.001).
Figure 3.
Panel A: relationship between manual QT interval (x‐axis) and the automatic QT interval (y‐axis). Panel B: Bland and Altman plot of manually and automatically measured QT interval duration.
DISCUSSION
Main Results
After single‐dose sotalol administration QT/QTc duration is the first parameter derived from surface ECG that is significantly modified. Parameters extracted from mathematical modeling on the T wave occurred almost simultaneously. The bi‐Gaussian function modeling of T wave provided additional information. T‐wave morphology components showed different time constants; the ascending phase of the T wave being the first influenced by sotalol, followed by T‐wave symmetry changes and finally changes in the descending phase of the T wave. Finally, PCA derived T‐wave parameters changes occurred at later times.
Effect of Sotalol on Ventricular Repolarization Biomarkers
Our results on the marked effects of sotalol on RR, QT, and QTc intervals are in good agreement with the previously published literature. 21 , 23 , 31 The delay observed between the maximal drug plasma concentration and the maximal effect on ventricular repolarization is more interesting. This hysteresis was observed on the same database whatever the method used for QT correction 21 , 23 and is a well‐identified phenomenon, 32 which represents a great concern for the use of pharmacokinetic/pharmacodynamic models in drug‐induced QT prolongation evaluation. The lack of significant changes in PCA T‐wave parameters observed in this study at maximum sotalol plasma concentration could be a consequence of such hysteresis. Nevertheless, the poor PCA performance with such a strong IKr blocking drug is somewhat disappointing. Part of this result may be related to the relatively high intrinsic variability in PCA T‐wave parameters. 24
Beyond QT interval duration, recently developed mathematical modeling showed that potassium channel loss of function is associated with profound T‐wave morphology variation. 33 , 34 , 35
Time Course of Ventricular Repolarization Biomarkers after Single‐Dose Sotalol Administration
The earliest effect of IKr blockade on ventricular repolarization is a prolongation of the ascending phase of the T wave. The effect on the descending phase of the T wave only occurred around 1 hour later.
The significance of these different kinetics responses after sotalol administration is unclear but clearly shows that IKr blockade effect on repolarization biomarkers displays different time constants. It might be critical to take into account such kinetics heterogeneities in particular when trying to differentiate between low and high risk for drug‐induced torsades de pointes.
The lack of significant change of PCA ratio and QRS‐T angle may be a consequence of a limited observation period as it can be suggested by the delayed increase in TWR observed at the end of the recording period. In this regard, it would have been interesting to prolong the exploratory period. Unfortunately, the study protocol included a meal 4 hours after drug dosing that produced an important effect mainly represented by dramatic heart rate acceleration. This heart rate effect together with the well‐known autonomic influence of meal intake and the also thoroughly documented effect of both heart rate and autonomic nervous system on ventricular repolarization prevented us to evaluate sotalol effects on ventricular repolarization parameters after the 4‐hour period described in our protocol. 36 , 37 , 38 This, however, represents a main limitation of our study.
Effect of Sotalol on T‐Wave Amplitude
The description of sotalol effect on T‐wave amplitude deserves further clarification. It is likely that the effects of sotalol on the T‐wave amplitude are twofold.
First, a heart rate‐related effect, the amplitude of T‐wave apex relative to baseline has been shown to be rate dependent in normal subject. 39 This effect was also observed in this study after pooling baseline and placebo data (Fig. 4 upper panel). Since sotalol decreases heart rate, the T‐wave amplitude increases (Fig. 4 lower panel).
Figure 4.
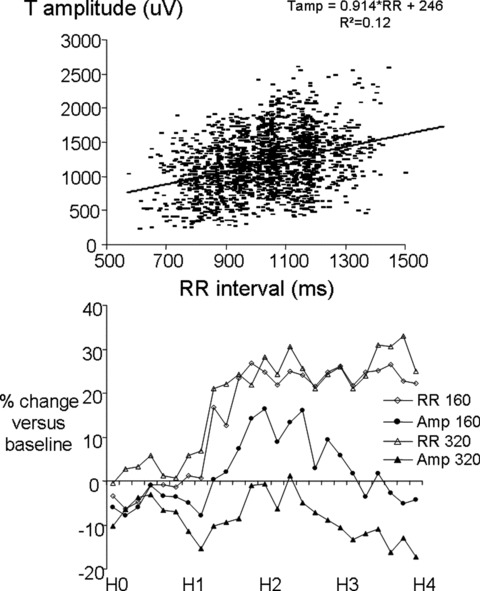
Upper panel: relationship between RR interval (x‐axis) and T‐wave amplitude (y‐axis). Lower panel: Drug's effects expressed as a percentage change relative to the baseline period on RR interval and T‐wave amplitude after sotalol 160 mg and 320 mg administration. H0 to H4: time after sotalol administration in hours (H).
Second, a direct electrophysiological effect consisting in a decrease in T amplitude induced by IKr blockade. This effect has been described by Vaglio et al. using a rate binning approach. 34 In our study, during the last 2 hours of the recordings, T‐wave amplitude decreases while heart rate remains stable suggesting a delayed and long‐lasting effect of sotalol on T‐wave amplitude (Fig. 4 lower panel). The direct effect is initially masked by the early heart rate decrease, and it is more clearly revealed once the heart rate becomes stable.
These phenomena explain why despite sotalol decreases T‐wave amplitude, the rate uncorrected T‐wave amplitude at maximal sotalol plasma concentration showed a counterintuitive augmentation (Table 1).
The reason why IKr blockade decreases T‐wave amplitude is not clear. Simulation studies rather suggest that IKr blockade should increase T‐wave amplitude. 40
These complicated explanations emphasize the difficulties encountered when trying to analyze and interpret ventricular repolarization changes.
Fully Automatic Approach for T‐Wave Morphology Characterization
Our results show that mathematical modeling of the T‐wave allows detecting subtle electrophysiological effects.
Despite a strong correlation, the GMF‐based QT surrogate QT is not equivalent to QT duration. Indeed, the two parameters display a significant and systematic bias with an average level of the QT surrogate of about 25 ms shorter than the measured QT duration. In addition, the bounds of the Bland and Altman plots are larger than 15 ms, thus corresponding to an unacceptable imprecision when keeping in mind the accuracy requested in thorough QT studies. 4 More critically, this bias was dependent on QT duration leading to potential underestimation of QT interval duration for QT durations longer than 370 ms.
Nevertheless, the fully automatic method we used was sufficient to detect sotalol effect on QT duration as early as the time‐consuming manual method. This method could thus be proposed as the first‐step crude analysis.
Conclusions
Using ECG extraction from long‐term 12‐lead Holter recordings we could show that changes in different ECG biomarkers of ventricular repolarization display different kinetics after administration of a potent potassium channel blocker. These differences need to be taken into account when designing ventricular repolarization ECG studies. Recent ECG technologies allow automatic calculation of most of the repolarization biomarkers.
Acknowledgments
Acknowledgment: We are thankful to Dr. Nenad Sarapa for allowing us to use the Holter recordings of this sotalol study.
Conflict of interest: None.
REFERENCES
- 1. Crouch MA, Limon L, Cassano AT. Clinical relevance and management of drug‐related QT interval prolongation. Pharmacotherapy 2003;23:881–908. [DOI] [PubMed] [Google Scholar]
- 2. Ray WA, Murray KT, Meredith S, et al Oral erythromycin and the risk of sudden death from cardiac causes. N Engl J Med 2004;351:1089–1096. [DOI] [PubMed] [Google Scholar]
- 3. Curtis LH, Ostbye T, Sendersky V, et al Prescription of QT‐prolonging drugs in a cohort of about 5 million outpatients. Am J Med 2003;114:135–141. [DOI] [PubMed] [Google Scholar]
- 4. International Conference on Harmonisation (ICH): The clinical evaluation of QT/QTc interval prolongation and proarrhythmic potential for non‐antiarrhythmic drugs. http://www.fda.gov/cder/guidance/6922fnl.pdf last accessed August 21st 2008. [PubMed]
- 5. Redfern WS, Carlsson L, Davis AS, et al Relationships between preclinical cardiac electrophysiology, clinical QT interval prolongation and torsade de pointes for a broad range of drugs: Evidence for a provisional safety margin in drug development. Cardiovasc Res 2003;58:32–45. [DOI] [PubMed] [Google Scholar]
- 6. Vos MA, Van Opstal JM, Leunissen JD, et al Electrophysiologic parameters and predisposing factors in the generation of drug‐induced torsade de pointes arrhythmias. Pharmacol Ther 2001;92:109–122. [DOI] [PubMed] [Google Scholar]
- 7. Kuo CS, Munakata K, Reddy CP, et al Characteristics and possible mechanism of ventricular arrhythmia dependent on the dispersion of action potential durations. Circulation 1983;67:1356–1367. [DOI] [PubMed] [Google Scholar]
- 8. Di Diego JM, Belardinelli L, Antzelevitch C. Cisapride‐induced transmural dispersion of repolarization and torsade de pointes in the canine left ventricular wedge preparation during epicardial stimulation. Circulation 2003;108:1027–1033. [DOI] [PubMed] [Google Scholar]
- 9. Extramiana F, Antzelevitch C. Amplified transmural dispersion of repolarization as the basis for arrhythmogenesis in a canine ventricular wedge model of Short QT. Circulation 2004;110:3661–3666. [DOI] [PubMed] [Google Scholar]
- 10. Antzelevitch C, Oliva A. Amplification of spatial dispersion of repolarization underlies sudden cardiac death associated with catecholaminergic polymorphic VT, long QT, short QT and Brugada syndromes. J Intern Med 2006;259:48–58. [DOI] [PMC free article] [PubMed] [Google Scholar]
- 11. Hayashi M, Takatsuki S, Maison‐Blanche P, et al Ventricular repolarization restitution properties in patients exhibiting type 1 Brugada electrocardiogram with and without inducible ventricular fibrillation. J Am Coll Cardiol 2008;51:1162–1168. [DOI] [PubMed] [Google Scholar]
- 12. Lacroix D, Extramiana F, Delfaut P, et al Factors affecting epicardial dispersion of repolarization: A mapping study in the isolated porcine heart. Cardiovasc Res 1999;41:563–574. [DOI] [PubMed] [Google Scholar]
- 13. Yan GX, Antzelevitch C. Cellular basis for the normal T wave and the electrocardiographic manifestations of the long‐QT syndrome. Circulation 1998;98:1928–1936. [DOI] [PubMed] [Google Scholar]
- 14. Gima K, Rudy Y. Ionic current basis of electrocardiographic waveforms: A model study. Circ Res 2002;90:889–896. [DOI] [PMC free article] [PubMed] [Google Scholar]
- 15. Lupoglazoff JM, Denjoy I, Berthet M, et al Notched T waves on Holter recordings enhance detection of patients with LQt2 (HERG) mutations. Circulation 2001;103:1095–1101. [DOI] [PubMed] [Google Scholar]
- 16. Viitasalo M, Oikarinen L, Swan H, et al Ambulatory electrocardiographic evidence of transmural dispersion of repolarization in patients with long‐QT syndrome type 1 and 2. Circulation 2002;106:2473–2478. [DOI] [PubMed] [Google Scholar]
- 17. Smetana P, Pueyo E, Hnatkova K, et al Effect of amiodarone on the descending limb of the T wave. Am J Cardiol 2003;92:742–746. [DOI] [PubMed] [Google Scholar]
- 18. Extramiana F, Denjoy I, Badilini F, et al Heart rate influences on repolarization duration and morphology in symptomatic and asymptomatic KCNQ1 mutation carriers. Am J Cardiol 2005;95:406–409. [DOI] [PubMed] [Google Scholar]
- 19. Smetana P, Batchvarov VN, Hnatkova K, et al Ventricular gradient and nondipolar repolarization components increase at higher heart rate. Am J Physiol Heart Circ Physiol 2004;286:H131–H136. [DOI] [PubMed] [Google Scholar]
- 20. Okin PM, Devereux RB, Fabsitz RR, et al Principal component analysis of the T wave and prediction of cardiovascular mortality in American Indians: The Strong Heart Study. Circulation 2002;105:714–719. [DOI] [PubMed] [Google Scholar]
- 21. Sarapa N, Morganroth J, Couderc JP, et al Electrocardiographic identification of drug‐induced QT prolongation: Assessment by different recording and measurement methods. Ann Noninvasive Electrocardiol 2004;9:48–57. [DOI] [PMC free article] [PubMed] [Google Scholar]
- 22. Malik M, Farbom P, Batchvarov V, et al Relation between QT and RR intervals is highly individual among healthy subjects: Implications for heart rate correction of the QT interval. Heart 2002;87:220–228. [DOI] [PMC free article] [PubMed] [Google Scholar]
- 23. Extramiana F, Badilini F, Sarapa N, et al Contrasting time and rate based approaches for the assessment of drug‐induced QT changes. J Clin Pharmacol 2007;47:1129–1137. [DOI] [PubMed] [Google Scholar]
- 24. Extramiana F, Haggui A, Maison‐Blanche P, et al Principal component analysis of the T wave is reproducible and is not dependent on T‐offset position. Ann Non invasive Electrocardiol 2007;12:354–363. [DOI] [PMC free article] [PubMed] [Google Scholar]
- 25. Damen AA, Van Der Kam J. The use of the singular value decomposition in electrocardiography. Med Biol Eng Comput 1982;20:473–482. [DOI] [PubMed] [Google Scholar]
- 26. Acar B, Koymen H. SVD‐based on‐line exercise ECG signal orthogonalization. IEEE Trans Biomed Eng 1999;46:311–321. [DOI] [PubMed] [Google Scholar]
- 27. Acar B, Yi G, Hnatkova K, et al Spatial, temporal and wavefront direction characteristics of 12‐lead T‐wave morphology. Med Biol Eng Comput 1999;37:574–584. [DOI] [PubMed] [Google Scholar]
- 28. Dubois R, Quenet B, Faisandier Y, et al Building meaningful representations for nonlinear modeling of 1d and 2d‐signals: Applications to biomedical signals. Neurocomputing 2006;69:2180–2192. [Google Scholar]
- 29. Dubois R, Maison‐Blanche P, Quenet B, et al Automatic ECG wave extraction in long‐term recordings using Gaussian mesa function models and nonlinear probability estimators. Comp Methods Programs Biomed 2007;88:217–233. [DOI] [PubMed] [Google Scholar]
- 30. Badilini F, Vaglio M, Dubois R, et al Automatic analysis of cardiac repolarization morphology using Gaussian Mesa function modelling. J Electrocardiol 2008;41:588–594. [DOI] [PubMed] [Google Scholar]
- 31. Funck‐Brentano C, Kibleur Y, Le Coz F, et al Rate dependence of sotalol‐induced prolongation of ventricular repolarization during exercise in humans. Circulation 1991;83:536–545 [DOI] [PubMed] [Google Scholar]
- 32. Minematsu T, Ohtani H, Yamada Y, et al Quantitative relationship between myocardial concentration of tacrolimus and QT prolongation in guinea pigs: Pharmacokinetic/pharmacodynamic model incorporating a site of adverse effect. J Pharmacokinet Pharmacodyn 2001;28:533–554. [DOI] [PubMed] [Google Scholar]
- 33. Vaglio M, Couderc JP, McNitt S, et al A quantitative assessment of T‐wave morphology in LQT1, LQT2, and healthy individuals based on Holter recording technology. Heart Rhythm 2008;5:11–18. [DOI] [PubMed] [Google Scholar]
- 34. Couderc JP, Vaglio M, Xia X, et al Impaired T‐amplitude adaptation to heart rate characterizes I(Kr) inhibition in the congenital and acquired forms of the long QT syndrome. J Cardiovasc Electrophysiol 2007;18:1299–1305. [DOI] [PubMed] [Google Scholar]
- 35. Couderc JP, Zareba W, Moss AJ, et al Identification of sotalol‐induced changes in repolarization with T wave area‐based repolarization duration parameters. J Electrocardiol 2003;36(Suppl.):115–120. [DOI] [PubMed] [Google Scholar]
- 36. Nagy D, DeMeersman R, Gallagher D, et al QTc interval (cardiac 875 repolarization): Lengthening after meals. Obesity Res 1997;5:531–537. [DOI] [PubMed] [Google Scholar]
- 37. Extramiana F, Maison‐Blanche P, Badilini F, et al Circadian modulation of QT rate‐dependence in healthy volunteers: Gender and age differences. J Electrocardiol 1999;32:33–43. [DOI] [PubMed] [Google Scholar]
- 38. Extramiana F, Maison‐Blanche P, Tavernier R, et al Cardiac effects of chronic oral beta‐blockade: Lack of agreement between heart rate and QT interval changes. Ann Noninvasive Electrocardiol 2002;7:379–388. [DOI] [PMC free article] [PubMed] [Google Scholar]
- 39. Extramiana F, Leenhardt A, Maison‐Blanche P. ECG evaluation of ventricular properties: The importance of cardiac cycle length. Ann Noninvasive Electrocardiol 2009;14(Suppl. 1):S54–S59. [DOI] [PMC free article] [PubMed] [Google Scholar]
- 40. Gima K, Rudy Y. Ionic current basis of electrocardiographic waveforms: A model study. Circ Res 2002;90:889–896. [DOI] [PMC free article] [PubMed] [Google Scholar]