

Abstract
Background: Magnetocardiography (MCG) is a noninvasive technology that measures the magnetic field of the heart by superconducting quantum interference devices (SQUID) sensors. The novelty of the present system is that the sensors can be operated without electromagnetic shielding of the examination room, thus allowing the system to be easily installed in the emergency department or chest pain unit. Studies in shielded rooms, found that this imaging modality may have better sensitivity as compared to ECG in detecting ischemia. We aimed (1) to assess the reproducibility, intra‐observer, and interobserver interpretation variability and (2) to assess the MCG maps in the presence of coronary narrowings.
Methods and Results: All measurements were performed in a nonshielded room. For the first part of the study, two MCG maps were recorded in 24 otherwise healthy volunteers (age 20–44 years, median 24, 16 male) in an interval ranging from 2 to 48 hours. The maps were interpreted using the CardioMag software for contour maps, averaged MCG time traces, and waveform morphology of repolarization by two observers blinded to each other. The parameters tested had low disagreement between repeated measurements. The correlations of the intra‐observer and interobserver interpretation were excellent. Secondly, MCG maps were obtained in 29 patients referred for angiography due to suspected coronary artery disease. Nineteen of them had coronary narrowings defined as more than 50%. In this group, 16 (84.2%) had abnormal MCG maps as compared to only 5 (26.3%) who had abnormal ECGs (P < 0.01).
Conclusions: MCG maps can be successfully obtained in a nonshielded room and allow feasible, accurate, and reproducible measurements with little intra‐observer and interobserver variability. Ischemic changes in the heart's magnetic field may occur before electrical changes. Our pilot data suggests that this imaging modality may potentially offer better sensitivity as compared to rest ECG in detecting ischemia in a cohort of patients who had coronary narrowings identified by angiography.
Keywords: electrocardiography, magnetocardiography, cardiac ischemia
Magnetocardiography (MCG) is the measurement of magnetic fields produced by the electrical activity of the heart. 1 The magnetic field is passively recorded and is conducted as a completely noninvasive procedure without any contact to the body. The magnetic field is recorded using superconducting quantum interference devices (SQUIDs). These instruments are the most sensitive magnetic sensors available today and use quantum physical effects currently at the low temperature of 4 or 77 K.
The measurement of these fields over the torso provides information that is complementary to that provided by electrocardiography (ECG). Typical MCG recordings, available as a time series, show similar morphological features as the ECG, such as QRS complex, P, T, and U waves, but there are some fundamental differences. The MCG is more sensitive to tangential currents in the heart than the ECG, and it is also sensitive to vortex currents, which cannot be detected by the ECG. 2 In the normal heart, the main direction of the activation wavefront is radial, from endocardium to epicardium. For these reasons, MCG may show ischemia‐induced deviations from the normal direction of depolarization and repolarization with better accuracy than the ECG. MCG is affected less by conductivity variations in the body (lungs, muscles, and skin) than ECG. 3 In addition, because MCG is a fully noncontact method, 4 the problems in the skin–electrode contact encountered in ECG are avoided. 2
Until recently, one of the more severe constraints that had hindered the implementation of MCG in practical clinical settings has been the need for measurements to be made within a magnetically shielded room. 5 However, recent advances in SQUID system technology, such as improved noise suppression techniques, better field sensitivity, and highly balanced gradiometer systems, allow MCG measurements in a totally unshielded environment.
The aims of the present study were (1) to assess the reliability and reproducibility of MCG measurements in typical hospital settings by collecting data from healthy volunteers and (2) to compare the ability of MCG to detect ischemia, as compared to rest ECG.
METHODS
This study was approved by the institutional review board of the Johns Hopkins University. Informed consent was obtained from all study subjects. Patients were recruited consecutively from those undergoing diagnostic coronary artery catheterization. The indications for catheterization in all patients were the presence of stable or unstable angina pectoris or suspected significant myocardial ischemia.
Equipment Specifications
MCG was performed using the CMI Magnetocardiograph Model 2409 (CardioMag Imaging, NY) (Fig. 1) that is a SQUID‐based device operating without the need of magnetically shielded rooms. An array of nine channels senses the heart magnetic fields, three additional channels are used for referencing, and one channel for reference ECG.
Figure 1.
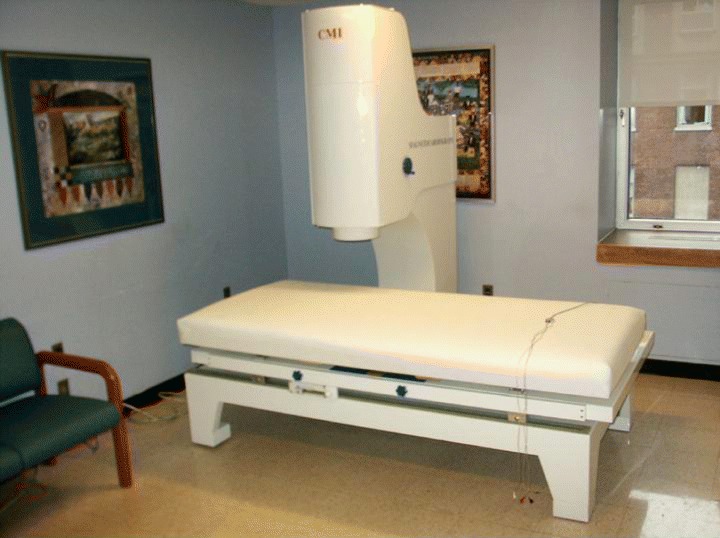
The CMI magnetocardiograph is a SQUID‐based device operating without the need of magnetically shielded rooms. An array of nine channels senses the heart magnetic field, three additional channels are used for referencing, and one channel for reference ECG. MCG data are acquired at 36 locations above the torso by making four sequential measurements. In each position, the nine sensors measure the cardiac magnetic field for 90 seconds using a sampling rate of 1000 Hz leading to 36 individual time series. The operation of the system is computer‐controlled and largely automated. The acquired signals are processed by proprietary medical application software capable of filtering, averaging, electric/magnetic activity localization, heart current reconstruction, and derivation of diagnostic scores. The device is has just recently been approved by the FDA.
The SQUID sensors are second‐order wire‐wound hardware gradiometers with a baseline of 5.5 cm and a noise floor (magnetic field resolution) of less than 20 fT/√Hz without magnetic shielding. While an ideal gradiometer will reject all common‐mode components, extremely tiny, unavoidable fabrication errors result in nonideal gradiometers. These are characterized by their balance factors. A reference triad of three orthogonal magnetometers (the three reference channels) 2 is used to electronically compensate for these errors and improve the balance factor of the gradiometers to attain a common‐mode rejection ratio of 100,000 or better. A novel proprietary method of protection against omnipresent radiofrequency electromagnetic interference (EMI) permits one to use the system in many clinical locations. The operation of the system is computer‐controlled and largely automated. Proprietary software is used for precise 24‐bit control and data acquisition. The acquired signals are processed by proprietary medical application software capable of filtering, averaging, electric/magnetic activity localization, heart current reconstruction, and derivation of diagnostic scores.
Technical Description of Measurement
The subject lies on the examination table, is connected to three ECG electrodes and the recorder head that contains the MCG sensors, is positioned 3–5 cm above the chest, recording the magnetic field using nine different channels. The ECG pattern recorded by the MCG is not used for clinical assessment of the patient. The table can be moved to four different positions, and the MCG is recorded in each of these positions. In each location, the recording is performed for 90 seconds (for improvement of the signal/noise ratio). Therefore, the total actual recording time for each subject is 6 minutes, with an overall study time, including set‐up and analysis, of approximately 9–10 minutes. A convenient way to represent data from all 36 positions simultaneously in one instant of time is the transformation of the averaged time series into a two‐dimensional color map. 6 This is done through the usage of a “common” ECG cycle to average each of the 36 MCG tracings over time. Then, the data are interpolated using first a bivariate surface fitting algorithm to create a grid of nodes 0.5 cm apart (instead of the original 4 cm) to 41 × 41. 7 Second, the 41 × 41 grid is interpolated to form the final grid using bilinear interpolation. 8 The dimensions of the final grid depend on the current map size in pixels, which is 421 × 421 pixels by default. Therefore, isolines are calculated using a cubic spline interpolation between the 36 points (Fig. 2). The interpolated values are used for visualization only. The map produced describes not only local magnetic field variability, but also an overall magnetic field vector, a representation of the heart's overall electrical vector throughout the cardiac cycle (Fig. 3). This is the vector described by the traditional ECG.
Figure 2.
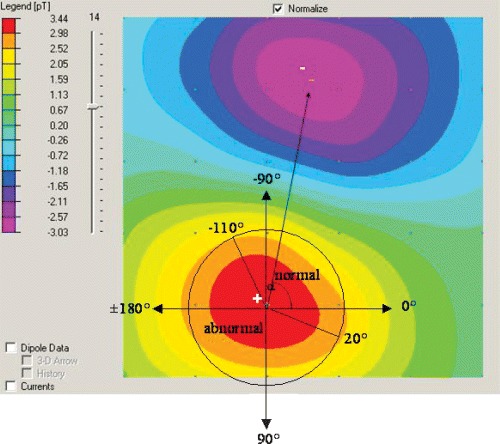
Dipole magnetic field map. The colors represent areas of equal magnetic field strength, as defined in the vertical bar on the left side of the picture. Blue areas indicate negative values and red areas indicate positive values. The point indicating the location of the maximal magnetic field is labeled “+” (“+ pole”), and the point indicating the location of the minimal magnetic field is labeled “−” (“− pole”). The angle α is between the (+) pole and the (−) pole.
Figure 3.
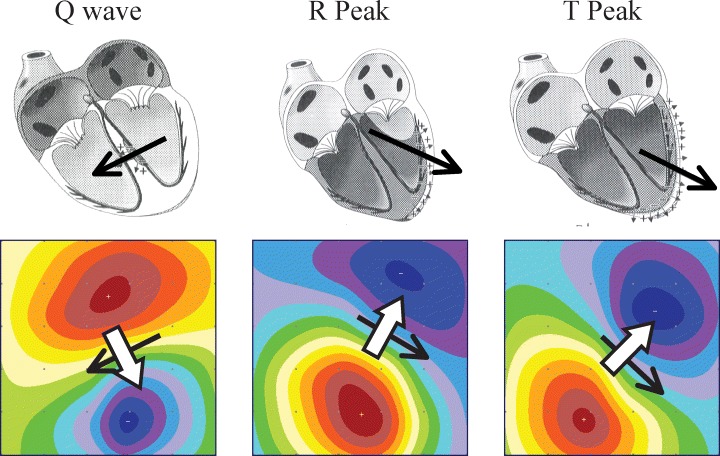
Visual correlation of anatomic electrical heart vectors and magnetocardiogram maps. The overall electrical vector of the heart (black solid arrows) varies with time throughout the cardiac cycle, creating the corresponding magnetic field vector (solid white arrows). As described by electromagnetic field theory, the magnetic field vectors are continuously perpendicular to the electrical vectors from which they are derived.
Reproducibility
Every volunteer had a baseline MCG recording. The second recording was done in a separate session, usually later that day, which included reconnecting to three ECG leads, repositioning, and MCG recording. For reproducibility purposes, the following parameters of the minimum and maximum poles were compared: minimum and maximal angle extrema (α), angle dynamics, distance dynamics, and ratio dynamics. The parameters were examined during the period of repolarization from the early part of the T wave to the T‐wave peak (“ischemia analysis window”). The angle α between the positive (+) pole and the negative (−) pole is determined as shown in Figure 2. The following four criteria are considered as normal boundaries for these parameters of the magnetocardiogram, over the analysis window:
-
1
The angle is −110°≤α≤ 20°.
-
2
The angle α between the positive (+) pole and the negative (−) pole rotates by less than 45° in 30 ms.
-
3
The distance between the positive (+) pole and the positive (−) pole varies by less than 20 mm in 30 ms.
-
4
The ratio between the field strength of the positive (+) pole and the field strength of the negative (−) pole varies by less than 0.3 in 30 ms.
Ischemia Detection
Every patient had the MCG recorded at rest the morning before the coronary angiography. ECG was recorded in the morning of the procedure. Coronary angiograms, MCGs and rest ECGs were all read by two observers who were blinded to the results of the other tests. Ischemia was defined based on angiography, when at least one coronary artery stenosis of 50% was present. Ischemia by ECG was defined as ≥1 mm horizontal/downsloping ST depressions in ≥2 contiguous leads, and/or T‐wave inversions. Ischemia on MCG was defined by an algorithm, which yielded a score on a continuum from 0 to 100; greater than 49 was deemed abnormal. The algorithm is based on a previous cohort of known positives and negatives, from which the computer has “learned” to recognize normal and abnormal patterns based on three characteristics within the analysis window: the number of poles, the positions and movements of the poles, and the overall stability of the map. The algorithm was preprogrammed into the proprietary analysis software, provided by the manufacturer, and has been submitted for patent. Details have also been published by Embrechts et al. 9
Statistical Analysis
For reproducibility, both the Bland Altman test (Fig. 4) and coefficient of variability measures were used. 10 For each subject, the coefficient of variability was calculated between first and second measurements. The data were expressed graphically, and with the average coefficient of variability across all the subjects ± standard error of the mean.
Figure 4.
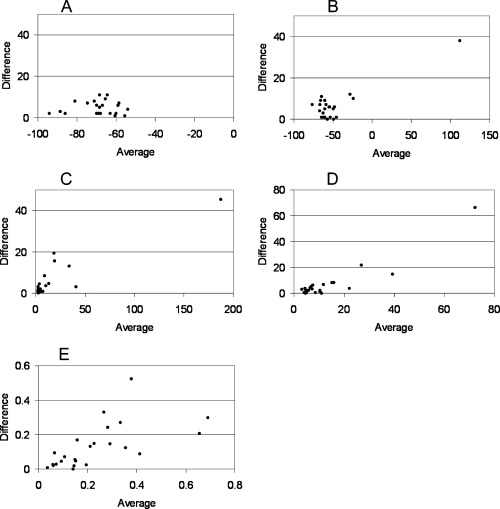
Bland–Altman analyses of reproducibility for (a) min angle, (b) max angle, (c) angle dynamics, (d) distance dynamics, and (e) ratio dynamics, where the average values of two measurements for each subject is plotted on the x‐axis, and the absolute difference between those measurements is plotted on the y‐axis.
For ischemia, the standard statistical descriptors of a test were calculated. Analysis between groups for continuous variables was calculated by t‐test. All P values are based on a two‐tailed comparison. P < 0.05 was considered as significant.
RESULTS
Reproducibility
Twenty‐seven healthy volunteers underwent MCG recording. All had two MCG recordings with an interval of 10 minutes to 72 hours between tests. Three were excluded due to poor data and were not included in the present study. The poor data were the result of body piercing (1), anomalous anatomy (1), and unidentifiable outside interference precluding data analysis (1). These factors yielded data in which it was difficult to discern magnetic field changes of the heart, versus those of artifact. Therefore, the cohort for this part of the study included 24 subjects (16 males, 8 females, age 20–44 years; BMI 19.4–29.8). Cardiovascular risk factors included—four family history of IHD, one current smoker, one former smoker; none had hypertension, diabetes, or dyslipidemia.
The parameters tested had low disagreement between repeated measurements (Fig. 3). While some parameters reproduced better than others, variability was predominantly an order of magnitude less than the value of the parameter. Calculations of the coefficients of variability are shown in Table 1.
Table 1.
Coefficients of Variability Individual Coefficients of Variability Were Calculated for Each Subject for Each Parameter, Then Expressed as an Averaged Value for the Entire Cohort. The Lower the Coefficients of Variability, the Less Variation there Is between Repeated Measurements
| Parameter | Measurement 1 Average Value | Measurement 2 Average Value | Average CV ± SEM (n = 24) |
|---|---|---|---|
| Angle (minimum) | −68.29 | −68.54 | 4.8%± 0.7% |
| Angle (maximum) | −47.75 | −50.63 | 8.0%± 1.7% |
| Angle dynamics | 17.70 | 15.20 | 29.5%± 5.1% |
| Distance dynamics | 12.11 | 14.25 | 30.5%± 4.4% |
| Ratio dynamics | 0.25 | 0.22 | 39.2%± 5.7% |
The correlations of the intra‐observer and inter‐observer interpretations were excellent, mainly as the operation of the system is computer‐controlled and largely automated and it provides parametric values easily obtainable by the observer.
Ischemia Detection
MCG recordings were performed in 36 patients undergoing cardiac catheterization. Seven were excluded due to implantable devices (1), sternal wires (3), dental artifacts (2), or otherwise poor data (1). Thus, the study group is composed of 29 patients (21 males and 8 females, age 45–83 years, mean 63.9 ± 10.2). In 22 patients, the MCG recording was interpreted as positive for ischemia. The patients' characteristics according to MCG finding are presented in Table 2. On visual analysis, significant differences between normal and ischemic subjects were noticed, as demonstrated in Figure 5. The sensitivity and specificity of both the methods used are presented in Table 3.
Table 2.
Patients Characteristics According to MCG Results
| Positive MCG (n = 22) | Negative MCG (n=7) | P Value | |
|---|---|---|---|
| Patient history | |||
| Known coronary disease | 12 | 4 | 0.91 |
| Anginal symptoms | 10 | 5 | 0.25 |
| Old myocardial infarction | 7 | 0 | 0.093 |
| Bypass surgery | 7 | 0 | 0.093 |
| Valve disease | 2 | 0 | 0.43 |
| Valve replacement | 2 | 0 | 0.43 |
| Past PCI with stents | 7 | 3 | 0.61 |
| Family history of IHD | 5 | 4 | 0.092 |
| Diabetes | 5 | 2 | 0.76 |
| Hypertension | 15 | 4 | 0.61 |
| Dyslipidemia | 17 | 4 | 0.32 |
| Current smoker | 3 | 0 | 0.32 |
| Former smoker | 9 | 1 | 0.21 |
| Finding in angiography: | 0.41 | ||
| No disease | 6 | 4 | |
| 1‐Vessel disease | 3 | 1 | |
| 2‐Vessel disease | 5 | 2 | |
| 3‐Vessel disease | 4 | 0 | |
| Left main | 4 | 0 | |
Figure 5.
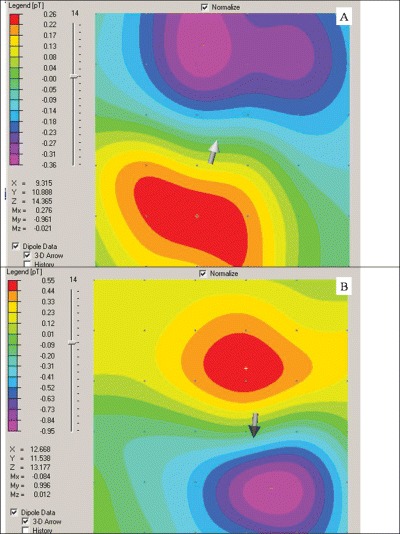
Visual magnetocardiogram maps at the beginning of the T wave of patient (a) without ischemia and normal MCG and (b) with ischemia and abnormal on MCG. Of note here is the opposite orientation of the dipoles representing opposite currents during repolarization. More abnormalities are seen when animating through the entire ST–T segment.
Table 3.
Sensitivity and Specificity of MCG in Detecting Ischemia
| Rest ECG, n = 29 (%) | MCG, n = 29 (%) | |
|---|---|---|
| Sensitivity | 26.3 | 84.2 |
| Specificity | 90.0 | 40.0 |
| PPV | 83.3 | 72.7 |
| NPV | 31.9 | 57.1 |
DISCUSSION
In the present study, we show that (1) MCG maps of normal individuals are reproducible with respect to visual analysis and selected parameters of the minimum and maximum poles; and that (2) MCG was more successful in assessing ischemia than ECG.
MCG is a technique that allows the non‐invasive measurement and visualization of the cardiac magnetic field generated by cardiac electrical activity. MCG has been under investigation as a clinical tool for more than 25 years, but clinical research had been limited by the need for magnetically shielded rooms. The current generation of magnetometers utilizes SQUID technology to enable MCG measurements in an unshielded environment.
Typical MCG recordings, available as a time series, show similar morphological features as the ECG, such as QRS complex, P, T, and U waves, but there are some fundamental differences. The MCG is more sensitive to tangential currents in the heart than the ECG, and it is also sensitive to vortex currents, which cannot be detected by the ECG. 2 In the normal heart, the main direction of the activation wavefront is radial, from endocardium to epicardium. For these reasons, MCG may show ischemia‐induced deviations from the normal direction of depolarization and repolarization with better accuracy than the ECG. MCG is affected less by conductivity variations in the body (lungs, muscles, and skin) than ECG. 3 In addition, because MCG is a fully noncontact method, the problems in the skin–electrode contact encountered in ECG are avoided. 2 Until recently, a shielded room was needed for MCG recordings. 5 However, recent advances in SQUID system technology such as improved noise suppression techniques, better field sensitivity, and highly balanced gradiometer systems let us construct a SQUID device, which allows us to perform MCG measurements in a totally unshielded environment. Research has progressed in the use of SQUID technology in unshielded rooms to yield clinically significant data.
Leder et al. 11 used a similar, yet alternative, device to assess reproducibility of MCG at the bedside. They found that, using only three SQUID sensors, the QRS segment of the MCG was reproducible in their 18 volunteers, but lacked reproducibility through the ST–T segment. The authors looked toward further technical development to enhance the ability of the MCG to reproduce ST–T changes. The present study suggests that technical development of MCG has provided a reproducible measure of ST–T segment changes, yielding a possible alternative tool for detecting ischemia.
This opinion has been supported through the work of Takala et al. 12 who studied, in a shielded environment, exercise‐induced changes in MCG of normal volunteers. They were able to identify ST‐segment and T‐wave changes on MCG of their 12 volunteers during cycling. They followed this with an analysis of ST‐segment and T‐wave changes in patients with known CAD, compared to controls, during bicycle exercise test. 13 Their study of 22 healthy volunteers and 44 patients with CAD demonstrated the potential clinical relevance of the ST–T interval for detection of ischemic changes on MCG. It also supports the present study's use of the T‐wave for assessing the MCG's ability to detect ischemia. However, their study used a magnetocardiograph in an electromagnetically shielded room, recording mainly over the abdomen of the patient, whereas we used a magnetocardiograph that did not require any shielding, and made measurements over the thorax. We propose that this represents a more realistic clinical setting, and opens the door for the possibilities of using MCG for clinical diagnosis. This idea is supported by similar studies by Hailer et al. 14 and Kanzaki et al. 15 who were also able to demonstrate increased sensitivity for ischemia by the MCG compared to the ECG in small groups, using either the ST–T interval or QRS waves to diagnose. Both of these small studies were conducted using a different device, no longer manufactured, in an unshielded setting.
The promising outcomes of these studies indicate the need for more rigorous, large‐scale clinical trials, refining the protocol, and definitions for the detection of myocardial ischemia by MCG, to yield a working model for the more sensitive non‐invasive diagnosis of coronary artery disease by MCG.
Limitations of Study
The present study is limited by (1) the relatively small number of volunteers and patient population, (2) ischemia definition was defined by angiography (angiographically ≥50% coronary stenosis) and (3) there is some interference by materials generating electromagnetic artifacts, thus prohibiting its use in all patients.
Although MCG is not yet recognized as a daily clinical tool for ischemia detection in acute chest pain patients, its application is currently under investigation in various cardiac conditions such as cardiac transplant rejection, localization of arrhythmias, noninvasive follow‐up postintervention, and predicting patients most likely to benefit from an ICD. As more data are collected in these populations, further refinement in the criteria will enable us to better define the normal versus abnormal MCGs.
A more sensitive, noninvasive diagnostic test for coronary artery disease opens the door not only for improved identification of cardiac ischemia but more effective exclusion of nonischemic patients from further testing. This naturally begs the question, in an age of increasing financial pressures on health care, of possible cost savings by reducing unnecessary admissions of patients to rule out ischemia. While the present study was not designed to assess such parameters, one can look to the study by Stowers et al. as a possible guide. 16 They demonstrated the potential reduction in hospital expenditures by ruling out acute myocardial infarction through single photon emission computed tomography, without sacrificing morbidity or mortality from cardiac ischemia. Thus, while exact monetary figures are difficult to estimate at this stage, technology such as the magnetocardiograph, with a low per‐test cost, could prove invaluable in both the diagnosis of acute MIs and the minimization of unnecessary healthcare costs.
In summary, the MCG may potentially prove to be a useful tool in the noninvasive surveillance of cardiac ischemia. Further data need to be collected on the use of this promising noninvasive modality in the patient population with cardiac disease.
Benjamin A. Steinberg and Ariel Roguin contributed equally to this study.
REFERENCES
- 1. Baule GM, McFee R. Detection of the magnetic field of the heart. Am Heart J 1963;55: 95–96. [DOI] [PubMed] [Google Scholar]
- 2. Koch H. SQUID MCG: Status and Perspectives. IEEE Trans Appl Supercond 2001;11: 49–59.DOI: 10.1109/77.919284 [DOI] [Google Scholar]
- 3. Siltanen P, Magneto cardiography In MacFarlane P, (ed.): Comprehensive Electrocardiology, Vol. II. New York , Pergamon Press, 1989, pp. 1405–1438. [Google Scholar]
- 4. Kariniemi V, Ahopelto J, Karp PJ, et al. The fetal magnetocardiogram. J Perinat Med 1974;2: 214–216. [DOI] [PubMed] [Google Scholar]
- 5. Cohen D, Edelsack EA, Zimmerman JE. Magnetocardiograms taken inside a shielded room with a superconducting point‐contact magnetometer. Appl Phys Lett 1970;16: 278–280. [Google Scholar]
- 6. Sternickel K, Tralshawala N, Bakharev A, et al. Unshielded measurements of cardiac electric activity using magnetocardiography. Int J Bioelectromagnetism 2002;2: 189–190. [Google Scholar]
- 7. Akima H. A method of bivariate interpolation and smooth surface fitting based on local procedures. J Assoc Comput Machinery 1970;17: 589–602. [Google Scholar]
- 8. Press WH. Numerical recipes in C The Art of Scientific Computing. 2nd Edition Cambridge , U.K. , Cambridge University Press, 1992. [Google Scholar]
- 9. Embrechts M, Szymanski B, Sternickel K, et al. Use of Machine Learning for Classification of Magnetocardiograms. Proceedings of the 2003 IEEE Conference on Systems, Man, and Cybernetics, SMC 2003, October 5–8, Washington , DC , pp. 1400–1406, 2003.
- 10. Szklo M, Nieto FJ. Quality assurance and control In Szklo Nieto. (eds.): Epidemiology—Beyond the Basics. New York , Aspen Publication, 2000, pp. 343–405. [Google Scholar]
- 11. Leder U, Schrey F, Haueisen J, et al. Reproducibility of HTS‐SQUID magnetocardiography in an unshielded clinical environment. Int J Cardiol 2001;79: 237–243. [DOI] [PubMed] [Google Scholar]
- 12. Takala P, Hänninen H, Montonen J, et al. Magnetocardiographic and electrocardiographic exercise mapping in healthy subjects. Ann Biomed Eng 2001;29: 501–509. [DOI] [PubMed] [Google Scholar]
- 13. Hänninen H, Takala P, Korhonen P, et al. Features of ST segment and T‐wave in exercise‐induced myocardial ischemia evaluated with multichannel magnetocardiography. Ann Med 2002;34: 120–129. [DOI] [PubMed] [Google Scholar]
- 14. Hailer B, Chaikovsky I, Auth‐Eisernitz A, et al. Magnetocardiography in coronary artery disease with a new system in an unshielded setting. Clin Cardiol 2003;26: 465–471. [DOI] [PMC free article] [PubMed] [Google Scholar]
- 15. Kanzaki H, Nakatani S, Kandoria A, et al. A new screening method to diagnose coronary artery disease using multichannel magnetocardiogram and simple exercise. Basic Res Cardiol 2003;98: 124–132. [DOI] [PubMed] [Google Scholar]
- 16. Stowers SA, Eisenstein EL, Wackers FJTH, et al. An economic analysis of an aggressive diagnostic strategy with single photon emission computed tomography myocardial perfusion imaging and early exercise stress testing in emergency department patients who present with chest pain but nondiagnostic electrocardiograms: Results from a randomized trial. Ann Emerg Med 2000;35: 17–25. [DOI] [PubMed] [Google Scholar]