

Abstract
Background: The T‐wave peak to T‐wave end (TpTe) interval reflects spatial and transmural dispersion in repolarization and serves as an arrhythmogenic index. Normal TpTe interval data in children are lacking. We evaluated the effects of age, gender, heart rate, leads (II and V5) on TpTe and T‐wave voltage.
Methods: Four hundred healthy children (age 4 days to 16.7 years) were enrolled. From a resting 12‐lead digital ECG, TpTe, RR, QT, JT intervals, and T amplitude were measured (leads II and V5). Bazett and Fridericia formulas were applied to TpTe for heart rate correction and TpTe/QT and TpTe/JT were calculated. Descriptive and analytical statistics were applied, significance level set at P ≤ 0.05.
Results: TpTe in leads II and V5 correlate well. Contrary to adults, no gender differences in TpTe were observed in childhood. TpTe lengthens with increasing age, and is inversely related to heart rate. TpTe 98th percentile is 85 msec in first 5 years, increasing to 92 msec in adolescence. TpTe Fridericia is a good correction formula in childhood; TpTe Bazett overcorrects in the younger age. TpTe/QT and TpTe/JT are longer in younger subjects due to greater QT shortening than the TpTe interval at higher heart rates.
Conclusions: In children, TpTe in lead II and V5 correlate well. The TpTe interval lengthens with advancing age as heart rate diminishes. TpTe Fridericia is a good correction formula in children. Younger subjects have higher TpTe/QT and TpTe/JT indices compared to older children. T‐wave voltage increases with age, tallest in the 5–10‐year‐age group particularly in V5.
Ann Noninvasive Electrocardiol 2010;15(1):11–16
Keywords: TpTe, TpTe/QT, TpTe/JT, children, T wave, dispersion of repolarization
Spatial dispersion of repolarization (SDR) in the form of transmural, transseptal, and apicobasal dispersion of repolarization creates voltage gradients that inscribe the J wave and T wave of the ECG. Amplification of this SDR underlies the development of life‐threatening ventricular arrhythmias associated with inherited or acquired ion channelopathies giving rise to the long QT, short QT, and Brugada syndromes. 1 , 2 , 3 , 4 , 5 , 6 The value of the interval between the peak and end of the T wave as an index of SDR and transmural dispersion of repolarization has been well established. 1 , 2 , 3 , 4 , 5 , 6 Children with inherited channelopathies, or those on medication that may influence the repolarizing potassium channels, or children postcardiac surgery may have altered SDR. Measurement of TpTe in such children is potentially useful in assessment of ventricular arrhythmia risk. There currently exists no normal reference data for TpTe in children.
With this in mind, we set out to evaluate factors, such as age, heart rate; ECG leads (II and V5) that may affect the behavior of the TpTe interval throughout childhood.
METHODS
We prospectively enrolled 400 normal children with parental informed consent. Criteria for exclusion from the study included a family history of arrhythmia or sudden death, a history of acute life‐threatening event, bundle branch block on ECG, use of medications known to prolong the QT interval or alter the T wave on ECG, metabolic or central nervous system disorder. Bottle‐fed infants were receiving infant formulas with adequate calcium, potassium, and sodium content.
All children had a normal physical examination.
While in a quiet resting state, a digital 12‐lead electrocardiogram was recorded using a MAC VU electrocardiographic system (Marquette Medical Systems, Milwaukee, WI, USA) at a paper speed of 50 mm/s, sampling rate 1000 Hz.
The digital electrocardiograms were stored on a computer server and subsequently retrieved for analysis. The electrocardiographic parameters described here forth were measured using the incorporated digital on screen calipers and were magnified. T‐peak to T‐end intervals were measured in lead II and lead V5 from the peak of the T wave to the end of the T wave at the point of return to the isoelectric line from six cycles and then averaged. In the presence of a bifurcated T wave, T peak was measured from the tallest T wave. When a separate T and U wave were visible, and the U‐wave amplitude was 50% or less of the T‐wave amplitude, the initial down slope was extrapolated to the baseline and used for measurement of the TpTe interval. When a single notched wave was visible, if the terminal portion had amplitude of more than 50% of the peak, the entire wave was included as the T wave. The QT interval was also measured in leads II and V5 (six cycles), the time interval from the beginning of the Q wave to the end of the T wave, as was the JT interval, the time interval from the beginning of the J wave to the end of the T wave.
The RR interval was measured from an average of 10 cardiac cycles (the same cycles in which the TpTe interval was measured). All measurements were performed by a single investigator (AB). Intraobserver variability and reproducibility was measured for the first five patients in each age group. The coinvestigator randomly assigned electrocardiograms for repeat measurements by the investigator who was blinded to identity.
To correct for possible heart rate effects on the TpTe, we applied the Bazett formula (TpTe/√RR) 7 and the Fridericia formula (TpTe/RR1/3). 8 Additionally, for all age groups the ratios TpTe/QT in leads II and V5 was calculated to correct for heart rate discrepancies. To eliminate for discrepancies produced by QRS duration lengthening with increasing age, we measured and calculated the TpTe/JT ratio in leads V5 and II.
The maximum T‐wave amplitude in millivolts was measured from the same six complexes in both leads II and V5 in each of the age groups. We accepted minimum cut‐off T‐wave amplitude of 0.25 mV for inclusion in the study. For analysis, patients were broken down into four age group categories; birth–1 year; 1–5 years; 5–10 years; and above 10 years.
Descriptive statistics were calculated and expressed as mean, standard deviation, median and range. The data were tested for normal distribution. A paired t‐test and analysis of variance with post hoc Bonferroni‐Dunn and Scheffes tests were performed to compare the age group variables. Regression analysis and analysis of variance and post hoc Bonferroni‐Dunn and Scheffes F test at a significance level of 1% were used to compare the two formulas. Correlation coefficients (Pearson) and regression analysis were performed for the TpTe in the different leads and correction formulas for the TpTe relationship with heart rate.
TpTe lead II values were divided into three heart rate groups: <100 beats/min, 100 to 149, and above 149 beats/min. The mean value for each group and its 95% confidence intervals were calculated. From these data, a graph was constructed represented in Figure 1. Similarly, for TpTe V5 Fridericia corrected and TpTe/QT (lead V5), for each of the four different age groups, the mean value and its 95% confidence intervals were calculated and the data graphically represented as a bar chart in Figures 2 and 3, respectively.
Figure 1.
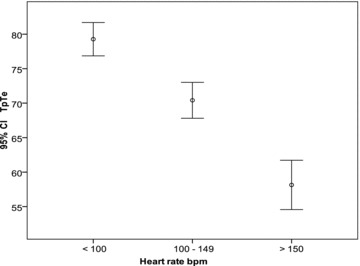
TpTe II mean (circle), and calculated 95% confidence intervals (horizontal bars represent the limits) for the three heart rate groups; <100 beats/min, 100 to 149 and 150 and above. TpTe in milliseconds, bpm = beats per minute.
Figure 2.
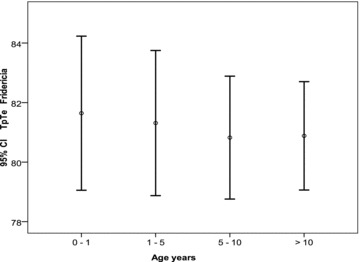
TpTe Fridericia lead V5 mean (circle), and calculated 95% confidence intervals (horizontal bars represent the limits) for the four age groups; 0–1, 1–5, 5–10, >10 years.
Figure 3.
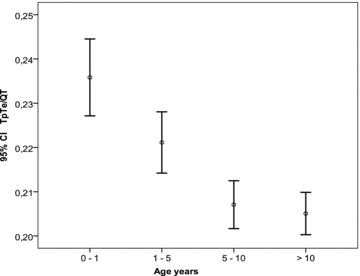
TpTe/QT (lead V5) mean (circle), and calculated 95% confidence intervals (horizontal bars represent the limits) for the four age groups; 0–1, 1–5, 5–10, >10 years.
The level for statistical significance was set at a P value < 0.05.
The study was approved by the medical ethics committee of the Academic Hospital of the Free University of Brussels.
RESULTS
Mean age for the whole cohort was 5.3 years (day 4–16.7 years), median 4.4 years. The age breakdown within categories, gender and number of subjects is shown in Table 1. There was a slight preponderance of female subjects for all the age groups.
Table 1.
Demographic Data
| Gender | ||||
|---|---|---|---|---|
| Age | Mean | Median | (m/f) | Number |
| 0–1 | 0.33 ± 0.29 | 0.27 | 50/57 | 107 |
| 1–5 | 2.95 ± 1.2 | 3.1 | 54/56 | 110 |
| 5–10 | 7.26 ± 1.5 | 7.26 | 46/48 | 94 |
| >10 | 13.3 ± 2.2 | 12.9 | 42/47 | 89 |
Age in years; m = male; f = female.
Lead: For all age groups, the TpTe interval measured in leads II and V5 correlated well with each other (r > 0.89, P < 0.01).
Gender: For all the age groups, no statistically significant gender differences could be found in TpTe values, heart rate corrected TpTe values for both lead II and V5 (Bazett and Fridericia), neither for heart rate values, nor for the T‐wave amplitude. Furthermore, no gender differences were found for TpTe/QT and TpTe/JT.
TpTe: There is an increase in TpTe with advancing age in both leads II and V5. Intervals in each age group were statistically significant from each other (P < 0.01) (Table 2). The TpTe has an intimate relationship to the heart rate showing an inverse relationship (Fig. 1). The 98th percentile for TpTe for the different age groups are as follows; birth—1‐year, 85 ms for both leads II and V5; 1–5 years 84 ms for lead II and 82 ms for lead V5; 5–10 years 90 ms for lead II and 88 ms for lead V5; 10 years and beyond 91 ms for lead II and 92 ms for lead V5.
Table 2.
Measured and Calculated Parameters
| Age (years) | 0–1 | 1–5 | 5–10 | ≥10 |
|---|---|---|---|---|
| Heart Rate | 139 (88–200) | 107 (66–153) | 87 (54–133) | 76 (46–120) |
| TpTe II | 62.4 ± 11 (39–97)* | 67.6± 9.2 (43–89)** | 71± 8.1 (49–91) | 76 ± 8.4(52–97) |
| TpTe II B | 95 ± 15.8 (58–151)* | 90 ± 13.5 (63–122) | 86.5 ±11.8 (62–134) | 85 ±10 (59–111) |
| TpTe II F | 82 ± 13.6 (52–130) | 82 ± 11.6 (50–110) | 81± 10 (60–117) | 82 ± 8.5 (60–103) |
| TpTe II/JT | 0.3 ± 0.05† | 0.29 ± 0.04†† | 0.27 ± 0.04 | 0.27 ± 0.03 |
| (0.16–0.5) | (0.15–0.4) | (0.17–0.4) | (0.2–0.36) | |
| TpTe II/QT | 0.23 ± 0.04† | 0.22 ± 0.03†† | 0.21 ± 0.02 | 0.021 ± 0.02 |
| T II amp mV | 0.36 ± 0.14 | 0.45 ± 0.13 | 0.49 ± 0.14 | 0.47 ± 0.16 |
| TpTe V5 | 63 ± 10.9 (41–95)* | 67 ± 8.75 (43–87)** | 71 ± 8.1 (51–90) | 75 ± 8.5 (52–97) |
| TpTe V5 B | 96 ± 15.7 (62–138)* | 89 ± 13 (59–121) | 86 ± 11.7 (61–133) | 84 ± 10 (59–107) |
| TpTe V5 F | 82.5 ± 13.5(55–120) | 81 ± 11(53–106) | 81 ± 10 (58–116) | 81 ± 8.6 (60–102) |
| TpTe V5/JT | 0.3 ± 0.05† | 0.28 ± 0.04†† | 0.27 ± 0.04 | 0.27 ± 0.03 |
| (0.17–0.43) | (0.18–0.38) | (0.18–0.4) | (0.19–0.35) | |
| TpTe V5/QT | 0.24 ± 0.04† | 0.22 ± 0.03†† | 0.21 ± 0.02 | 0.21 ± 0.02 |
| T V5 amp mV | 0.35 ± 0.13 | 0.45 ± 0.16 | 0.55 ± 0.2‡ | 0.47 ± 0.2 |
Heart rate in beats per minute; age in years; B = Bazett formula; F = Fridericia formula; values in brackets = range; ±= standard deviation; brackets represent range; amp = amplitude; mV = millivolts; *significantly different (P < 0.01) compared to same variable in other age groups, **P < 0.01 compared to same variable in groups beyond 5 years of age, †significantly different (P < 0.01) compared to same variable in other age groups, ††P < 0.01 compared to same variable in groups beyond 5 years of age, ‡significantly different (P < 0.01) compared to same variable in other age groups.
Heart Rate: Heart rate is highest at birth and diminishes with age, while TpTe intervals are shorter at birth and increase with age in a nonlinear fashion (Table 2, Fig. 1). Heart rate correlated better than age with TpTe (II and V5) (r =−0.58, and −0.55 and r = 0.47, and 0.45, respectively P < 0.01). There is an inverse relationship between TpTe (both in leads II and V5) and heart rate.
TpTe heart rate corrected: From the two correction formulas that were applied to TpTe (Bazett and Fridericia), the Fridericia formula showed the best fit, the mean remaining close to constant for all age groups (Fig. 2). This holds true for both leads V5 and II. For children under 1 year, 98th percentile for TpTe corrected was 108 ms for both leads II and V5. For children between 1 and 5 years, the 98th percentile was 105 and 103 ms lead II and V5, respectively. Between 5 and 10 years 98th percentile was 103 ms for both leads II and V5. Beyond 10 years the 98th percentile was 102 ms for lead II and 100 ms for lead V5.
TpTe Ratio: Mean TpTe/QT II and TpTe/QT V5 were significantly higher in the younger age groups (0–1 and 1–5 years groups) (P < 0.01) compared to those children older than 5 years (Table 2) (Fig. 3) as was mean TpTe/JT II and TpTe/JT V5 (P < 0.01) (Table 2). The TpTe/QT II 98th percentile for the different age groups: 0.3 (0–1 years); 0.28 (1–5 years); 0.25 (5–10 years); 0.25 (>10 years) and for TpTe/JT II 0.39 (0–1 years); 0.37 (1–5 years); 0.34 (5–10 years); 0.34 (>10 years).
T amplitude: The T amplitude increases with advancing age reaching a maximum in the 5–10‐year‐old group for both lead II and V5 and significantly higher as compared to the other groups, being taller in lead V5 (Table 2). Mean peak T amplitude in lead II 0.42 + 0.17 mV versus mean 0.45 + 0.22 mV in lead V5 (P = 0.027).
Intraobserver measurement variability: The maximum difference in measurements did not exceed 8 ms for TpTe, 15 ms and 12 ms for QT and JT intervals, respectively and 15 ms for RR intervals.
Discussion
TpTe is the resultant of the global distribution of the repolarization process and is a surrogate diagnostic parameter. T‐wave morphology descriptors are sensitive to drug‐induced changes and may be a useful addition to the QT interval in cardiac safety trials. The precordial leads are unipolar leads placed on the chest, which are referenced to Wilson central terminal. The direction of these leads is radially outward from the “center” of the heart, the center of the Einthoven triangle. Unlike the precordial leads, the bipolar limb leads, including leads I, II, and III, do not look across the ventricular wall. While TpTe intervals measured in these limb leads may provide an index of TDR, they are more likely to reflect global dispersion, including apicobasal and interventricular dispersion of repolarization. 1 , 2 , 6 A recent study showed that global TpTe can be a strong indicator of transmural dispersion in depolarization. 2
From our study, TpTe interval measured in lead V5 correlates well with lead II and holds true throughout childhood.
Studies in adults have shown a sex difference in TpTe. For the same RR interval men have consistently longer TpTe intervals than women, which are very marked at higher heart rates and become less distinct as heart rate slows down. 9 , 10 In both sexes, TpTe interval showed marked rate dependence with prolongation at long RR intervals. TpTe intervals in men were significantly longer over the entire range of investigated RR intervals. However, whereas the difference between sexes was marked at short‐cycle length it decreased at long‐cycle lengths.
We found no gender differences in TpTe intervals in children. 11 The number of children in our study in full puberty was too small to reach statistical significance. The one potential limitation of our study was that we measured this interval in one ECG per subject at rest and not a number of different RR and TpTe intervals in the same subject.
We found the TpTe not to be constant throughout childhood, displaying heart rate dependence. Younger children with a higher basal heart rate have a shorter TpTe.
Of the two heart rate correction formulas applied to TpTe, Fridericia was found to be the better. This is an easy to use formula that can be applied in clinical practice.
In the clinical setting, it has been demonstrated that patients with catecholaminergic polymorphic ventricular tachycardia and RyR2 mutation show increased TpTe at high heart rates, which is suppressed by beta‐blocker treatment. 12 In contrast, TpTe cannot be used to distinguish symptomatic from asymptomatic patients with congenital long QT syndrome; HERG patients have longer TpTe than KvLQT1 patients; and there is no need to heart rate‐correct TpTe intervals in patients with LQTS. 13 TpTe has also been found to be prolonged in the Brugada syndrome and may serve as an indirect marker. 14
Interestingly, the TpTe/QT ratio has been shown to be an electrocardiographic index of arrhythmogenesis for both congenital and acquired ion channel disease leading to ventricular arrhythmias. In adult healthy individuals, the TpTe/QT ratio has a mean value of approximately 0.21 in the precordial leads and it remains relatively constant between the heart rates from 60 to 100 beats/min. The TpTe/QT ratio is significantly greater in the patients at risk for arrhythmic event such as those with long QT syndrome, Brugada syndrome, short QT syndrome, and also in patients with organic heart disease such as acute myocardial infarction. Functional reentry is the underlying mechanism for arrhythmogenesis associated with an increased TpTe/QT ratio. 15
Similar to these authors, we have found children above the age of 5 years to have a mean value of TpTe/QT of 0.21 for both leads V5 and II. 15 However, the younger healthy subjects have a higher ratio due to a more pronounced QT than TpTe shortening at higher heart rates. To correct for the lengthening of the QRS duration with increasing age, we measured and calculated the TpTe/JT ratio in leads V5 and II. Interestingly, this ratio is also higher in the healthy younger children under 5 years of age, pointing to a more pronounced JT than TpTe shortening at higher heart rates.
To be borne in mind is that although the mean TpTe Fridericia is identical between age groups, the variation is much larger among the youngest subjects. An ECG paper speed of 50 mm/s and interpreter‐related measurement variability may be in part responsible for this observation.
In conclusion, in children, TpTe in lead V5 correlates well with TpTe in lead II. The TpTe interval lengthens with advancing age as the heart rate diminishes. TpTe Fridericia is a good correction formula in children. Younger subjects with higher resting heart rates have higher TpTe/QT and TpTe/JT indices compared to older children and adolescents.
REFERENCES
- 1. Antzelevitch C. Drug‐induced spatial dispersion of repolarization. Cardiol J 2008;15:100–121. [PMC free article] [PubMed] [Google Scholar]
- 2. Xue J, Gao W, Chen Y, et al Study of repolarization heterogeneity and electrocardiographic morphology with a modeling approach. J Electrocardiol 2008;41:581–587. [DOI] [PubMed] [Google Scholar]
- 3. Yan GX, Antzelevitch C. Cellular basis for the normal T wave and the electrocardiographic manifestations of the long‐QT syndrome. Circulation 1998;98:1928–1936. [DOI] [PubMed] [Google Scholar]
- 4. Yan GX, Shimizu W, Antzelevitch C. The characteristics and distribution of M cells in arterially‐perfused canine left ventricular wedge preparations. Circulation 1998;98:1921–1927. [DOI] [PubMed] [Google Scholar]
- 5. Hlaing T, DiMino T, Kowey PR, et al ECG repolarization waves: Their genesis and clinical implications. Ann Noninvasive Electrocardiol 2005;10:211–223. [DOI] [PMC free article] [PubMed] [Google Scholar]
- 6. Opthof T, Coronel R, Wilms‐Schopman FJ, et al Dispersion of repolarization in canine ventricle and the electrocardiographic T wave: T(p‐e) interval does not reflect transmural dispersion. Heart Rhythm 2007;4:341–348. [DOI] [PubMed] [Google Scholar]
- 7. Bazett HC. An analysis of the time‐relations of electrocardiograms. Heart 1920;7:353–370. [Google Scholar]
- 8. Fridericia L. Die systolendauer im Elektrokardiogramm bei normalen menschen und bei herzkranken. Acta Med Scand 1920;53:469–486. [Google Scholar]
- 9. Smetana P, Batchvarov V, Hnatkova K, et al Sex differences in the rate dependence of the T wave descending limb. Cardiovasc Res 2003;58:549–554. [DOI] [PubMed] [Google Scholar]
- 10. Smetana P, Malik M. Gender differences in ventricular repolarization: Terminal T wave interval was shorter in women than men. Pacing Clin Electrophysiol 2003;26:2350. [DOI] [PubMed] [Google Scholar]
- 11. Nakagawa M, Takahashi N, Watanabe M, et al Gender differences in ventricular repolarization: Terminal T wave interval was shorter in women than in men. PACE 2003;26:59–64. [DOI] [PubMed] [Google Scholar]
- 12. Viitasalo M, Oikarinen L, Väänänen H, et al U‐waves and T‐wave peak to T‐wave end intervals in patients with catecholaminergic polymorphic ventricular tachycardia, effects of beta‐blockers. Heart Rhythm 2008;5:1382–1388. [DOI] [PubMed] [Google Scholar]
- 13. Kanters JK, Haarmark C, Vedel‐Larsen E, et al T(peak)T(end) interval in long QT syndrome. J Electrocardiol 2008;41:603–608. [DOI] [PubMed] [Google Scholar]
- 14. Wang J, Shan Q, Yang B, et al Tpeak‐Tend interval as a new risk factor for arrhythmic event in patient with Brugada syndrome. J Nanjing Med Univ 2007;21:213–217. [Google Scholar]
- 15. Gupta P, Patel C, Patel H, et al T(p‐e)/QT ratio as an index of arrhythmogenesis. J Electrocardiol 2008;41:567–574. [DOI] [PubMed] [Google Scholar]