

Abstract
Background: Rapid identification of a proximal occlusion site of a major coronary artery is of paramount importance in the care of myocardial infarction (MI). It is increasingly recognized that routine electrocardiogram (ECG) can be used for that purpose, provided that expert interpretation is available. Computer‐based signal analysis has potential to enhance early ECG interpretation but its performance must be validated against manual algorithms. We therefore set out to develop a computer‐assisted model to detect proximal occlusion of the left anterior descending coronary artery (LAD) in patients with suspected acute coronary syndrome (ACS).
Methods: Based on manual anatomical interpretation of the ECG, obtained from 216 consecutive patients who were admitted due to suspected ACS, an automatic computerized ECG model to detect LAD occlusion was constructed. Agreement between manual evaluation of the ECG by two cardiologists and a computerized ECG algorithm to detect occlusion of the LAD and the site of occlusion was determined.
Results: Using an expert electrocardiographer's anatomical interpretation as the gold standard, the computer model recognized patients fulfilling ECG criteria for any occlusion of the LAD with a specificity of 99% and a sensitivity of 67% (κ= 0.71). However, proximal LAD occlusion was detected with 100% specificity and 86% sensitivity (κ= 0.72). The computer program detected a distal occlusion in the LAD with a specificity of 99% and a sensitivity of 40% (κ= 0.72).
Conclusions: Computerized anatomical interpretation of the ECG is feasible and allows detection of a proximal LAD occlusion with excellent accuracy.
Keywords: electrocardiogram, computerized interpretation, acute coronary syndrome, myocardial infarction
The electrocardiogram (ECG) is still the most readily available and fastest method for the diagnosis of acute myocardial infarction (MI). In acute anterior ST‐elevation MI, the left anterior descending (LAD) coronary artery is almost exclusively the infarct related artery (IRA). Proximal LAD occlusion (prior to the first diagonal branch) has a remarkably poor prognosis due to extensive area at risk. 1 As patients with proximal occlusions may benefit most from early reperfusion therapy several manual ECG algorithms have been proposed to differentiate proximal versus distal LAD artery occlusion in acute anterior MI. 2 Because ECG interpretation is often made by paramedics in out‐of‐hospital settings, computer‐based anatomical interpretation programs could help to identify such patients without delay. Moreover, clinical trials of thrombolytic therapy have shown that reduction in mortality is greatest when the reperfusion of the IRA is achieved very early after the onset of ischemia. 3
We are not aware of any previous publications concerning computer‐based anatomical ECG interpretation in MI. This approach should add to the early characterization and treatment of an anterior MI. We therefore set out to develop and validate a computer model for anatomical interpretation of anterior MI using manual ECG analysis as the golden standard in patients with anterior ST‐elevation MI.
METHODS
Subjects
The original study population consisted of 531 consecutive patients hospitalized for suspected acute coronary syndrome in the Turku University Hospital between May 2000 and July 2001 and who participated in a myocardial injury marker study. 4 The study protocol had been approved by the Ethics Committee of Turku University Hospital and written informed consent was obtained from all patients.
For the purposes of this study, patients with a digitally recorded ECG at admission (n = 369) were selected. Exclusion criteria were left bundle branch block (n = 25), left ventricular hypertrophy (n = 26), pathological Q wave (n = 47), wide QRS duration (n = 42), pacemaker ECG (n = 9), and poor technical ECG quality (n = 4). All exclusions were made by manual interpretation. A total of 216/369 (59 %) patients were included in the final study group. The ECG's were recorded by a Marquette 12SL machine (Marquette Electronics Inc., Milwaukee, WI) routinely used in the hospital.
ECG Analysis
Paper copies of the 216 ECG's recorded at admission were independently interpreted off‐line and in a random order by two cardiologists without knowledge of the patients' clinical details or the results of the computerized interpretation. Single values of the J‐point and the ST‐segment changes were measured separately from all 12 leads with the aid of a hand held magnifying lens. ST‐segment deviation from the isoelectric line, determined by drawing a line between subsequent PQ segments, was measured at 80 ms after the J point. All manual measurements were rounded off to the nearest 0.05 mV.
Pathological Q waves were defined as follows: (1) in leads V1–3 any Q wave ≥30 ms in duration, (2) in leads I, II, aVL, aVF, V4–6 a Q wave ≥0.1 mV in height and ≥30 msec in duration in ≥2 adjacent leads and 3) in leads V1–2 R‐wave duration >40 ms and R/S ratio >1 in the absence of pre‐excitation, right ventricular hypertrophy or right bundle branch block. ST‐elevation MI was diagnosed in the presence of clinically appropriate symptoms in patients with ST‐segment elevation ≥0.2 mV in V1 through V3 and ≥0.1 mV in other leads and an increased value of cardiac troponin I. 5
Manual anatomical interpretation of the ECG was made in the cases with anterior ST‐elevation MI's. The anatomical classification of the LAD artery occlusion was made by the following criterions: (1) the LAD artery was interpreted as the IRA if maximal ST‐segment elevation (≥0.2 mV) was present in leads V2–V3; 6 (2) the site of occlusion in respect to the side branches was determined according to previously published revised criteria. 7 , 8 Birnbaum et al. found that ST depression in the inferior leads predicts a culprit lesion proximal to the origin of the first diagonal branch. 7 According to Arbane et al., mean ST segments were elevated in aVL when the culprit lesion was the proximal LAD. 8 In this study, a proximal lesion in the LAD artery was defined as ST‐segment elevation ≥0.05 mV in lead aVL and ST‐depression ≥0.05 mV in LIII (Fig. 1). All other ECG morphologies were classified as distal occlusion.
Figure 1.
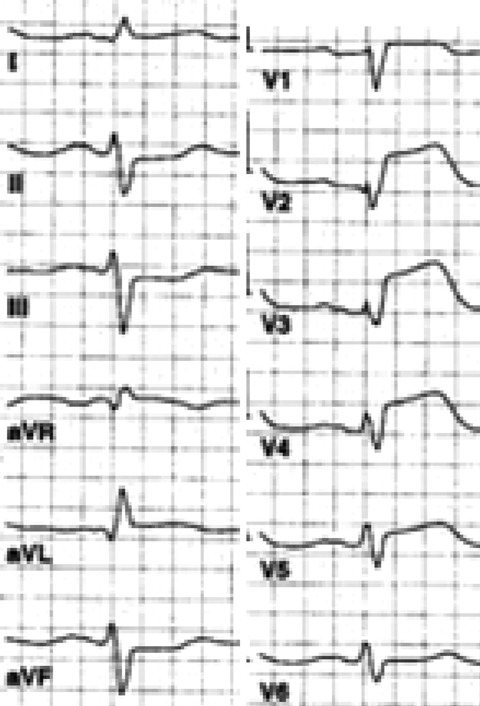
Maximal ST‐segment elevation in leads V2‐V3 indicates that the left anterior descending coronary artery is the infarct related artery. The presence of ST‐segment elevation ≥0.05 mV in lead aVL and ST‐segment depression in lead LIII as a reciprocal change is a sign of an occlusion proximal to the first diagonal side branch.
As part of the coding package, the Marquette 12SL offers a data matrix including, for example Q‐wave amplitude and duration, displacement of the ST‐segment (J‐point, mid and end of ST) and of the T‐wave for all leads. 9 The ST‐segment displacements were collected from the data matrix and used for off‐line analysis in a personal computer (PC) as previously described. 10 An automatic PC interpretation program for the detection and anatomical classification of LAD occlusion was constructed using the above mentioned criteria and applied to the data of the 261 patients with suspected ACS. In addition to uncorrected cutoff points (as expressed in the data matrix), we used corrected cutoffs for the computer program to detect equivalents of manual ST‐elevations of ≥ 0.2 mV and ≥0.1 mV and ST‐depressions of ≥0.05 mV as reported previously. 11
For the purposes of this study, we also determined that the optimal computerized cutoff value to detect the equivalent of manual ST‐segment elevation ≥0.05 mV. In brief, we began the analysis by constructing scatter plots of all measured ST‐segment deviations. We then performed cross‐tabulations in an attempt to increase the sensitivity for detection of actual ST‐elevation without decreasing specificity from 98%. 11 The optimal computerized cutoff was found to be 0.035 mV with a sensitivity of 79 % and a specificity of 98%.
Statistical Analysis
Agreement between categorical assessments was described by Kappa (κ) statistics. Kappa describes the strength of agreement as a proportion of the possible scope for doing better than chance. Kappa has a maximum of 1.00 for perfect agreement, 0 indicates no agreement better than could be expected by chance. 12
We tested the uncorrected and corrected cut‐off points for the computer program to detect the occlusion in the LAD artery using interpretations and measurements made by cardiologists as a gold standard. Sensitivity and specificity values were calculated.
All calculations were performed with the SPSS 12.0 statistical package. (SPSS, Chicago, IL)
RESULTS
The manual anatomical interpretation of the ECG indicated that the LAD was the IRA in 12 of the 216 patients (6%) with suspected acute coronary syndrome (ACS). The site of the occlusion was proximal in 7 (58%) of these patients (SPSS, Chicago, IL).
The sensitivities, specificities and the κ values of the computer program to detect various LAD occlusions are shown in Table 1. Both the uncorrected and corrected computer programs were able to determine the occlusion in the LAD with a high specificity (99%) when using manual interpretation as a gold standard. However, the use of ST‐segment corrections improved the sensitivity to detect the occlusion in the LAD (a sensitivity of 58% with uncorrected and 67% with corrected computer program). The agreement between the manual analysis and the uncorrected or corrected computer program in the determination of the LAD as an IRA was good (κ= 0.65 and κ= 0.71, respectively).
Table 1.
Sensitivity, Specificity and κ values of Uncorrected and Corrected Computer Program to Detect Site of Occlusion of the Left Anterior Descending (LAD) Coronary Artery in Patients with Acute Coronary Syndrome When Using Manual Interpretation as a Gold Standard, n = 216
| Site of Occlusion | Uncorrected Computer Program | Corrected Computer Program | ||||
|---|---|---|---|---|---|---|
| Sensitivity | Specificity | Value of κ | Sensitivity | Specificity | Value of κ | |
| LAD | 58 | 99 | 0.65 | 67 | 99 | 0.71 |
| LAD proximal | 86 | 100 | 0.65 | 86 | 100 | 0.72 |
| LAD distal | 20 | 99 | 0.65 | 40 | 99 | 0.72 |
The use of ST‐segment corrections also improved the ability to determine the level of the LAD occlusion. The sensitivity and specificity of the uncorrected and corrected computer program to detect proximal occlusion in the LAD were similar (86% vs 100%, respectively). However, the correlation between the manual and the uncorrected versus corrected computer program to define the site of a proximal occlusion in the LAD artery was better with the corrected than uncorrected ST‐segment cutoff points (κ= 0.72 vs κ= 0.65, respectively). The corrected computer program was more sensitive to detect distal occlusions in the LAD artery than the uncorrected program (sensitivity 40% vs 20%, respectively), while there was no difference in specificity (99% in both analysis).
An expert electrocardiographer and the corrected computer program interpreted the ECG finding of distal occlusion in the LAD with good agreement (κ= 0.72).
DISCUSSION
This study represents the first attempt to compare computer based with manual ECG interpretation to perform an anatomical ECG interpretation. We hypothesized that it would be possible to construct a computer program for recognizing patients with occlusion of the LAD artery with a good correlation with manual interpretation of ECG. The study population consisted of the whole spectrum of ACS patients. We used cutoff points for significant ST‐segment deviations (≥0.2, ≥0.1, ≥+0.05 and ≥−0.05 mV). Those ST‐deviations are the most critical in the algorithm for anatomical interpretation. We compared computerized interpretations between uncorrected (expressed in the data matrix) and corrected measurements (cutoff points). The specificity of uncorrected and corrected computer programs to detect the LAD as an IRA and the site of LAD occlusion based on ECG criteria was good compared to manual measurements. The use of ST‐segment correction improved the sensitivity to predict the LAD as the IRA and to localize the culprit lesion to the distal part of the LAD artery. Hence, the use of corrected ST‐segment cutoff values improved the results of automated ECG interpretation. Taken together, the computer program was able to detect an LAD‐related ST‐elevation MI with a sensitivity of 67% and a specificity of 99% when using interpretation of two cardiologists as a gold standard. Computer‐assisted interpretation to predict a proximal LAD artery occlusion resulted in high sensitivity and specificity (86% vs 100%, respectively). In reality, the capability of the computer assisted anatomic ECG interpretation to find proximal LAD lesions is poorer. In our study, the ECG criteria for proximal LAD lesion were not tested against coronary angiography. In such studies, ≥0.05 mV ST‐elevation in lead aVL had 73% sensitivity and 78% specificity to predict a proximal LAD lesion. 13
It is clinically important to recognize patients with an acute occlusion of the proximal LAD, which can result in an extensive anterior wall MI. Such assessment should be simple, quick, and non‐invasive. 14 We think that computer‐based anatomical interpretation of the ECG has potentials to become an efficient tool for clinical decision making. The computers alone cannot give the final diagnosis, but computer‐assisted interpretation is very helpful especially for paramedics and inexperienced emergency physicians by whom digitally recorded ECG is actually increasingly utilized. Maximal advantage of this development is possible by using clinically relevant automated ECG analysis programs. However, computer models should be validated using manual ECG interpretation as a gold standard.
The best diagnostic approach is one that combines the interpretation by a person and a machine. 15 There are some prerequisites for anatomic ECG interpretation. Absence of major confounding factors like left ventricular hypertrophy, left bundle branch block, and pacemaker ECG is of crucial importance. We excluded 153 patients after manual interpretation. This emphasizes the role of the manual interpretation, because computerized anatomic analysis is not possible in all cases.
There are several limitations to this study. The number of patients fulfilling criteria for LAD‐related coronary occlusion was small. Hence, this represents a preliminary feasibility study. We used ECG as the golden standard to predict the culprit artery. Including coronary angiography findings in the statistical analyses could have given additional information. Also, cases with ECG confounders, like left bundle branch block, were excluded by manual interpretation. The power of the computer program to identify these ECGs was not tested.
We conclude that a computer program can recognize an occlusion of the proximal LAD artery with a good sensitivity and specificity in patients with ACS. We believe that our findings open new opportunities for computerized analysis of the ECG. However, larger studies should be undertaken especially without manual ECG pre‐screening to establish the value of this automated ECG program to identify proximal LAD lesions.
Acknowledgments
Acknowledgments: We thank MSc Åse Bredbacka and MSc Jarmo Jalonen for technical assistance with the computer programs. Taina Lahti, RN, is acknowledged for expert care of the study subjects.
This study was supported financially by The Pirkanmaa Regional Fund of the Finnish Cultural Foundation, Tampere, Finland; The Instrumentarium Science Foundation, Helsinki, Finland; The Aarne Koskelo Foundation, Espoo, Finland, and The Medical Research Funds of Turku University Hospital, Turku, Finland.
REFERENCES
- 1. Karha J, Murphy SA, Kirtane AJ, et al Evaluation of the association of proximal coronary culprit artery lesion location with clinical outcomes in acute myocardial infarction. Am J Cardiol 2003;92:913–918. [DOI] [PubMed] [Google Scholar]
- 2. Zimetbaum PJ, Josephson ME. Use of the electrocardiogram in acute myocardial infarction. N Engl J Med 2003;348:933–940. [DOI] [PubMed] [Google Scholar]
- 3. Tiefenbrunn AJ, Sobel BE. Timing of coronary recanalization. Paradigms, paradoxes, and pertinence. 1992;85:2311–2315. [DOI] [PubMed] [Google Scholar]
- 4. Ilva T, Eriksson S, Lund J, et al Improved early risk stratification and diagnosis of myocardial infarction, using a novel troponin I assay concept. Eur J Clin Invest 2005;35:112–116. [DOI] [PubMed] [Google Scholar]
- 5. Van de Werf F, Ardissino D, Betriu A, et al Management of acute myocardial infarction in patients presenting with ST‐segment elevation. The task force on the Management of Acute Myocardial Infarction of the European Society of Cardiology. Eur Heart J 2003;24:28–66. [DOI] [PubMed] [Google Scholar]
- 6. Sclarovsky S. Acute ischaemic syndrome‐the pre‐infarction ischaemic syndrome In: Sclarovsky S. (ed.): Electrocardiography of acute myocardial ischemic syndromes. First Edition. London , UK : Martin Dunitz; 1999:31–63. [Google Scholar]
- 7. Birnbaum Y, Solodky A, Herz I, et al Implications of inferior ST‐segment depression in anterior acute myocardial infarction: Electrocardiographic and angiographic correlation. Am Heart J 1994;127:1467–1473. [DOI] [PubMed] [Google Scholar]
- 8. Arbane M, Goy JJ. Prediction of the site of total occlusion in the left anterior descending coronary artery using admission electrocardiogram in anterior wall acute myocardial infarction. Am J Cardiol 2000;85:487–491, A10. [DOI] [PubMed] [Google Scholar]
- 9. Elko PP, Rowlandson I. A statistical analysis of the ECG measurements used in computerized interpretation of acute anterior myocardial infarction with applications to interpretive criteria development. J Electrocardiol 1992;25(Suppl):113–119. [DOI] [PubMed] [Google Scholar]
- 10. Porela P, Luotolahti M, Helenius H, et al Automated electrocardiographic scores to estimate myocardial injury size during the course of acute myocardial infarction. Am J Cardiol 1999;83:949–952, A9. [DOI] [PubMed] [Google Scholar]
- 11. Eskola MJ, Nikus KC, Voipio‐Pulkki LM, et al Comparative accuracy of manual versus computerized electrocardiographic measurement of J‐, ST‐ and T‐wave deviations in patients with acute coronary syndrome. Am J Cardiol 2005;96:1584–1588. [DOI] [PubMed] [Google Scholar]
- 12. Altman DG. Practical Statistics for Medical Research. London , UK : Chapman & Hall, 1991. [Google Scholar]
- 13. Koju R, Islam N, Rahman A, et al Electrocardiographic prediction of left anterior descending coronary artery occlusion site in acute anterior myocardial infarction. Nepal Med Coll J 2003;5:64–68. [PubMed] [Google Scholar]
- 14. Kosuge M, Kimura K, Ishikawa T, et al Electrocardiographic criteria for predicting total occlusion of the proximal left anterior descending coronary artery in anterior wall acute myocardial infarction. Clin Cardiol 2001;24:33–38. [DOI] [PMC free article] [PubMed] [Google Scholar]
- 15. Brailer DJ, Kroch E, Pauly MV. The impact of computer‐assisted test interpretation on physician decision making: the case of electrocardiograms. Med Decis Making 1997;17:80–86. [DOI] [PubMed] [Google Scholar]