Abstract
Background: Coronary artery disease (CAD) has a significant disease burden making early diagnosis and management imperative. Magnetocardiography (MCG) is a relatively new noninvasive technique that allows diagnosis of CAD by recording the magnetic fields generated by the electrical activity of the heart.
Methods: We searched MEDLINE and the Cochrane Central Register of Controlled Trials for prospective studies that evaluated the test characteristics (e.g., sensitivity, specificity, likelihood ratios) of MCG for detection of CAD. Studies were included if they evaluated either patients with stable CAD documented by angiogram or patients presenting initially with acute coronary syndrome and subsequently diagnosed with CAD. The quality of included studies was assessed using an adaptation of the Quality Assessment of Diagnostic Accuracy Studies (QUADAS) tool. We performed meta‐analyses of sensitivity, specificity and positive and negative likelihood ratios using Meta‐DiSc software.
Results: Screening of titles and abstracts followed by full‐text review yielded seven studies that met our inclusion criteria. Meta‐analyses yielded a pooled sensitivity of 83% (95% confidence interval [CI] 80% to 86%) and a specificity of 77% (95% CI 73% to 81%). The pooled positive likelihood ratio was 3.92 (95% CI 2.30 to 6.66) and negative likelihood ratio was 0.20 (95% CI 0.12 to 0.35). Significant heterogeneity was present in all meta‐analyses.
Conclusions: The pooled test characteristics for MCG are similar to those of existing noninvasive modalities for diagnosing CAD. Our results suggest that MCG is a potential complementary or alternative tool for noninvasive detection of CAD.
Keywords: magnetocardiography, coronary artery disease, predictive value of tests, meta‐analysis, systematic review
More than 16 million American adults have coronary artery disease (CAD) and the overall prevalence of myocardial infarction is about 3% in this population. It is estimated that an additional 195,000 cases of silent myocardial infarction occur every year. 1 Because of this significant disease burden, early detection and management of CAD is imperative. Twelve lead electrocardiogram (EKG), echocardiography and stress testing are currently the most commonly used noninvasive modalities for providing a diagnosis of and prognosis for CAD. Magnetocardiography (MCG) is a relatively new noninvasive technique that allows recording of the magnetic fields generated by the electrical activity of the heart. 2 , 3 , 4 , 5 , 6 A magnetocardiogram consists of an enhanced detector of the magnetic field called a SQUID (superconducting quantum interference device) and measures the magnetic field simultaneously at multiple points, generating maps, which are analyzed similar to a surface EKG. 7 , 8 However, MCG is more sensitive than surface EKG to the tangential currents which arise in subepicardial and deeper myocardial layers due to the gradients in the electrical properties between normal and ischemic tissue. 9 These currents do not have an electrical counterpart and thus cannot be picked up by EKG. 10 In this paper, we perform a systematic review and meta‐analysis to evaluate the diagnostic test characteristics of MCG for CAD.
METHODS
Study Selection
We searched MEDLINE and the Cochrane Central Register of Controlled Trials from 1948 to August 2011 using keywords and/or medical subject headings (MeSH) for CAD and MCG. Titles and abstracts of English language references identified in our search were screened by one author and all articles meeting inclusion criteria underwent full‐text review by two independent reviewers. Any disagreements were resolved by consensus or arbitration. We included prospective studies that evaluated the test characteristics (e.g., sensitivity, specificity, likelihood ratios) of MCG for detection of CAD. Studies were included if they evaluated (1) patients with stable CAD documented by angiogram or (2) patients presenting initially with acute coronary syndrome and subsequently diagnosed as CAD using EKG, cardiac biomarkers, stress testing, or angiogram.
Data Extraction
We extracted data on the study design, population, sample size, and the data used to calculate test characteristics (true positives, false positives, false negatives, and true negatives). Data was extracted by one author and verified by another author for accuracy. We assessed the quality of individual studies using an adaptation of the Quality Assessment of Diagnostic Accuracy Studies (QUADAS) tool (Table 1). 11 Studies were considered to be of high quality when both reference standard and index test results were blinded.
Table 1.
Quality Assessment Tool
| Item | Definition |
|---|---|
| Representative spectrum? | Was the spectrum of patients representative of the patients who will receive the test in practice? |
| Acceptable reference standard? | Is the reference standard likely to correctly classify the target condition? |
| Acceptable delay between tests? | Is the time period between reference standard and index test short enough to be reasonably sure that the target condition did not change between the two tests? |
| Incorporation avoided? | Was the reference standard independent of the index test? (i.e., the index test did not form part of the reference standard). |
| Reference standard results blinded? | Were the index test results interpreted without knowledge of the results of the reference standard? |
| Index test results blinded? | Were the reference standard results interpreted without knowledge of the results of the index test? |
| Relevant clinical information? | Were the same clinical data available when test results were interpreted as would be available when the test is used in practice? |
| Withdrawals explained? | Were withdrawals from the study explained? |
Statistical Analyses
We performed meta‐analyses of sensitivity, specificity and positive and negative likelihood ratios using Meta‐DiSc software. 12 We used a random effects approach for the meta‐analyses that allowed us to account for variations within and between studies. 13 We also evaluated the pooled sensitivity and specificity by fitting the summary receiver operating characteristic (SROC) curve. The SROC curve graphs the sensitivity (or true positive rate) against (1‐specificity) (or false positive rate), similar to the receiver operating characteristic (ROC) curve for a single study. The only difference is that each data point in the SROC curve represents a different study and not a different testing threshold like in the ROC curve. The area under the curve (AUC) is also an indicator of the overall performance or accuracy of the test. Overall test accuracy is indicated by the closeness of the graph to the top left corner or an AUC close to unity. 14 The I2 statistic was used to evaluate heterogeneity and significant heterogeneity was defined as an I 2 statistic >50%. We examined causes of heterogeneity using unweighted univariate meta‐regression utilizing the Littenberg and Moses linear model. 15 , 16
RESULTS
Study Selection
Our literature search initially yielded 54 articles. Screening of titles and abstracts followed by full‐text screening yielded seven studies that met our inclusion criteria (Fig. 1). 3 , 17 , 18 , 19 , 20 , 21 , 22
Figure 1.
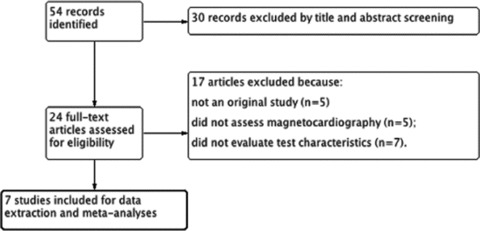
Flow diagram for selection of included studies.
Study Characteristics
The seven studies included a total of 590 patients. The study characteristics are shown in Table 2. In five studies, the patients included had stable CAD 3 , 17 , 18 , 21 , 22 and in the remaining two studies, patients presented with acute chest pain and were subsequently diagnosed with CAD. 19 , 20 Most of the CAD patients in the included studies had coronary angiograms with documented epicardial coronary artery stenosis greater than 50–75%. The studies were conducted using unshielded rooms in four studies 19 , 20 , 21 , 22 and magnetically shielded rooms in the remaining studies. 3 , 17 , 18
Table 2.
Study Characteristics
| Author (Year) | Study design | Test (N) | Control (N) | Setting Where Test Performed |
|---|---|---|---|---|
| Gapelyuk et al., 2010 17 | Prospective nonrandomized controlled study | Patients with symptomatic stable CAD and angiographically proven > 50% stenosis of all three coronary arteries (101) | Healthy subjects with no CAD history, normal EKG, echocardiogram, Holter monitoring and exercise testing (59) | Shielded room |
| Kandori et al., 2010 18 | Prospective nonrandomized controlled study | Patients with angiographically proven > 75% stenosis of a vessel (56) | Healthy subjects (101) | Shielded room |
| Park et al., 2008 3 | Prospective nonrandomized controlled study | Patients with angiographically proven ≥ 70% stenosis of a vessel (42) | Patients with angiographically proven nonobstructive CAD (58) | Shielded room |
| Tolstrup et al., 2006 19 | Prospective nonrandomized controlled study | Patients presenting with chest pain diagnosed as acute coronary syndrome (56) | Subjects with EKG, troponin or angiographic results not consistent with CAD (70) | Unshielded room |
| Park et al., 2005 20 | Prospective nonrandomized controlled study | Patients presenting with chest pain diagnosed as CAD with EKG, troponin elevation, echocardiography or coronary angiography (143) | Subjects with normal EKG, troponins or coronary evaluation presenting with chest pain (42) | Unshielded room |
| Steinberg et al., 2005 21 | Prospective nonrandomized controlled study | Patients with angiographically proven > 50% stenosis of a vessel (19) | Patients with angiographically proven nonobstructive CAD (34) | Unshielded room |
| Hailer et al., 2005 22 | Prospective nonrandomized controlled study | Patients with stable angina with ≥ 50% stenosis of a vessel (171) | Healthy subjects (117) | Unshielded room |
CAD = coronary artery disease; EKG = electrocardiogram.
The study quality assessment is shown in Figure 2. Reference standard results were blinded in three studies 3 , 20 , 22 and index test results were blinded in four studies. 3 , 20 , 21 , 22 The reasons for withdrawal were explained in two studies. 20 , 21
Figure 2.
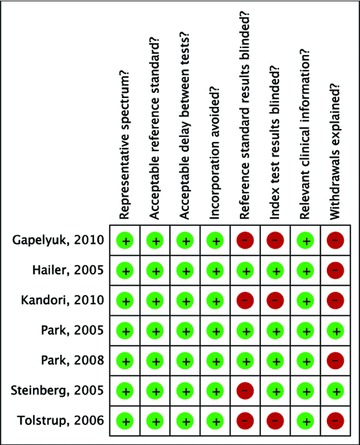
Study quality assessment.
Test Characteristics
Meta‐analyses yielded a pooled sensitivity of 83% (95% CI 80% to 86%; I2= 83.8%) and a specificity of 77% (95% CI 73% to 81%, I2= 85.9%; Fig. 3). The pooled positive likelihood ratio was 3.92 (95% CI 2.30 to 6.66, I2= 88.6%) and negative likelihood ratio was 0.20 (95% CI 0.12 to 0.35, I2= 84.2%; Fig. 4). The AUC on the SROC curve was 0.90 (Fig. 5). We examined sources of the significant heterogeneity using the study level covariates of clinical presentation (stable CAD vs. acute coronary syndrome), setting where test was performed (shielded vs. unshielded) and study quality (high versus low). Meta‐regression suggested that heterogeneity was not due to any of these covariates (P‐value of 0.67, 0.41, and 0.73, respectively). No one study impacted heterogeneity. This was evaluated by sequentially eliminating individual studies from the meta‐analyses.
Figure 3.
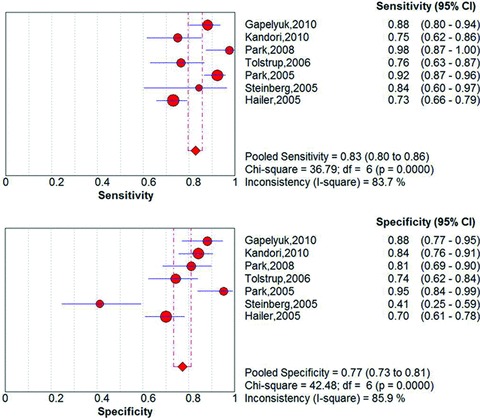
Pooled sensitivity and specificity.
Figure 4.
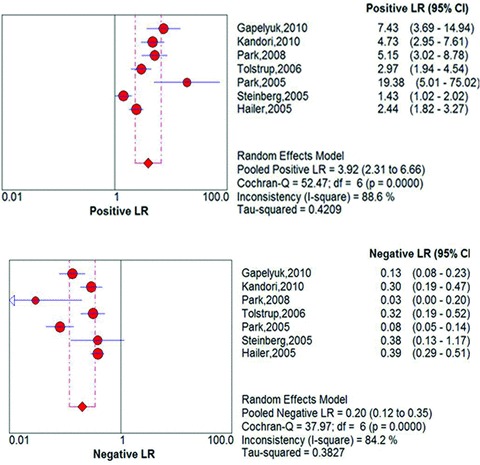
Pooled positive and negative likelihood ratios.
Figure 5.
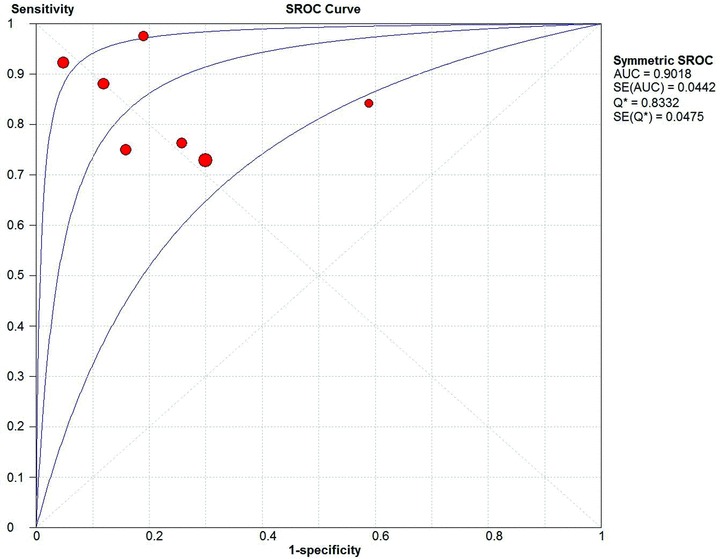
Summary receiver operating characteristics (SROC) curve.
DISCUSSION
To our knowledge, this is the first systematic review and meta‐analysis evaluating the test characteristics of MCG for the diagnosis of CAD. Our pooled test characteristics for MCG (Figs. 3 and 4) are similar to those of existing noninvasive modalities diagnosing CAD 23 , 24 , 25 and have significantly higher sensitivity than the standard resting EKG. Compared to the pooled sensitivity of 83% for MCG, the sensitivity of EKG ranges between 14 and 45%. Apart from being more sensitive to tangential currents, MCG measures multiple sites whereas an EKG covers only a narrow region of the precordial surface. Also, magnetic signal is less influenced by variations of conductance in overlying body structures than surface EKG. MCG thus shows ischemia‐induced deviations with better accuracy. 17 , 26
The current American College of Cardiology/American Heart Association guidelines recommend the use of EKG treadmill testing in patients with intermediate pretest probability of CAD. However, baseline EKG changes like Wolff‐Parkinson‐White syndrome, left bundle branch block and ST segment depression >1 mm preclude its use. Patients with intermediate pretest probability of CAD who are unable to undergo EKG stress testing due to any of these factors are recommended to undergo cardiac stress testing with imaging. 27 These modalities are not always readily available and are limited by operator dependent characteristics or reader variability. 28 MCG may provide an advantage as it can be interpreted using computer‐generated algorithms. 19
Our results suggest that MCG can potentially be used as a complementary tool to existing diagnostic algorithms for diagnosis of CAD. For instance, a 35‐year‐old man with nonanginal chest pain has a low pretest probability of CAD and would be discharged from the emergency department or hospital without a stress test. As shown in Table 3, a positive result with MCG in such a patient would increase the probability of CAD to intermediate, thus necessitating a stress test. In certain circumstances, MCG could also be used as an alternative to stress testing. A 45‐year‐old female patient with classic anginal chest pain would usually undergo stress testing and then be initiated on medical therapy pending a coronary angiogram if the stress test were positive. Using MCG instead of stress testing would result in the same conclusion. 29 Also, for a given prevalence of CAD in a population, the pooled sensitivity and specificity of MCG can be used to calculate positive and negative predictive values for the test. For instance, the age‐adjusted prevalence of CAD in the United States is 6% 1 and yields a positive predictive value of 19% and a negative predictive value of 99% for MCG, suggesting that MCG could be useful in this population to rule out CAD.
Table 3.
Use of Magnetocardiography in Diagnosis of Coronary Artery Disease
| 35‐year‐old man with nonanginal chest pain |
| Pretest probability of CAD = 0.05 (low; no stress test necessary) |
| Pretest odds of CAD = Pretest probability /(1 – pretest probability) = 0.05 /(1 – 0.05) = 0.05 |
| Posttest odds of CAD = Pretest odds × likelihood ratio of MCG = 0.05 × 3.92 = 0.20 |
| Posttest probability of CAD = posttest odds /(1 + posttest odds) = 0.20 /(1+ 0.20) = 0.17 (intermediate; stress testing indicated) |
| 45‐year‐old woman with typical anginal chest pain |
| Pretest probability of CAD = 0.55 (intermediate, stress testing indicated) |
| Pretest odds of CAD = pretest probability /(1 – pretest probability) = 0.55 /(1 – 0.55) = 1.22 |
| Posttest odds of CAD = pretest odds × likelihood ratio of MCG = 1.22 × 3.92 = 4.78 |
| Posttest probability of CAD = posttest odds /(1 + posttest odds) = 4.78 /(1 + 4.78) = 0.83 (high; medical therapy pending coronary angiogram is indicated) |
CAD = coronary artery disease; MCG = magnetocardiography.
This review is the first attempt to systematically identify all evidence on the diagnostic performance of MCG. Our findings are relevant to the numerous patients presenting with chest pain or being evaluated for CAD. The limitations of our analysis stem from the low quality of evidence on this technology at the current time. We also found significant heterogeneity between study results that could not be explained by study level variables like study quality, clinical presentation of the patient, or recording of the magnetocardiogram in a shielded versus unshielded room. "Threshold effect," however, may have been an important contributor to the heterogeneity we observed. Such an effect results from the use by individual studies of varying implicit or explicit cutoffs for defining a positive or negative test. 12 At the present time, there is no consensus on the diagnostic threshold for CAD using MCG and different parameters were used by each study included in our review.
In summary, this analysis suggests that MCG is a potential complementary or alternative tool for noninvasive detection of CAD. Future head‐to‐head trials comparing MCG‐driven diagnosis and treatment strategies to existing strategies driven by other noninvasive techniques are needed to examine differences between these strategies on cardiovascular morbidity and mortality. The application of MCG should also be tested in patient populations where other noninvasive modalities cannot be performed or interpreted.
Acknowledgments
Acknowledgments: We thank Benjamin French, Ph.D., for reviewing a previous version of this manuscript and Marwan Kattan, M.D., for helping with the initial screening of references.
Financial Support: None
REFERENCES
- 1. Roger VL, Go AS, Lloyd‐Jones DM, et al. Heart disease and stroke statistics–2011 update: A report from the American Heart Association. Circulation. 2011;123(4):e18‐e209. [DOI] [PMC free article] [PubMed] [Google Scholar]
- 2. Hailer B, Van Leeuwen P. Detection of coronary artery disease with MCG. Neurol Clin Neurophysiol 2004;2004:82. [PubMed] [Google Scholar]
- 3. Park JW, Leithauser B, Vrsansky M, et al. Dobutamine stress magnetocardiography for the detection of significant coronary artery stenoses – a prospective study in comparison with simultaneous 12‐lead electrocardiography. Clin Hemorheol Microcirc. 2008;39(1–4):21–32. [PubMed] [Google Scholar]
- 4. Park JW, Leithauser B, Hill P, et al. Resting magnetocardiography predicts 3‐year mortality in patients presenting with acute chest pain without ST segment elevation. Ann Noninvasive Electrocardiol. 2008;13(2):171–179. [DOI] [PMC free article] [PubMed] [Google Scholar]
- 5. Fenici R, Brisinda D, Meloni AM. Effects of filtering on computer‐aided analysis for detection of chronic ischemic heart disease with unshielded rest magnetocardiographic mapping. Neurol Clin Neurophysiol. 2004;2004:7. [PubMed] [Google Scholar]
- 6. Kyoon Lim H, Kim K, Lee YH, et al. Detection of non‐ST‐elevation myocardial infarction using magnetocardiogram: New information from spatiotemporal electrical activation map. Ann Med. 2009;41(7):533–546. [DOI] [PubMed] [Google Scholar]
- 7. Baule G, Mcfee R. Detection of the magnetic field of the heart. Am Heart J. 1963;66:95–96. [DOI] [PubMed] [Google Scholar]
- 8. Moshage W, Achenbach S, Weikl A, et al. Clinical magnetocardiography: Experience with a biomagnetic multichannel system. Int J Card Imaging. 1991;7(3–4):217–223. [DOI] [PubMed] [Google Scholar]
- 9. Hopenfeld B, Stinstra JG, Macleod RS. Mechanism for ST depression associated with contiguous subendocardial ischemia. J Cardiovasc Electrophysiol. 2004;15(10):1200–1206. [DOI] [PubMed] [Google Scholar]
- 10. Roth BJ, Wikswo JP, Jr. Electrically silent magnetic fields. Biophys J. 1986;50(4):739–745. [DOI] [PMC free article] [PubMed] [Google Scholar]
- 11. Whiting P, Rutjes AW, Reitsma JB, et al. The development of QUADAS: A tool for the quality assessment of studies of diagnostic accuracy included in systematic reviews. BMC Med Res Methodol. 2003;3:25. [DOI] [PMC free article] [PubMed] [Google Scholar]
- 12. Zamora J, Abraira V, Muriel A, et al. Meta‐DiSc: A software for meta‐analysis of test accuracy data. BMC Med Res Methodol. 2006;6:31. [DOI] [PMC free article] [PubMed] [Google Scholar]
- 13. DerSimonian R, Laird N. Meta‐analysis in clinical trials. Control Clin Trials. 1986;7(3):177–188. [DOI] [PubMed] [Google Scholar]
- 14. Jones CM, Athanasiou T. Summary receiver operating characteristic curve analysis techniques in the evaluation of diagnostic tests. Ann Thorac Surg. 2005;79(1):16–20. [DOI] [PubMed] [Google Scholar]
- 15. Moses LE, Shapiro D, Littenberg B. Combining independent studies of a diagnostic test into a summary ROC curve: Data‐analytic approaches and some additional considerations. Stat Med. 1993;12(14):1293–1316. [DOI] [PubMed] [Google Scholar]
- 16. Lijmer JG, Bossuyt PM, Heisterkamp SH. Exploring sources of heterogeneity in systematic reviews of diagnostic tests. Stat Med. 2002;21(11):1525–1537. [DOI] [PubMed] [Google Scholar]
- 17. Gapelyuk A, Schirdewan A, Fischer R, et al. Cardiac magnetic field mapping quantified by kullback‐leibler entropy detects patients with coronary artery disease. Physiol Meas. 2010;31(10):1345–1354. [DOI] [PubMed] [Google Scholar]
- 18. Kandori A, Ogata K, Miyashita T, et al. Subtraction magnetocardiogram for detecting coronary heart disease. Ann Noninvasive Electrocardiol. 2010;15(4):360–368. [DOI] [PMC free article] [PubMed] [Google Scholar]
- 19. Tolstrup K, Madsen BE, Ruiz JA, et al. Non‐invasive resting magnetocardiographic imaging for the rapid detection of ischemia in subjects presenting with chest pain. Cardiology. 2006;106(4):270–276. [DOI] [PubMed] [Google Scholar]
- 20. Park JW, Hill PM, Chung N, et al. Magnetocardiography predicts coronary artery disease in patients with acute chest pain. Ann Noninvasive Electrocardiol. 2005;10(3):312–323. [DOI] [PMC free article] [PubMed] [Google Scholar]
- 21. Steinberg BA, Roguin A, Watkins SP 3rd, et al. Magnetocardiogram recordings in a nonshielded environment–reproducibility and ischemia detection. Ann Noninvasive Electrocardiol. 2005;10(2):152–160. [DOI] [PMC free article] [PubMed] [Google Scholar]
- 22. Hailer B, Chaikovsky I, Auth‐Eisernitz S, et al. The value of magnetocardiography in patients with and without relevant stenoses of the coronary arteries using an unshielded system. Pacing Clin Electrophysiol. 2005;28(1):8–16. [DOI] [PubMed] [Google Scholar]
- 23. Beller GA, Watson DD, Ackell P, Pohost GM. Time course of thallium‐201 redistribution after transient myocardial ischemia. Circulation. 1980;61(4):791–797. [DOI] [PubMed] [Google Scholar]
- 24. Fleischmann KE, Hunink MG, Kuntz KM, et al. Exercise echocardiography or exercise SPECT imaging? A meta‐analysis of diagnostic test performance. Journal of Nuclear Cardiology. 2002;9(1):133–134. [DOI] [PubMed] [Google Scholar]
- 25. Marshall RC, Tillisch JH, Phelps ME, et al. Identification and differentiation of resting myocardial ischemia and infarction in man with positron computed tomography, 18F‐labeled fluorodeoxyglucose and N‐13 ammonia. Circulation. 1983;67(4):766–778. [DOI] [PubMed] [Google Scholar]
- 26. Kwon H, Kim K, Lee YH, et al. Non‐invasive magnetocardiography for the early diagnosis of coronary artery disease in patients presenting with acute chest pain. Circ J. 2010;74(7):1424–1430. [DOI] [PubMed] [Google Scholar]
- 27. Gibbons RJ, Balady GJ, Bricker JT, et al. American College of Cardiology/American Heart Association Task Force on Practice Guidelines. Committee to Update the 1997 Exercise Testing Guidelines. ACC/AHA 2002 guideline update for exercise testing: Summary article. A report of the american college of Cardiology/American heart association task force on practice guidelines (committee to update the 1997 exercise testing guidelines). J Am Coll Cardiol. 2002;40(8):1531–1540. [DOI] [PubMed] [Google Scholar]
- 28. Kaul S. Technical, economic, interpretative, and outcomes issues regarding utilization of cardiac imaging techniques in patients with known or suspected coronary artery disease. Am J Cardiol. 1995;75(11):1824. [PubMed] [Google Scholar]
- 29. Diamond GA, Forrester JS. Analysis of probability as an aid in the clinical diagnosis of coronary‐artery disease. N Engl J Med. 1979;300(24):1350–1358. [DOI] [PubMed] [Google Scholar]


