Abstract
Background: Changes in autonomic regulation of the heart may be responsible for the occurrence of arrhythmias. Although a decrease in 24‐hour heart rate variability is a strong predictor of subsequent arrhythmias in patients with heart disease, many questions remain unanswered concerning changes in heart rate and heart rate variability in the minutes or hours preceding an arrhythmia. The aim of our study was to analyze changes in heart rate and heart rate variability occurring during the 90 minutes preceding an arrhythmia, in patients with coronary heart disease and an implantable defibrillator.
Materials and Methods: Thirty‐eight patients, with a total of 93 episodes of ventricular arrhythmia, were included in the study. Heart rate and heart rate variability were measured in three 30‐minute and five 2‐minute periods preceding the arrhythmia. Heart rate variability was assessed using measurements of Poincaré plots.
Results: The results show a gradual increase in heart rate before the arrhythmia, from 73 ± 13/min, to 75 ± 14/min, and finally 78 ± 15/min in the 90 minutes preceding the arrhythmia (P < 0.05).
Conclusion: Measurements of Poincaré plots showed a significant increase in their length and no significant change in their width. These results suggest that sympathetic activation is the predominant change in autonomic nervous system before a ventricular arrhythmia in patients with coronary heart disease. This change may occur as early as one hour and a half before the arrhythmia.
Keywords: heart rate, heart rate variability, implantable defibrillator
The autonomic nervous system is an important component of the physiopathology of arrhythmias. A link between changes in the control of the heart by the autonomic nervous system and the occurrence of arrhythmias was demonstrated in experimental and clinical studies.
However, until recently the study of spontaneous human arrhythmias was limited by the paucity of the data available. There are only a limited number of patients who experience sustained ventricular arrhythmias during 24‐hour Holter monitoring and international cooperation over a long time period is mandatory for the gathering of sufficient data. An homogeneous database of patients with a large number of events and similar Holter recording techniques is unlikely. Recent improvements in the memory capacity of implantable cardiac defibrillator allow the study of changes in R‐R intervals over prolonged periods of time.
Heart rate variability is a powerful predictor of mortality and arrhythmic events in different populations. 1 , 2 Heart rate itself was evidenced in a number of studies as a potent risk stratifier. 3 , 4 However, only limited data are available to understand changes in the autonomic nervous system before the occurrence of arrhythmias. 5 , 6 , 7 , 8 , 9 , 10
The aim of our study was to analyze heart rate and heart rate variability before the occurrence of a sustained arrhythmia in patients with coronary vascular disease and an implantable defibrillator with prolonged recording capacities before the event.
METHODS
Patient Population
The VALID (VAriability Learned from Implantable Defibrillator) study was designed to study changes in heart rate and heart rate variability in patients receiving an implantable defibrillator with extended memory capacity. A total of 226 patients with a wide spectrum of heart diseases and arrhythmias were included in the study. Among these, 123 had ischemic heart disease. A total of 38 patients with ischemic heart disease received at least one appropriate therapy for an arrhythmic event. These 38 patients were selected for the present study. Their characteristics are summarized in Table 1. Although these patients have a certain degree of heterogeneity regarding the state of their coronary heart disease and their treatment, each subject is its own control for the comparison of heart rate and heart rate variability for the different time period selected.
Table 1.
Clinical Characteristics of the Patients (n = 38)
| Age (years, mean ± SD) | 66 ± 9 |
| Previous myocardial infarction (%) | 68 |
| Ejection fraction (%, mean ± SD) | 35 ± 13 |
| NYHA class (%) | |
| ‐ I | 16 |
| ‐ II | 71 |
| ‐ III | 13 |
| Treatment at implantation (%) | |
| ‐ Beta‐blockers | 74 |
| ‐ Amiodarone | 55 |
| ‐ Sotalol | 11 |
| ‐ ACE‐inhibitors | 25 |
| Diagnosis at implantation (n) | |
| ‐ Ventricular tachycardia | 35 |
| ‐ Sudden death | 2 |
| ‐ Both | 1 |
Implantable Defibrillator
Patients received a Biotronik phylax XM or mycrophylax plus defibrillator. These devices have extended memory capacities. A total of 18,000 R‐R intervals (180 minutes and beyond) can be stored before the beginning of an arrhythmia in the memory of the device. These 18,000 R‐R intervals were split into two in order to record the 9,000 intervals before two different arrhythmic events. Therefore, we obtained 90 minutes of stored R‐R intervals before each arrhythmic event.
Arrhythmias
Patients were followed up according to a standard protocol. For each event recorded, the accuracy of the diagnosis was reviewed by the electrophysiologist in charge of the patient. If the treatment delivered by the device was considered as appropriate, the RR files preceding the arrhythmia were stored for the purpose of the study.
To avoid discrepancies in the statistical weight of each patient, the number of selected episodes was limited to the first five events for a single patient. The breakout of the number of events per patient is presented in Table 2. A total of 93 arrhythmic episodes are the subject of the analysis.
Table 2.
Number of Ventricular Arrhythmias Requiring Treatment per Patient
| Patients | Ventricular Arrhythmias |
|---|---|
| 5 | 5 |
| 6 | 4 |
| 5 | 3 |
| 7 | 2 |
| 15 | 1 |
| Total = 38 | Total = 93 |
Heart Rate and Heart Rate Variability Analysis
The stored R‐R intervals cannot distinguish sinus rhythm from ectopic rhythms. Heart rate was therefore assessed according to the true number of ventricular depolarization, regardless of their putative origin. Heart rate was calculated as the total number of stored R‐R intervals divided by the duration of the recording in minutes, without applying any filter.
Heart rate variability was measured according to the Poincaré diagram method. 11 , 12 , 13 , 14 Poincaré diagrams are constructed from R‐R interval series by plotting each R‐R interval against the preceding interval. The length of the plot is a measure of long‐term heart rate variability, and its width a measure of beat‐to‐beat variability. 11 In order to exclude ectopic beats from the measurement of heart rate variability, the Poincaré diagram was filtered and all R‐R intervals diverging by more than 15% from the adjacent intervals were excluded. Filtering the RR files resulted in the exclusion of (mean ± SD) 10 ± 10% of all R‐R intervals. Heart rate variability was then assessed using two parameters, the length of the plot and its width measured at the level of the mean R‐R interval.
Time Period
Heart rate and heart rate variability were measured during the 90 minutes preceding a ventricular arrhythmia. We studied the evolution of heart rate and heart rate variability on a long and a short period before the occurrence of a ventricular arrhythmia. To study these changes on a long time scale, we divided the 90 minutes into three 30‐minute periods. The short time scale was studied by dividing the last 10 minutes into five 2‐minute periods.
Statistical Analysis
Heart rate and heart rate variability (Poincaré diagram length and width) were compared between time periods of the same duration using a paired t‐test. A P value below 0.05 was considered statistically significant.
RESULTS
Heart Rate
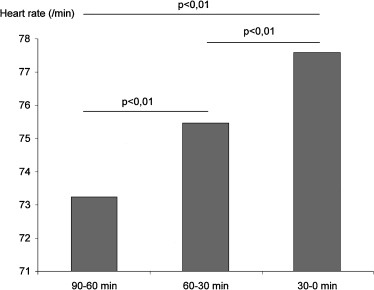
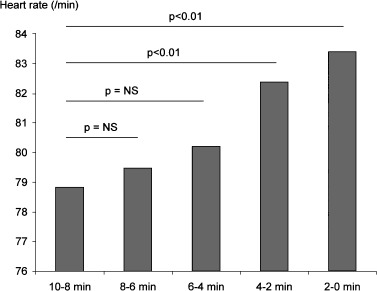
During the three 30‐minute time periods before ventricular arrhythmia, heart rate increased gradually from 73 ± 13/min to 75 ± 14/min, and finally 78 ± 15/min just before the arrhythmia (P < 0.01). These differences were statistically significant (Fig. 1). An increase in heart rate was also evidenced when the last 10 minutes before the arrhythmia were segmented into five 2‐minute periods. There was a progressive increase in heart rate from 79 ± 16/min to 83 ± 18/min (Fig. 2). These differences were statistically significant.
Figure 1.

Changes in heart rate in the 90 minutes preceding ventricular arrhythmia.
Figure 2.

Changes in heart rate in the 10 minutes preceding ventricular arrhythmia.
Heart Rate Variability
Heart rate variability was assessed using measurements of the Poincaré diagram. The length of the diagram is a measure of global heart rate variability, whereas its width is a measure of beat‐to‐beat variability.
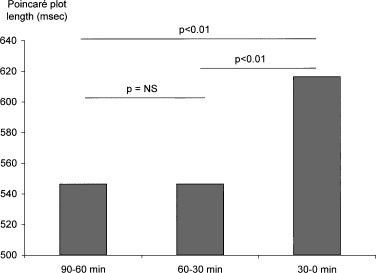
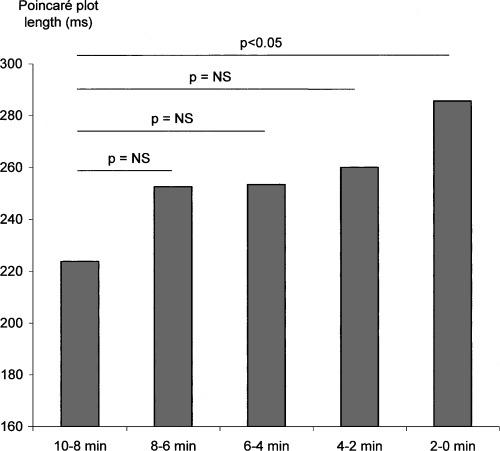
There was a significant increase in the length of Poincaré diagram before the occurrence of a ventricular arrhythmia. This increase in global heart rate variability was evidenced when the total time was segmented into 30‐minute periods (Fig. 3). There was also a significant increase in the length of the Poincaré diagram in the last 10 minutes (Fig. 4). No change in the width of Poincaré diagram was evidenced neither in the hour and a half preceding the ventricular arrhythmia, nor in the 10‐minute period.
Figure 3.

Changes in heart rate variability (Poincaré plot length) in the 90 minutes preceding ventricular arrhythmia.
Figure 4.

Changes in heart rate variability (Poincaré plot length) in the 10 minutes preceding ventricular arrhythmia.
DISCUSSION
Our results show changes in heart rate before the occurrence of a ventricular arrhythmia in patients with ischemic heart disease and an implanted defibrillator. There was a gradual increase in heart rate before the arrhythmia. This increase was evidenced not only in the minutes preceding the arrhythmia but also on a longer time scale (90 minutes).
The changes in heart rate variability, evidenced in our study, should be interpreted as a consequence of the changes in heart rate, reflecting the instability of the system before the ventricular arrhythmia.
Changes in Heart Rate
In this study, heart rate was measured as the total number of heart beats divided by time. Existing defibrillator technology did not allow distinction between R‐R intervals of supraventricular or ventricular origin. Therefore, instead of applying filtering methods with arbitrary limits, we chose to select all R‐R intervals, counting all events, normal sinus rhythm and premature beats. The heart rate measured in this study is therefore a true heart rate, if not the sinus rate.
Although disregarded is some heart rate variability studies, heart rate is important to consider for the understanding of the effect of the autonomic nervous system on the heart. 15 It is also a powerful risk stratifier in different populations and specifically in patients with ischemic heart disease. 3 Moreover, contrary to heart rate variability analysis, the methods for measuring heart rate are robust. Heart rate is measured by dividing the number of beats by time, whereas measurement of heart rate variability requires an accurate determination of each R‐R interval. When time was segmented into short periods, i.e., the last 10 minutes divided into five 2‐minute periods, there was a progressive increase in heart rate until the occurrence of the ventricular arrhythmia.
This increase in heart rate can be explained by a change in the autonomic nervous system toward more sympathetic and/or less vagal tone.
In our study we also found a progressive increase in heart rate over the hour and a half preceding the ventricular arrhythmia. These changes suggest that the imbalance of the autonomic nervous system starts early before the arrhythmia and as long as one hour before. These results favour a progressive build‐up of autonomic imbalance, rather than a short and sudden abnormality leading to the arrhythmia.
Heart Rate Variability
Global heart rate variability increased before the ventricular arrhythmia. Heart rate variability was measured using the Poincaré plot method. 11 This method displays beat‐to‐beat variability by plotting each R‐R interval against the preceding interval. The length of the plot represents a measure of global heart rate variability. Changes in heart rate increase heart rate variability. In stable conditions, heart rate variability is the consequence of cyclic variations in heart rate, under the control of the autonomic nervous system. However, the conditions before the occurrence of a ventricular arrhythmia are not stable. It is plausible to speculate that the increase in global heart rate variability before the arrhythmia was a consequence of progressive changes in heart rate.
On the contrary there was no change in the width of the Poincaré plot, a measure of beat‐to‐beat variability. This measure of heart rate variability may not be as sensitive as heart rate itself to detect changes in autonomic modulation in patients with presumably decreased vagal tone. Most patients had previous myocardial infarction and low ejection fraction, conditions associated with a decreased vagal tone. A further decrease in heart rate variability of small amplitude could have been overlooked with this method.
Comparison with Previous Studies
Heart rate and heart rate variability before the occurrence of a ventricular arrhythmia were studied previously using data from an implantable defibrillator. 8 , 9 , 10 However, these studies were limited by the duration of the data available before the ventricular arrhythmia. In the study by Lombardi and collaborators, heart rate variability was studied using the 2000 electrograms stored before the arrhythmia. 8 Data concerning heart rate were similar to our study. Heart rate was faster before the arrhythmia as compared to the control period. There was also a increase in heart rate between 20 minutes and just before the arrhythmia. Data on heart rate variability are more difficult to analyze. Lombardi's results, using spectral analysis of R‐R intervals, are concordant with a shift toward more sympathetic and/or less vagal tone before the arrhythmia. The increase in heart rate demonstrated in our study is in accordance with this result. The analysis of the Poincaré plot does not yield a similar conclusion. However, given the progressive increase in heart rate, the system can be considered as unstable and the analysis of the Poincaré plot may not only reflect cyclical variations in heart rate but also dynamic changes.
In the study by Pruvot and co‐workers heart rate also increased before the arrhythmia. 9 This result was obtained studying 1024 R‐R intervals before the arrhythmia. As in our study, there was an increase in heart rate in the minutes preceding the arrhythmia. No data were available before the 1024 R‐R intervals. In their total population, no consistent evolution of spectral indices of heart rate variability was noticed in the last windows of 2‐minute duration before the arrhythmia onset. The results of subgroup analysis, according to the presence of antiarrhythmic treatment, were at variance with the results in the total population. The increase of heart rate is therefore the most consistent change reflecting alterations in autonomic nervous system before a significant ventricular arrhythmia. Our study demonstrates that these changes occurs beyond the 1024 or 2000 R‐R intervals previously available. The 9000 intervals analyzed in the present study enabled us to demonstrate a long term build‐up of sympatho‐vagal imbalance, over a 90‐minute period.
Our results are in accordance with the study of Nemec, Hammill, and Shen who demonstrated changes in heart rate but not in heart rate variability before a ventricular arrhythmia in patients with an implantable defibrillator. 10 Again, the measurements were performed only on the 1000 R‐R intervals preceding the ventricular arrhythmia.
Our study was limited by the ability of the devices to distinguish between sinus beats and ectopic beats. Therefore, sinus rate and sinus rate variability could not be assessed. This limitation is inherent to the study of heart rate variability using devices such as pacemakers or implantable defibrillators. Progress could come from double‐chamber devices and their ability to record P waves. Heart rate and heart rate variability could then be analyzed from spontaneous atrial activity.
This study demonstrated a progressive increase in heart rate before the occurrence of a ventricular arrhythmia. The increase in heart rate was evidenced as long as one hour before the event. This result suggests that a progressive build‐up of sympatho‐vagal imbalance starts early before a significant arrhythmia.
APPENDIX
List of participating centers (all in France):
Jean‐Jacques Blanc, M.D. (Brest); Pierre Louis, M.D., Michel Fraison, M.D. (Dijon); Alain Amiel, M.D. (Poitiers); Jean Ponsonnaille, M.D., Hassan Mansour, M.D. (Clermont Ferrand); Paul Touboul, M.D., Philippe Chevalier, M.D. (Lyon); Florent Briand, M.D. (Besan ¸con); Philippe Mabo, M.D., Dominique Pavin, M.D. (Rennes); Patrick Blanc, M.D., Philippe Lagrange, M.D. (Limoges); Antoine Leenhardt, M.D., Olivier Thomas, M.D., Fabrice Extramiana, M.D. (Paris); Salem Kacet, M.D., Didier Klug, M.D., Claude Kouakam, M.D. (Lille); Philippe Durand, M.D., Claude Mariottini, M.D. (Saint‐Laurent du Var); Paul Bru, M.D. (La Rochelle), Patrice Scanu, M.D. (Caen); Jean‐Claude Deharo, M.D., Pierre Djiane, M.D. (Marseille); David Lellouche, M.D. (Créteil); Thomas Lavergne, M.D., Louis Guize, M.D. (Paris); André Pisapia, M.D. (Marseille).
Acknowledgments
Acknowledgments: We thank Agnès Vernay and Philippe Ortiz for their help in data management and statistical analysis.
REFERENCES
- 1. Kleiger RE, Miller JP, Bigger JT Jr, et al Decreased heart rate variability and its association with increased mortality after acute myocardial infarction. Am J Cardiol 1987;59: 256–262. [DOI] [PubMed] [Google Scholar]
- 2. Farrel TG, Bashir Y, Cripps T, et al Risk stratification for arrhythmic events in postinfarction patients based on heart rate variability, ambulatory electrocardiographic variables and the signal‐averaged electrocardiogram. J Am Coll Cardiol 1991;18: 687–697. [DOI] [PubMed] [Google Scholar]
- 3. Copie X, Hnatkova K, Staunton A, et al Predictive power of increased heart rate versus depressed left ventricular ejection fraction and heart rate variability for risk stratification after myocardial infarction: A two‐year follow‐up study. J Am Coll Cardiol 1996;27: 270–276. [DOI] [PubMed] [Google Scholar]
- 4. Schmidt G, Malik M, Barthel P, et al Heart‐rate turbulence after ventricular premature beats as a predictor of mortality after acute myocardial infarction. Lancet 1999;353: 1390–1398. [DOI] [PubMed] [Google Scholar]
- 5. Huikuri HV, Seppänen T, Koistinen MJ, et al Abnormalities in beat‐to‐beat dynamics of heart rate before the spontaneous onset of life‐threatening ventricular tacharrhythmias in patients with prior myocardial infarction. Circulation 1996;93: 1836–1844. [DOI] [PubMed] [Google Scholar]
- 6. Lü Fei, Keeling PJ, Gill JS, et al Heart rate variability and its relation to ventricular arrhythmias in congestive heart failure. Br Heart J 1994;71: 322–328. [DOI] [PMC free article] [PubMed] [Google Scholar]
- 7. Vybiral T, Glaeser DH, Goldberger AL, et al Conventional heart rate variability analysis of ambulatory electrocardiographic recordings fails to predict imminent ventricular fibrillation. J Am Coll Cardiol 1993;22: 557–565. [DOI] [PubMed] [Google Scholar]
- 8. Lombardi F, Porta A, Margazelli M, et al Heart rate variability patterns before ventricular tachycardia onset in patients with an implantable cardioverter defibrillator. Am J Cardiol 2000;86: 959–963. [DOI] [PubMed] [Google Scholar]
- 9. Pruvot E, Thonet G, Vesin JM, et al Heart rate dynamics at the onset of ventricular tachyarrhythmias as retrieved from implantable cardioverter‐defibrillators in patients with coronary artery disease. Circulation 2000;101: 2398–2404. [DOI] [PubMed] [Google Scholar]
- 10. Nemec J, Hammill SC, Shen WK. Increase in heart rate precedes episodes of ventricular tachycardia and ventricular fibrillation in patients with implantable cardioverter defibrillators: Analysis of spontaneous ventricular tachycardia database. PACE 1999;22: 1729–1738. [DOI] [PubMed] [Google Scholar]
- 11. Copie X, Le Heuzey JY, Iliou MC, et al Correlation between time‐domain measures of heart rate variability and scatterplots in post‐infarction patients. PACE 1996;19: 342–347. [DOI] [PubMed] [Google Scholar]
- 12. Woo MA, Stevenson WG, Moser DK, et al Complex heart rate variability and serum norepinephrine levels in patients with advanced heart failure. J Am Coll Cardiol 1994;23: 565–569. [DOI] [PubMed] [Google Scholar]
- 13. Hnatkova K, Copie X, Staunton A, Malik M. Numerical processing of Lorenz plots of RR intervals from long term ECGs: Comparison with time‐domain measures of heart rate variability for risk stratification after myocardial infarction. J Electrocardiol 1995;28(suppl):16–22. [DOI] [PubMed] [Google Scholar]
- 14. Marciano F, Migaux ML, Acanfora D, et al Quantification of Poincaré maps for the evaluation of heart rate variability. Comp Cardiol 1994;0276‐6547: 577–580. [Google Scholar]
- 15. Coumel P, Maison‐Blanche P, Catuli D. Heart rate and heart rate variability in normal young adults. J Cardiovasc Electrophysiol 1994;5: 899–911. [DOI] [PubMed] [Google Scholar]


