Abstract
Background: The International Conference on Harmonization E14 Guideline specifies detailed assessment of QT interval or corrected QT interval prolongation when developing new drugs. We recently devised new software to precisely measure the QT interval.
Methods and Results: The QT intervals of all leads for a selected single heart beat were compared between automated measurement with the new software from Fukuda Denshi and manual measurement. With both automated and manual measurement, QT intervals obtained by the tangent method were shorter than those obtained by the differential threshold method, but the extent of correction was smaller. QT interval data obtained by the differential threshold method were more similar to values obtained by visual measurement than were data obtained by the tangent method, but the extent of correction was larger. Variability was related to the T‐wave amplitude and to setting the baseline and tangent in the tangent method, while skeletal muscle potential noise affected the differential threshold method. Drift, low‐amplitude recordings, and T‐wave morphology were problems for both methods. Among the 12 leads, corrections were less frequent for leads II and V3–V6.
Conclusion: We conclude that, for a thorough assessment of the QT/QTc interval, the tangent method or the differential threshold method appears to be suitable because of smaller interreader differences and better reproducibility. Correction of data should be done by readers who are experienced in measuring the QT interval. It is also important for electrocardiograms to have little noise and for a suitable heart rate and appropriate leads to be selected.
Ann Noninvasive Electrocardiol 2011;16(2):156–164
Keywords: QT interval, tangent method, differential threshold method, automated measurement, manual measurement
After cardiac arrest due to ventricular arrhythmia was caused by an antihistamine in the United States, in 1995, the importance of assessing the cardiac safety of investigational drugs, especially influence on the QT interval or corrected QT interval (QT/QTc interval), during clinical trials has been emphasized. 1 , 2 It is well known that drug‐induced QT prolongation can lead to serious ventricular arrhythmias. This proarrhythmic effect is known for many drugs, including antibiotics, antiallergy agents, and prokinetic agents, as well as antiarrhythmic drugs. 3 With respect to new medicinal products, the International Conference on Harmonization (ICH) has issued Guideline S7B “The Non‐Clinical Evaluation of the Potential for Delayed Ventricular Repolarization (QT Interval Prolongation) by Human Pharmaceuticals” for non‐clinical studies 4 and Guideline E14 “The Clinical Evaluation of QT/QTC Interval Prolongation and Proarrhythmic Potential for Non‐Antiarrhythmic Drugs” 5 for clinical trials. In May 2005, agreement on the E14 Guideline was reached between Japan, the United States, and the EU under the ICH framework. As a result, the effect of an investigational product on the QT/QTc interval must carefully be evaluated, although, it is still not a legal requirement in Japan. It is well known that prolongation of the QT/QTc interval can lead to fatal ventricular arrhythmia, so it is extremely important to precisely measure this interval. At present, there are several methods of QT/QTc interval measurement available, with each method having its advantages and disadvantages so that no standard method has been adopted. The E14 Guideline accepts semiautomated measurement in a thorough QT interval study (i.e., combined use of manual reading and software) provided that quality assurance is possible. We recently developed software for a detailed automated measurement of the QT interval. In the present study, we compared QT values obtained by both automated and manual measurement using the differential threshold and tangent methods.
METHODS
A 12‐lead electrocardiogram was recorded at rest in 38 healthy volunteers (35 men with an average age of 36.6 years and three women with an average age of 36 years) using an FX‐7402 electrocardiograph (Fukuda Denshi Co. Ltd., Tokyo, Japan). Data were automatically analyzed using QT interval analysis software (QTD‐2, Fukuda Denshi). This software performed measurement of the T wave, correction of the baseline, and QT interval measurement by the differential threshold and tangent methods. In addition, the QT intervals in all leads for a selected heart beat were measured by the automated and manual methods, and the results were compared. The “corrected values” of the QT interval were provided as the difference between automated and manual QT interval. Figures 1 and 2 show automated measurement of the QT interval by the tangent and differential threshold methods, respectively. In the tangent method, the maximum slope of the descending limb of the T wave is identified from the maximum negative value of the differentiated waveform. A tangent is drawn from that point, and the distance from the point where the tangent crosses the baseline to the start of the QRS complex is measured. For the differential threshold method, the point where the differential waveform of the T wave returns to the background noise level is identified as the T‐wave terminus, and its distance from the start of the QRS complex is measured. In the present study, we investigated the following: (1) the number of nonmeasurable values QT intervals per lead by the manual method and the sum of the corrected values, (2) the QT intervals obtained by the tangent and differential threshold methods as well as by automated and manual assessment, (3) the reasons for variability of the calculated values, and (4) the influence of the width of the tangential line on QT values obtained with the tangent method by both automatic and manual assessment. For comparison of data between groups, Student's paired t‐test was used and P < 0.05 was accepted as significant. Statistical analysis was done with mini‐statmate software (ATMS Co., Ltd., Tokyo, Japan). Continuous variables are expressed as mean ± standard deviation.
Figure 1.
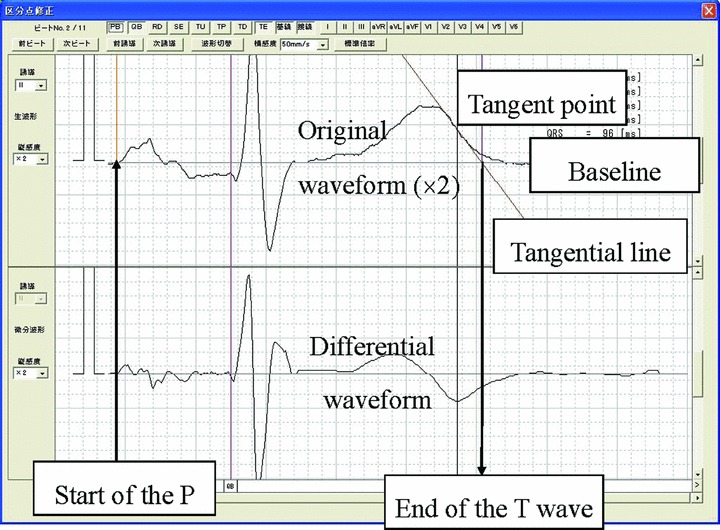
Measurement by the tangent method. In the tangent method, the maximum slope of the descending limb of the T wave is identified from the maximum negative value of the differentiated waveform. A tangent is drawn from that point, and the distance from the point where the tangent crosses the baseline to the start of the QRS complex is measured.
Figure 2.
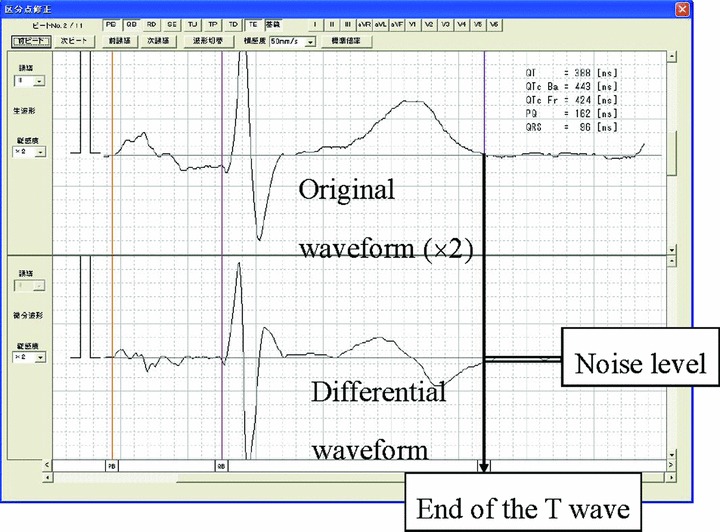
Measurement by the differential threshold method. For the differential threshold method, the point where the differential waveform of the T wave returns to the background noise level is identified as the T‐wave terminus, and its distance from the start of the QRS complex is measured.
RESULTS
Number of Nonmeasurable QT Intervals per Lead by the Manual Method, Sum of “Corrected Values”
The number of nonmeasurable QT intervals and the differences between automated and manual measurement were large for leads III, aVL, aVF, and V1 with both the tangent and differential threshold methods. On the other hand, the sum of the corrected values was lower for leads II and V3–V6 with the tangent method, while the sum of the corrected values was larger for all leads with the differential threshold method (Fig. 3).
Figure 3.
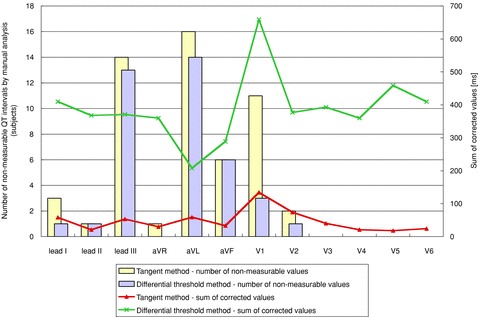
Number of nonmeasurable QT intervals per lead and sum of the “corrected values.” The “corrected values” of the QT interval were provided as the difference between automated and manual QT interval.
Measurement of the QT Interval by Various Methods
Comparison of the QT intervals of all subjects has been shown in Figure 4. QT intervals obtained by the tangent method were shorter than those obtained by the differential threshold method with both automated and manual measurement. When the corrections made by the readers were compared, there were smaller corrections with the tangent method than the differential threshold method. QT intervals obtained by the differential threshold method were more similar to the visual data than those obtained by the tangent method, but the extent of correction was larger.
Figure 4.
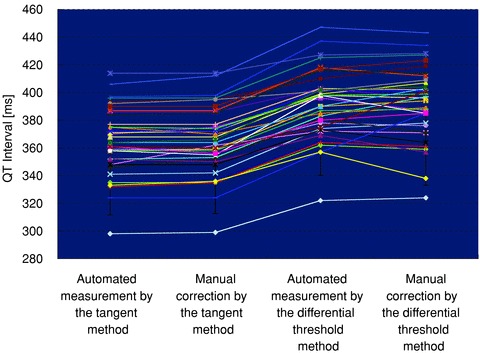
Compaison of the QT intervals of all subjects.
Comparison of the average QT intervals has been shown in Figure 5. When automated measurement was performed, the average QT interval was 364.2 ± 24.0 ms by the tangent method and 390.8 ± 25.0 ms by the differential threshold method, and the interval was significantly shorter with the former method (P < 0.001). With manual measurement, the average QT interval was 365.1 ± 24.0 ms by the tangent method and 391.5 ± 26.0 ms by the differential threshold method, and it was also significantly shorter with the former method (P < 0.001). Comparison of corrected values that mean the difference between the QT interval obtained by the automated and manual measurements has been shown in Figure 6. The average corrected values obtained by the automated and manual measurements was 1.8 ± 2.7 ms with the tangent method and 6.7 ± 6.5 ms with the differential threshold method, and it was significantly smaller with the former method (P < 0.001).
Figure 5.
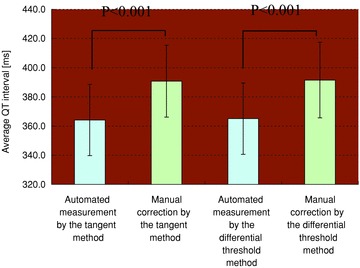
Comparison of the average QT intervals.
Figure 6.
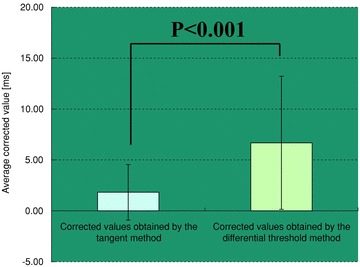
Comparison of the corrected values. The “corrected values” of the QT interval were provided as the difference between automated and manual QT interval.
Reasons for Variability of Measured Values
Representative examples are shown in Figures 7 and 8. Drift and skeletal muscle potential noise affected the baseline and the tangent with the tangent method, or affected the baseline and the T‐wave end point with the differential threshold method. In addition, low‐amplitude waveforms could lead to variation between automated and manual measurement, depending on the position of the tangent or to differences from visual data with the differential threshold method. The shape of the T wave was also important since this influenced recognition of the T‐wave end point. Variation in selecting the T‐wave end point and the size of the T wave resulted in greater variability of the tangent method, while the differential threshold method achieved values closer to those obtained by visual measurement.
Figure 7.
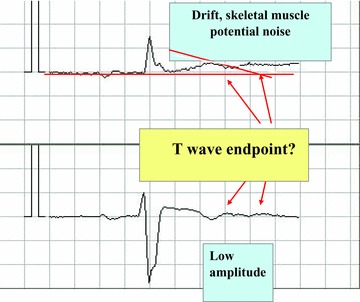
Causes of variability in measurement—drift, skeletal muscle potential noise, and low amplitude.
Figure 8.
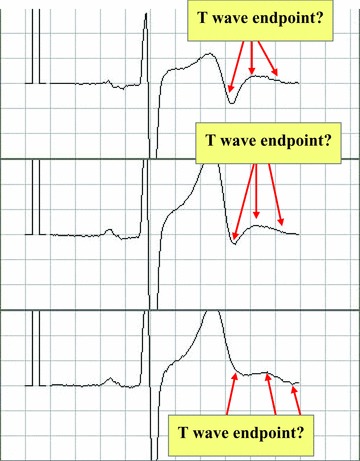
Causes of variability in measurement—T‐wave shape.
Width of the Tangent and QT Interval Obtained by Automated or Manual Measurement
The QT intervals measured by readers A and B were 370.6 ± 24.9 ms and 370.9 ± 25.4 ms, respectively. On the other hand, the QT intervals obtained by automated measurement varied as the width of the tangent was adjusted from ±10 ms to ±50 ms. The result was closest to manual measurement when the width was ±20 ms (371.1 ± 25.7 ms) and only this value showed no statistical difference from the manual values (Fig. 9).
Figure 9.
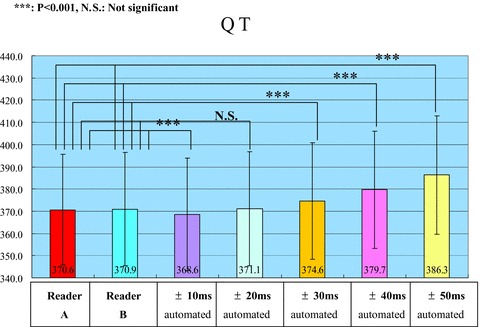
Tangent width and QT interval obtained by automated or manual measurement.
DISCUSSION
The ICH‐E14 Guideline 5 specifies a study in healthy volunteers for “thorough” investigation of the QT/QTc interval during early clinical development in order to examine whether there is a pharmacological threshold for an influence on ventricular depolarization. To achieve the required accuracy, the upper limit of the 95% confidence internal must be less than 10 ms. Accordingly, QT prolongation is judged as negative provided that the increase of the QT/QTc interval is 5 ms or less. In other words, the accuracy of QT interval measurement must be 5 ms or better, but it is difficult to achieve such accuracy with routine QT interval measurement. 6 , 7 The current ICH‐E14 Guideline also requests that detailed measurement of the QT/QTc interval should be performed by experienced readers with a high level of skill and sufficient training. Automated measurement using the software incorporated into many electrocardiographs is not acceptable as a substitute for manual assessment by a small number of experienced readers. However, semiautomatic measurement is acceptable if appropriate quality can be confirmed. In addition, it is stated that if the appropriateness of automated measurement can be proven, the guideline will be amended to incorporate such methods. In this regard, there have been several studies on the automatic QT interval algorithms that may prove to be more accurate and reliable method to measure the QT interval in the near future. 8 , 9 , 10 , 11 , 12 For example, the results of the recent studies focusing new automatic QT interval algorithms such as the vectorcardiography online automatic measurements or the QT sensor show the possibility of an accurate, efficient, and easily applied method to measure the QT interval. 9 , 12
Validation of Software for Automated QT/QTc Interval Measurement
The ICH‐E14 Guideline 5 recommends the following conditions for assessment of cardiotoxicity and QT/QTc interval analysis: (1) measurement by a few skilled readers, (2) digital processing of electrocardiographic data, (3) the electrocardiograms of each given patient should be assessed by the same reader, (4) blinding as to the time of recording, drug treatment, and patient identify, (5) determination of interreader and intrareader variability, (6) documentation of the precision and accuracy of the QT/QTc measurement system, and (7) setting criteria for electrocardiographic diagnosis and criteria for adverse events before the start of the study. We developed new software that allows detailed and objective measurement of the QT interval, and we compared automated and manual measurement by the tangent and differential threshold methods in the present study. The tangent method involves setting the T‐wave end point where a tangential line from the descending limb crosses the T‐wave baseline, while the differential threshold method is based on the first derivative of the electrocardiogram (ECG) waveform. The latter method is more precisely called the differentiated waveform threshold method. The present study demonstrated that the number of nonmeasurable QT intervals by manual assessment was larger in leads III, aVL, aVF, and V1 with both the tangent and differential threshold methods, while leads I and V3–V6 had fewer such intervals. In addition, the sum of the corrected values was large for all leads with the differential threshold method, while it was small for leads II and V3–V6 with the tangent method. According to the Guideline, lead II is preferred for QT/QTc measurement, and the present study also indicated the appropriateness of lead II. In the present study, the average QT interval was significantly shorter with the tangent method irrespective of whether automated or manual measurement was employed. It has been reported that the tangent method is influenced by the shape of the descending limb of the T wave. 10 , 11 This is because, if the steepest slope of the descending limb is near the top of the T wave, the point where the tangent crosses the baseline will be shifted forward and QT intervals measured by this method will be shorter than those measured by visual assessment. The present study was conducted in healthy volunteers, and the steepest slope of the descending limb was near the top of the T wave in the majority of them. On the other hand, when the corrections made by the readers were compared, there were smaller corrections with the tangent method than the differential threshold method. This suggests that although the tangent method yields shorter QT intervals compared with the differential threshold method, the variability of the data is relatively small. In fact, the difference of the QT interval between two independent readers with the tangent method was only 0.3 ± 0.5 ms, which was quite acceptable. On the other hand, the variability of the QT interval was compared among commonly used QT measurement algorithms in a recent study by Hunt. 10 Although a validated computer simulation was employed as a reference standard to assess the accuracy of automatic computer algorithms to measure the QT interval, both the tangent method and the differential threshold method demonstrated the highest variability because they were all functions of a differential operator with respect to time on a smoothed signal with residual noise. It is possible that the explanation for this discrepancy may, in part, be due to (1) expert manual measurement versus computer simulation as reference standard used, (2) the difference of width of the tangent (obtained by the least squares method) for the tangent method.
Concerning the causes of variability, drift and skeletal muscle potential noise have been shown to affect the baseline and tangent in the tangent method or the baseline and T‐wave end point in the differential threshold method. When the waveforms have a low amplitude, the way of drawing the tangent (tangent method) and differences from visual identification (differential threshold method) were likely to result in variation between automated and manual measurement. T‐wave morphology is also important, since the T‐wave end point is set as the point where the T wave finishes and the U wave commences. Gradual alteration of the T‐wave end point and the T‐wave height may result in larger variation with the tangent method, while the differential threshold method achieves T‐wave end points closer to those obtained by visual measurement under certain conditions. Among the causes of variability that have been reported 10 , 11 , the differential threshold method is less influenced by the baseline and threshold. However, it is affected by changes of the waveform. When the slope of the descending limb of the T wave is gentle, the variability of the differential threshold method increases. When the influence of the width of the tangent (obtained by the least squares method) in the tangent method was investigated for automated and manual measurement, the best fit was observed when the width of the tangent was set at ± 20 ms and the QT interval increased as the tangent became wider than ± 20 ms. This is presumably because a broader tangent line results in a gentler slope at the top of the T wave. In the current investigation, variability of the baseline and the starting point of the QRS complex were smaller compared with automated measurement than in previous studies. When the accuracy of QT intervals obtained by automated measurement was investigated previously 13 , the variability of the QT interval obtained by manual measurement by four cardiologists, who were experienced in measuring QT intervals, were smaller than the difference between automated and manual QT interval and it was concluded that automated measurement is not reliable. It was specifically noted that the differential threshold method was unreliable when the T wave had a low amplitude. Similar results have been shown in Charbit et al. 13 They reported that agreement between automatic and manual QT measurements was low when manual QTc measurement was employed as a reference standard in 108 patients after anesthesia. In the present study, the tangent method required fewer corrections of QT values with both automated and manual measurement, so it was considered to be more accurate than the threshold method and the differential method. In another study, automated measurement was supplemented by manual measurement and the combination was more reproducible and reliable compared with automated measurement alone. 14 The present study suggested that automated measurement by the tangent method could be used for thorough QT/QTc interval assessment due to the smaller interreader variability and good reproducibility of this method. Alternatively, the differential threshold method could be used because the results are similar to visual measurement. Correction should be performed by readers who are experienced at QT interval measurement. It is also important for the ECG to be recorded with minimum noise at an appropriate heart rate and with suitable leads for this purpose.
REFERENCES
- 1. Shah RR. Drugs, QTc interval prolongation and final ICH E14 guideline: An important milestone with challenges ahead. Drug Saf 2005;28:1009–1028. [DOI] [PubMed] [Google Scholar]
- 2. Shah RR, Hondeghem LM. Refining detection of drug‐induced proarrhythmia: QT interval and TRIaD. Heart Rhythm 2005;2:758–772. [DOI] [PubMed] [Google Scholar]
- 3. Haverkamp W, Breithardt G, Camm AJ, et al The potential for QT prolongation and proarrhythmia by non‐antiarrhythmic drugs: Clinical and regulatory implications. Report on a policy conference of the european society of cardiology. Eur Heart J 2000;21:1216–1231. [DOI] [PubMed] [Google Scholar]
- 4. ICH S7B . The non‐clinical evaluation of the potential for delayed ventricular repolarization (QT interval prolongation) by human pharmaceuticals. Step 4, 2005; 12 [PubMed] [Google Scholar]
- 5. ICH E14 . The clinical evaluation of QT/QTc interval prolongation and proarrhythmic potential for non‐antiarrhythmic drugs. Step 4, 2005; 12 [PubMed] [Google Scholar]
- 6. Kato T. How to evaluate drug related QT interval prolongation? Current practice and issues associated with QT interval measurements. Shinzo 2006;38:4–8. [Google Scholar]
- 7. Kato T. Electrocardiographic changes of QT prolongation syndrome. Jpn J Electrocardiol 2008;28(Suppl 2):5–19. [Google Scholar]
- 8. Badilini F, Vaglio M, Sarapa N. Automatic extraction of ECG strips from continuous 12‐lead Holter recordings for QT analysis at prescheduled versus optimized time points. Ann Noninvasive Electrocardiol 2009;14(Suppl 1): S22–S29. [DOI] [PMC free article] [PubMed] [Google Scholar]
- 9. Diamant UB, Windo A, Stattin EL, et al Two automatic QT algorithms compared with manual measurement in identification of long QT syndrome. J Electrocardiol 2010;43:25–30. [DOI] [PubMed] [Google Scholar]
- 10. Hunt AC. Accuracy of popular automatic QT interval algorithms assessed by a ‘gold standard’ and comparison with a novel method: Computer simulation study. BMC Cardiovasc Disord 2005;5:29–44. [DOI] [PMC free article] [PubMed] [Google Scholar]
- 11. Charbit B, Samain E, Merckx P, Funk‐Brentano C. QT interval measurement: Evaluation of automatic QTc measurement and new simple method to calculate and interpret corrected QT interval. Anesthesiology 2006;104:255–260. [DOI] [PubMed] [Google Scholar]
- 12. Ruiter JH, Barrett MJ, Weteling L, et al Malfunction of the automatic slope adjustment of the QT sensor in patients with normal QT intervals. Pacing Clin Electrophysiol 2004;27:405–407. [DOI] [PubMed] [Google Scholar]
- 13. McLaughlin NB, Campbell RW, Murray A. Comparison of automatic QT measurement techniques in the normal 12‐lead electrocardiogram. Br Heart J 1995;74:84–89. [DOI] [PMC free article] [PubMed] [Google Scholar]
- 14. Arita M, Saigawa A, Ono K. Diagnosis and Interpretation of QT Intervals. Tokyo , Igaku‐Shoin, 2007, pp. 101–102. [Google Scholar]


