

Abstract
Background
Maintenance of atrial fibrillation (AF) is related to atrial electrical inhomogeneity and resultant chaotic reentry. Our aim was to test the hypothesis that abnormalities of P morphology on the surface electrocardiogram (ECG) predict recurrent AF following electrical cardioversion (ECV).
Methods
A 12‐lead ECG was recorded after ECV for persistent AF in 77 patients (51 men, 65 ± 10 years) and repeated 1 month later. P‐wave duration was obtained in each lead using blinded on‐screen measurement. Maximum P‐wave duration (P‐max) was defined as the longest measurable P‐wave duration in any lead. P‐wave dispersion (PWd) was calculated as the maximum–minimum P‐wave duration.
Results
One month after ECV, 29 (38%) patients maintained sinus rhythm. Compared with the sinus rhythm group, those with recurrent AF had significantly greater PWd (66 ± 19 vs 57 ± 16 ms, P = 0.024) and included more patients with P‐max ≥142 ms (65% vs 38%, P = 0.023). Using a cutoff of ≥62 ms for PWd and ≥142 ms for P‐max, both indices had similar predictive value (sensitivity 66.7 and 64.6%, specificity 58.6 and 62.1%, respectively). In multiple regression analysis, including established clinical predictors, P‐max ≥142 ms was the only independent predictor of AF recurrence (P = 0.025).
Conclusion
A prolonged P‐wave duration measured by 12‐lead ECG predicts recurrent AF within 1 month after ECV.
Keywords: atrial fibrillation, electrical cardioversion, recurrence of atrial fibrillation, P wave, surface ECG, electrical dispersion
Atrial fibrillation (AF) is maintained by chaotic reentry.1, 2 Localized shortening of the refractory period, abnormal delay of conduction, and increased anisotropy3 all contribute to reentry. Electrical heterogeneity may be created by a variety of intra‐ and extracellular factors,4, 5 abnormal myocyte geometry or anatomic obstacles.6 These disturbances of intra‐ and interatrial conduction should be apparent on the surface electrocardiogram (ECG ) as an increase in the spatial dispersion of the timing of depolarization.7, 8
With careful attention to anticoagulation and technique, external electrical cardioversion (ECV) is a highly effective and safe method of restoring sinus rhythm in a patient with AF.9, 10 Unfortunately AF commonly recurs later. The duration of AF before ECV, advanced age, and left atrial diameter are established independent predictors of failure of ECV or AF relapse,11 but these indices are not very reliable. Additional predictors could allow the physician to plan more effective treatment, targeting the use of antiarrhythmic drugs or ablation to those at highest risk of recurrent AF.
We have previously demonstrated that prolonged atrial depolarization time, as detected on signal‐averaged ECG, predicts AF recurrence.12 The P‐wave duration in the 12‐lead ECG is an approximate measure of the atrial depolarization time. A prolonged P‐wave duration is known to correlate with delayed intraatrial and interatrial conduction.13 P‐wave dispersion (PWd), defined as the difference between the maximum and the minimum P‐wave duration from 12‐lead ECG, has been proposed as a marker of the inhomogeneity of atrial activation.14 We hypothesized that prolonged maximum P‐wave duration (P‐max) and increased PWd reflect the severity of electrophysiological disturbance in the atria and may therefore be used to predict recurrence of AF after ECV.
Measures of PWd give a simplified approximation of changes in the P‐wave loop, analogous to the interpretation of ventricular repolarization abnormalities by measuring QT dispersion. Signal‐averaged P‐wave duration had previously been demonstrated to predict early recurrence of AF after cardioversion in a small number of patients.15 However, the use of signal‐averaged P wave is not currently in routine use and the manual measurement of P‐max and PWd is the most practical way to perform exploratory investigations. The aims of our study were to assess and compare the value of the P‐max and PWd in predicting the early recurrence of AF after ECV and to document their correlation with other ECG parameters and clinical variables.
METHODS
Study Population
We screened all patients who underwent ECV for nonvalvular persistent AF at our institution over a 16‐month period. Seventy‐seven patients agreed to participate (51 men, mean age 65 ± 10 years) and were enrolled in this prospective study. All patients underwent transthoracic echocardiography immediately and 12‐lead ECG before ECV. All underwent repeat 12‐lead ECG at 1 month after cardioversion to determine whether AF had recurred.
Data Acquisition
A standard 12‐lead ECG was recorded using the MAC–VU electrocardiograph (GE Marquette Medical Systems, Milwaukee, WI, USA). The recording was performed in a supine position approximately 1 hour after successful ECV and repeated 1 month later to assess the outcome. All ECGs were sampled at 500 Hz with simultaneous 12‐lead recordings and digitized data were stored electronically for computerized analysis.
ECG Data Analysis
P‐Wave Duration
The digitally recorded signal of each ECG lead was displayed on a high‐resolution computer screen corresponding approximately to 150 mm/s and 60 mm/mV display. An author of this study (XHG) who was blinded to the outcomes of the subjects performed the ECG analysis prospectively. P‐wave duration was manually measured in all leads with digital calipers being used to mark the P‐wave onset and offset. Measured data were exported into a spreadsheet for further analysis.
Conventional ECG Indices
Heart rate and PR interval were automatically derived from each recording at a paper speed of 25mm/s using the research version of the QT Guard software package (Marquette Medical Systems).
Definition of Terms
Clinical Variables
AF duration was defined as the complete arrhythmia history commencing from first documentation of AF until the present ECV. In the patients with previously successful ECV, the periods of sustained sinus rhythm after ECV were deducted from the estimated AF duration. The left atrial diameter was measured echocardiographically from a parastenal long‐axis view. Left atrial dilatation was defined as the presence of a left atrial diameter greater than the 90th centile for the patients’ age and body mass. Information on the underlying disease and medication was obtained from patients’ medical records and if necessary by enquiry from the patient.
P‐Wave Indices
The following indices were determined for each ECG:
The onset of the P wave was defined as the junction between the isoelectric line and the beginning of the P‐wave deflection and the offset of P wave as the junction between the end of the P‐wave deflection and the isoelectric line. The P‐wave duration in each lead was calculated as the time from P‐wave onset to P‐wave offset in that lead.
The P‐max was defined as the longest P‐wave duration of all the measurable leads.
The minimum P‐wave duration (P‐min) was defined as the shortest P‐wave duration of all the measurable leads.
PWd was defined as the difference between P‐max and P‐min.
Statistical Analysis
Statistical analyses were performed using Student's 2‐tailed t‐test to compare the continuous and normally distributed variables between the two outcome groups. Comparisons between electrocardiographic P‐wave indices of these two study groups were made with Mann‐Whitney U test.
Frequencies were compared using the chi‐square test and Fisher's exact test for equality of proportions. To find independent predictors of recurrence of AF, a stepwise logistic regression procedure was performed. Multivariate analysis included the P‐wave indices with a P‐value <0.05 and clinical established predictors. To determine the prognostic value of each variable, odds ratio (OR) and its 95% confidence intervals (CI) are reported. The correlation between variables was assessed using Pearson's correlation coefficient. All results are expressed as mean ± SD, unless otherwise indicated. P‐values <0.05 were considered statistically significant. All analyses were performed using SPSS statistical software (SPSS version 10, SPSS Inc., Chicago, IL, USA).
RESULTS
Patient Characteristics and Recurrence of AF
At 1 month after ECV, 29 (38%) patients maintained sinus rhythm and 48 (62%) had returned to AF. There were no significant differences between the two groups in clinical variables such as age, gender, and AF duration, underlying disease or the use of cardioactive agents other than beta‐blockers (Table 1). No difference was seen between sinus rhythm and recurrent AF patients in left atrial diameter or in conventional ECG indices.
Table 1.
Comparison of Clinical Characteristics of Patients With and Without Recurrence of Atrial Fibrillation
| Sinus Rhythm, | Relapse to AF, | Odds Ratio | ||
|---|---|---|---|---|
| n = 29 (38%) | n = 48 (62%) | (95% CI) | P‐Value | |
| Age (years) | 63 ± 11 | 65 ± 9 | 1.02 (0.98–1.07) | 0.28 |
| Male, n (%) | 20 (70) | 31 (65) | 1.21 (0.45–3.26) | 0.69 |
| AF duration in months | 10 ± 11 | 10 ± 8 | 0.99 (0.95–1.04) | 0.86 |
| Underlying heart disease, n (%) a | ||||
| Coronary artery disease | 7 (24) | 14 (29) | 0.77 (0.26–2.21) | 0.63 |
| Systemic hypertension | 12 (41) | 21 (44) | 0.90 (0.35–2.30) | 0.83 |
| Cardiomyopathies | 2 (7) | 4 (8) | 0.81 (0.14–4.75) | 1.00 |
| “Lone” AF | 9 (31) | 11 (23) | 1.51 (0.53–4.26) | 0.43 |
| Alcohol abuse | 3 (10) | 6 (13) | 0.80 (0.18–3.51) | 1.00 |
| Thyrotoxicosis | 2 (7) | 4 (8) | 0.81 (0.14–4.75) | 1.00 |
| Medications during AF, n (%) a | ||||
| Digitalis monotherapy | 6 (21) | 13 (27) | 0.70 (0.23–2.11) | 0.52 |
| Class I (1c) | 2 (7) | 4 (8) | 0.81 (0.14–4.75) | 1.00 |
| Class II | 1 (3.4) | 12 (25) | 0.10 (0.01–0.87) | 0.03 |
| Class III | 13 (45) | 20 (42) | 1.13 (0.44–2.88) | 0.78 |
| Class IV | 7 (24) | 13 (27) | 0.85 (0.29–2.47) | 0.77 |
| Echocardiogram | ||||
| Left atrial diameter (mm) | 46 ± 6.1 | 47 ± 5.8 | 1.02 (0.94–1.10) | 0.56 |
| Electrocardiogram | ||||
| Heart rate (beats/minute) | 64 ± 9 | 62 ± 9 | 0.98 (0.93–1.03) | 0.52 |
| PR interval (ms) | 207 ± 60 | 220 ± 61 | 1.00 (0.99–1.01) | 0.38 |
Data are presented as mean value ± SD unless otherwise indicated as number (%).
AF = atrial fibrillation; CI = confidence interval.
The Predictive Value of PWd and P‐max
PWd was significantly greater in the recurrent AF than in the sinus rhythm group (66 ± 19 vs 57 ± 16 ms, P = 0.024). P‐max was prolonged in the recurrent AF group compared to sinus rhythm group (144 ± 20 vs 138 ± 19 ms, P = 0.08).
The dichotomy limits of PWd ≥62 ms and P‐max ≥142 ms were used to stratify the population (Fig. 1). Both indices provided reasonable separation between the sinus rhythm and recurrent AF groups, but combining the two indices did not remarkably improve the discrimination (PWd ≥62 ms: 41 vs 67%, P = 0.03; P‐max ≥142 ms: 38% vs 65%, P = 0.023; combination of PWd ≥62 ms and P‐max ≥142 ms: 31% vs 56%, P = 0.032, respectively). The indices showed a similar ability to predict AF recurrence (Fig. 2). However, stepwise logistic regression analysis of these three markers together with age, left atrial diameter, and AF duration showed that P‐max ≥142 ms was the only independent predictor of recurrent AF within 1 month after ECV in our patients (OR 0.33, 95% CI 0.13–0.87, P = 0.025).
Figure 1.
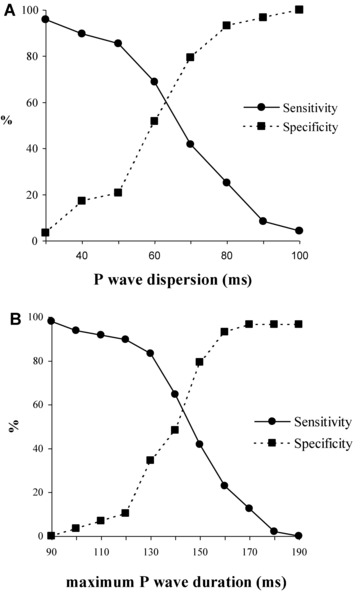
Sensitivity and specificity curves for P‐wave dispersion (A) and maximum P‐wave duration (B). A‐P‐wave dispersion value of 62 ms, for our population provided good sensitivity and specificity. For maximum P‐wave duration, the value of 142 ms provided good discrimination between those with AF recurrence and those without.
Figure 2.
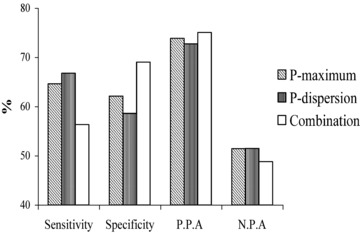
Predictive value of P‐wave dispersion ≥62 ms, maximum P‐wave duration ≥142 ms, and the combination of P‐wave dispersion ≥62 ms and maximum P‐wave duration ≥142 ms. The predictive value is presented as percentage of sensitivity, specificity, positive predictive accuracy (PPA), and negative predictive accuracy (NPA).
Correlation between PWd, P‐Max, and Other Variables
PWd ≥62 ms and P‐max ≥142 ms were not significantly related to underlying heart disease or traditional ECG indices. Although more patients with P‐max ≥142 ms used a class Ic antiarrhythmic agent (in all cases flecainide), exclusion of the 6 patients receiving this drug did not alter our finding that there were significantly more patients with P‐max ≥142 ms in the recurrent AF group than in sinus rhythm group (33% vs 61%, OR 3.17, 95% CI 1.16–8.67, P = 0.02). Subjects with PWd ≥62 ms were older on average (66 ± 10 vs 62 ± 11 years, P = 0.048), were more likely to have a dilated left atrium (64% vs 39%, P = 0.035) and more likely to have a prolonged P‐max (151 ± 15 vs 131 ± 21 ms, P < 0.001) but did not differ significantly in other clinical variables.
Increased PWd was weakly associated with age (r = 0.215, P = 0.028). The differences in PWd were greater at the extremes of age, with a sharp difference between the eldest quintile (aged >70 years) and the youngest two quintiles (aged <55 years old; 68 ± 18 vs 55 ± 19 ms, P = 0.037).
Patients with P‐max ≥142 ms had a significantly greater mean left atrial diameter and included a significantly higher percentage of patients with left atrial dilatation. Left atrial diameter as a parametric variable correlated significantly with P‐max (r = 0.305, P = 0.007). Neither New York Heart Association functional classes nor systolic fractional shortening predicted recurrent AF and neither was related to P‐max or to PWd. Neither PWd nor P‐max was correlated with AF duration.
CONCLUSIONS
Our study was designed to investigate the predictive value of two surface ECG indices of atrial electrical heterogeneity in predicting recurrences of AF following ECV. We have reported on a larger number of patients than most studies in this field of investigation.
An abnormally prolonged PWd (40 ms) has previously been reported to differentiate patients with lone paroxysmal AF from control subjects.14 Our findings extend this observation by showing that increased PWd identifies those at risk of recurrent AF within 1 month after ECV and contributes to the very limited available data on this population.16
It is well known that AF is more common in the elderly.17 In elderly patients with AF, the collagen content of the myocardium is increased.18 Dispersion of refractoriness is enlarged and impulse propagation fragmented. Dilatation as well as fibrosis of the atria increases with age.19 All of these structural changes promote slow and inhomogeneous atrial conduction and provide a substrate for AF. In our study, PWd increased with age. Recurrent AF patients who had an increased PWd tended to be older, and had greater left atrial diameter and P‐max compared with those who had a PWd <62 ms.
Our findings suggest a link between atrial conduction abnormality and recurrent AF. PWd appears to be a crude indicator of general atrial conduction abnormalities, and should currently be included in the assessment of the P wave. Raitt et al. have previously shown that other markers such as P‐wave signal averaging also demonstrate some promise as indicators of delayed atrial conduction in specific populations.15 Our data, albeit using different measures of atrial electrical heterogeneity, support this work suggesting that greater predictive value should be attributed to P‐wave analysis. To date, P‐wave signal averaging has received less attention than signal averaging of the QRS complex. The measurement and use of atrial electrical heterogeneity indices have not yet reached full maturity and other methods, such as signal average PWd, are likely to emerge that will supersede those used in our study.
Our study identified P‐max as an independent predictor of early recurrent AF following ECV and showed that it correlated moderately well with left atrial diameter. This is in keeping with the results of previous studies and with theoretical considerations. The capability of the atria to support AF depends on their ability to contain a stable population of wavelets of depolarization. Either dilatation of the atria, slowing of intra‐ and interatrial conduction, or some combination of these is needed to allow AF to be persistent. Both dilatation of the atria and slowing of conduction should result in prolongation of the P‐wave duration. P‐max should therefore contain more information on the vulnerability to AF than any single measurement of atrial anatomy or conduction velocity.
It has been reported14 that P‐max is a marker of prolonged intra‐ and interatrial conduction time and PWd is a marker of anisotropic or inhomogeneous atrial conduction. The authors reported that PWd complemented the P‐max for clearer separation between patients with paroxysmal idiopathic AF and normal controls. In our study, the combination of P‐max ≥142 ms and PWd ≥62 ms did not improve the predictive value for early recurrence of AF. This may be because of differing study populations or measurement methods. The principle difference is that our studied population consists of patients with persistent AF, whereas the previous data investigated pertain to a population with paroxysmal AF.14 It may be that inhomogeneous conduction, reflected in PWd, is an important contributor to AF onset and is therefore often increased in those with recurrent short episodes of AF. The persistence of AF is more associated with prolonged intra‐ and inter‐atrial conduction time, so that in our population the importance of P‐max overwhelms that of PWd.
The use of beta‐adrenergic receptor antagonists was weakly associated with a higher risk of AF recurrence in our population. Exclusion of the 13 patients receiving these drugs did not alter our finding that there still were significantly more patients with P‐max ≥142 ms (64% vs 39%, P = 0.05) and PWd ≥62 ms (69% vs 43%, P = 0.033) in the recurrent AF group than in sinus rhythm group.
Limitations of the Study
Our results depend to some extent on the precision of the P‐wave measurement. As all measurements were made by a single experienced operator, we were not able to examine the interobserver reproducibility of PWd. Previous work by Dilaveris et al. suggests that our methods of measurement offer stable results.20 However, the automated analysis of P‐wave duration and morphology suggested by Holmqvist is likely to offer a greater degree of precision and reproducibility.21 While our study provides useful pilot information, we cannot yet recommend the measurement of PWd for routine clinical practice.
Acknowledgments
The authors would like to acknowledge the kind help received from Dr. Jan Poloniecki, St George's Hospital Medical School, for his advice with the statistical analysis. We thank Anne Bradford, RN; Lisa Luddington, RN; and Monica Harries, RN, St George's Hospital Medical School, for the assistance in collection of data.
This work was supported in part by the British Heart Foundation Project Grant PG/97177, London, United Kingdom, and the Overseas Research Students Awards Scheme, London, United Kingdom.
REFERENCES
- 1. Moe GK. On the multiple wavelet hypothesis of atrial fibrillation. Arch Int Pharmacodyn Ther 1962;140:183–188. [Google Scholar]
- 2. Allessie MA, Lammers WJEP, Bonke FIM, et al. Experimental evaluation of Moe's multiple wavelet hypothesis of atrial fibrillation In Zipes DP. (ed.): Cardiac Electrophysiology and Arrhythmias. New York, Grune & Stratton, 1985, pp. 265–2756. [Google Scholar]
- 3. Haft JI, Lau SH, Stein E, et al. Atrial fibrillation produced by atrial stimulation. Circulation 1968;37:70–74. [DOI] [PubMed] [Google Scholar]
- 4. Spach MS, Miller WT, Geselowitz DB, et al. The discontinuous nature of propagation in normal canine cardiac muscle: Evidence for recurrent discontinuities of intracellular resistance that affect the membrane currents. Circ Res 1981;48:39–54. [DOI] [PubMed] [Google Scholar]
- 5. Gallagher MM, Obel OA, Camm AJ. Tachycardia induced atrial myopathy: An important mechanism in the pathophysiology of atrial fibrillation? J Cardiovasc Electrophysiol 1997;8:1065–1074. [DOI] [PubMed] [Google Scholar]
- 6. Olgin JE, Kalman JM, Fitzpatrick AP, et al. Role of right atrial endocardial structures as barriers to conduction during human type I atrial flutter. Activation and entrainment mapping guided by intracardiac echocardiography. Circulation 1995;92:1839–1848. [DOI] [PubMed] [Google Scholar]
- 7. Zipes DP. Atrial fibrillation: From cell to bedside. J Cardiovasc Electrophysiol 1997;8:927–938. [DOI] [PubMed] [Google Scholar]
- 8. Misier AR, Opthof T, van Hemel NM, et al. Increased dispersion of “Refractoriness” in patients with idiopathic paroxysmal atrial fibrillation. J Am Coll Cardiol 1992;19:1531–1535. [DOI] [PubMed] [Google Scholar]
- 9. Gallagher MM, Hennessy BJ, Edvardsson N, et al. Embolic complications of direct current cardioversion: Association with low INR at the time of cardioversion. J Am Coll Cardiol 2002;40:926–933. [DOI] [PubMed] [Google Scholar]
- 10. Gallagher MM, Yap YG, Padula M, et al. Arrhythmic complications of electrical cardioversion: Relationship to shock energy. Int J Cardiol 2008;123:307–312. [DOI] [PubMed] [Google Scholar]
- 11. Arner DO, Danielsen R. Factors predicting maintenance of sinus rhythm after direct current cardioversion of atrial fibrillation and flutter: A reanalysis with recently acquired data. Cardiology 1996;87:181–188. [DOI] [PubMed] [Google Scholar]
- 12. Guo XH, Gallagher MM, Poloniecki J, et al. Prognostic significance of serial P wave signal‐averaged electrocardiograms following external electrical cardioversion for persistent atrial fibrillation: A prospective study. Pacing Clin Electrophysiol 2003;26:299–304. [DOI] [PubMed] [Google Scholar]
- 13. Tanigawa M, Fukatani M, Konoe A, et al. Prolonged and fractionated right atrial electrograms during sinus rhythm in patients with paroxysmal atrial fibrillation and sick sinus node syndrome. J Am Coll Cardiol 1991;17:403–408. [DOI] [PubMed] [Google Scholar]
- 14. Dilaveris PE, Gialafos EJ, Sideris SK, et al. Simple electrocardiographic markers for the prediction of paroxysmal idiopathic atrial fibrillation. Am Heart J 1998;135:733–738. [DOI] [PubMed] [Google Scholar]
- 15. Raitt MH, Ingram KD, Thurman SM. Signal‐averaged P wave duration predicts early recurrence of atrial fibrillation after cardioversion. Pacing Clin Electrophysiol 2000;23(2):259–265. [DOI] [PubMed] [Google Scholar]
- 16. Başar N, Malçok Gürel O, Ozcan F, et al. Diagnostic accuracy of P‐wave dispersion in prediction of maintenance of sinus rhythm after external cardioversion of atrial fibrillation. Anadolu Kardiyol Derg 2011;11(1):34–38. [DOI] [PubMed] [Google Scholar]
- 17. Feinberg WM, Blackshear JL, Laupacis A, et al. Prevalence, age distribution, and gender of patients with atrial fibrillation. Analysis and implications. Arch Intern Med 1995;155:469–473. [PubMed] [Google Scholar]
- 18. Spach MS, Dolber PC. Relating extracellular potentials and their derivatives to anisotropic propagation at a microscopic level in human cardiac muscle. Evidence for electrical uncoupling of side‐to‐side fiber connections with increasing age. Circ Res 1986;58:356–371. [DOI] [PubMed] [Google Scholar]
- 19. Davies MJ, Pomerance A. Pathology of atrial fibrillation in man. Br Heart J 1972;34:520–525. [DOI] [PMC free article] [PubMed] [Google Scholar]
- 20. Dilaveris P, Batchvarov V, Gialafos J, et al. Comparison of different methods for manual P wave duration measurement in 12‐lead electrocardiogram. Pacing Clin Electrophysiol 1999;22:1532–1538. [DOI] [PubMed] [Google Scholar]
- 21. Holmqvist F, Platonov PG, Havmöller R, et al. Signal‐averaged P wave analysis for delineation of interatrial conduction—further validation of the method. BMC Cardiovasc Disord 2007;7:29. [DOI] [PMC free article] [PubMed] [Google Scholar]