

Abstract
Background
There is limited data describing ST segment amplitude in apparently healthy, asymptomatic populations. We analyzed ST amplitude in the standard resting electrocardiogram (ECG) in a large, multiethnic, stable, clinical population.
Methods
We evaluated computerized ST amplitude measurements from the resting ECGs of 29,281 ambulatory outpatients collected between 1987 and 1999 at the Palo Alto, VA. With the PR interval as the isoelectric line, both elevation criteria (≥0.1 mV, ≥0.15 mV, and ≥0.2 mV) and depression criteria (≤–0.05 mV or ≤–0.1 mV), were applied. Cox–Hazard survival analysis techniques were used to demonstrate in which leads ST amplitude displacement was associated with cardiovascular (CV) death. To create a cohort without ECG patterns clearly associated with disease, we excluded ECGs with inverted T waves, wide QRS, or diagnostic Q waves and coded the remaining “normal” ECGs for ST elevation and depression to determine a normal range.
Results
The only ST amplitudes that were significantly and independently associated with time to CV death when adjusted for age, gender, and ethnicity were ST depression in all of the lateral leads (I, V4–V6). When isolated to the inferior leads, (II and AVF), no ST amplitude criteria were associated with CV death. Among the “normal ECG” subgroup the precordial leads exhibited the greatest median ST amplitudes and the most significant differences between the leads, genders and ethnicities.
Conclusions
Significant differences in ST amplitude were present in the precordial leads according to gender and ethnicity. This was particularly apparent when amplitude threshold were set for comparisons. Our findings provide the normal range for ST amplitude that when exceeded, should raise clinical concern.
Keywords: electrocardiography, ST segment, ST depression, ST elevation, early repolarization, prognosis
The level of the ST segment continues to have clinical importance that cannot be replaced by advances in cardiac imaging. This importance is due to its relationship to the causes and treatment of chest pain, association with channelopathies, and as part of the pattern of early repolarization. Surprisingly, there is limited data describing ST amplitudes using computerized measurements in clinically stable populations.
In asymptomatic, ambulatory patients, ST elevation is mainly physiological, due to vagal tone while ST depression is associated with myocardial stress and ischemia due to micro‐ or macrovascular disease. However, previous studies have not identified in which electrocardiogram (ECG) leads ST shifts are most predictive of cardiovascular (CV) disease. MacFarlane has presented the most comprehensive demonstration of the normal levels of ST elevation and depression available. He stressed that age and gender account for considerable variability in ST amplitudes in an Asian and Scottish community.1 He pointed out the clinical implications of this variability as acute coronary syndrome (ACS) decision‐making focuses on ST elevation, and that without a better understanding of the normal ECG and its variations, false positives would certainly be more likely.
Furthermore, the two different distinct physiological and pathophysiological conditions involved have not been considered. Given this relative paucity of data regarding ST elevation and depression in medically stable outpatient populations, and the routine application of ST criteria for acute myocardial infarction (AMI) and acute coronary syndrome (ACS),2 we analyzed ST amplitude in the standard resting ECG in a large multi‐ethnic stable clinical population. Since the usual statistical techniques do not apply to setting thresholds for “normal values” for ST levels since presenting on either side of the isoelectric line represents distinct phenomena and the displacement is non‐Gaussian, clinically relevant values as thresholds were applied. We present a unique demonstration of how gender and ethnicity affect resting ST levels in apparently healthy patients and the spectrum of normal ST amplitudes.
METHODS
Clinical Population
We performed a retrospective study of 45,829 recorded ECGs between March 1987 and December 1999 at the Veterans Affairs Palo Alto Health Care System. Since 1987, the Veterans Affairs Palo Alto Health Care System has used a centralized computerized ECG system for collection, storage, and analysis of ECGs (GE Healthcare, Wauwatosa, WI, USA). This system has been approved by the United States Food and Drug Administration and the European Union, and is widely used around the world. Electrocardiograms were ordered by health care providers for clinical indications that included screening when first initiating care at the Veterans Affairs. Race was determined by self‐report at the time of ECG acquisition. We considered the first ECG and excluded ECGs with one or more of the following findings: inpatient status (n = 12,319), atrial fibrillation or flutter (n = 1253), ventricular rates greater than 100 beats per minute (n = 2799), QRS durations greater than 120 milliseconds (n = 3141), paced rhythms (n = 290), ventricular pre‐excitation (n = 42), and AMI (n = 29), leaving 29,281 patients. For demonstration of normal ST levels a “normal ECG” subgroup was formed by excluding participants with ECGs with inverted T waves in any of leads I, II, aVL, aVF, leads V2–V6, or diagnostic Q waves in order to remove any ECG patterns diagnostic of pathological conditions. This subgroup consisted of 16,383 participants (87% male, 17% African American; mean age, 45 ± 12 years).
Electrocardiogram Analysis
ECGs measurements were made by the 12‐SL software (General Electric Healthcare) and over read by an experienced electrocardiographer. With the PR interval as the isoelectric line and ST amplitude measured at the end of the QRS complex, ST amplitude was categorized as ≥0.1 mV, ≥0.15 mV, and ≥0.2 mV for ST elevation and ≤–0.05 mV or ≤–0.1 mV for ST depression. The areas of displacement were grouped as lateral (limb lead 1, V4–V6), anterior (V1–V3) and inferior (limb leads II and aVF). The computer measured criteria were set at –0.045, –0.95, 0.95, 0.145, and 0.19 mV to make them more comparable to visual reading which is influenced by the human tendency to measure to the closest grid line.
Outcomes
The primary outcome variable was time to CV mortality. The California Health Department Service and Social Security Death Indices were used to ascertain the vital status of each patient as on December 31, 2002. Accuracy of causes of deaths was confirmed using the Veterans Affairs computerized medical records by two physicians blinded to the ECG results.
Statistical Analysis
NCSS software 2007 (NCSS, Kaysville, UT, USA) was used for all statistical analyses. Unpaired t‐tests were used for comparisons of continuous variables, and chi‐square tests were used to compare dichotomous and categorical variables. Continuous variables are reported as mean ± standard deviation while ST measurements were presented as medians and 95th percentiles. Survival analysis was performed using the method of Kaplan and Meier, and Cox proportional. We used Cox proportional hazards ratios to determine associations between ST amplitude patterns and outcomes. Analyses were adjusted for age, ethnicity, and gender. The proportional hazards assumption was confirmed. Once hazard was demonstrated for an area of ST displacement, the individual leads were explored with similar analyses.
RESULTS
Of the initial 29,281 veteran outpatient ECGs, 16,383 ECGs were further included in the “normal ECG” subgroup and a comparison of the demographics is shown in Table 1. As expected, the “normal ECG” subgroup was younger and had lower annual CV mortality (0.9% vs 0.3%, P < 0.001). The normal ECG subgroup has more African Americans (both males and females) than the total population but the vast majority of patients in both groups were still non–African‐American (87% and 73% for total and normal ECG groups, respectively) which reflects the VA population at time of enrollment.
Table 1.
Demographics of the Total Population and the Normal ECG Subgroup
| Total Population | “Normal ECG” Group | P Value | |
|---|---|---|---|
| Population size | 29,281 | 16,383 | |
| Mean age (years) | 56.7 ± 14.7 | 45.5 ± 9.75 | <0.01 |
| Average height (in.) | 68.5 ± 3.7 | 68.9 ± 3.7 | <0.01 |
| Average weight (lb) | 182.7 ± 40.3 | 185.3 ± 40.6 | <0.01 |
| Average BMI | 27.3 ± 5.5 | 27.4 ± 5.6 | 0.06 |
| AA (%) | 3885 (13.3%) | 2850 (17.4%) | <0.01 |
| Non‐AA (%) | 25, 296 (86.7%) | 11,891 (72.6%) | <0.01 |
| Male (%) | 25,544 (87.2%) | 14,225 (86.6%) | 0.74 |
| Male AA (%) | 3554 (12.1%) | 2592 (15.8%) | <0.01 |
| Male non‐AA (%) | 21, 990 (75.1%) | 11,633 (71.0%) | <0.01 |
| Female (%) | 3737 (12.8%) | 2158 (13.2%) | 0.27 |
| Female AA (%) | 331 (1.1%) | 258 (1.6%) | <0.01 |
| Female non‐AA (%) | 3406 (11.6%) | 1900 (11.6%) | 0.92 |
| Cardiac‐related deaths (%) | 1995 (6.8%) | 348 (2.1%) | <0.01 |
| Annual CV mortality | 0.87% | 0.27% | <0.01 |
AA = African American; CV = cardiovascular. This table compares the normal ECG recordings to the ECG recordings of the total population. The normal ECG group has more African American patients, fewer cardiac‐related deaths, and a lower annual CV mortality.
Table 2 presents the prevalence of ST displacement detected in each lead in the total population, and compares these findings according to gender and ethnicity. ST segment elevation ≥0.1 mV in males was most commonly seen in precordial leads V2, V3, and V4. African American males had a higher proportion of ST elevation in these three leads as compared to the overall population. However, <5% of women had ST elevation of 1 mV in any of the precordial leads. African American females showed higher rates of ST elevation in lead V3 as compared to all females (39% vs 1.7%, respectively), but little ST elevation in any other lead.
Table 2.
Prevalence of Patterns of ST Displacement in the Total Population
| STV1 | STV2 | STV3 | STV4 | STV5 | ||||||||||||
|---|---|---|---|---|---|---|---|---|---|---|---|---|---|---|---|---|
| N (%) | N (%) | N (%) | N (%) | N (%) | N (%) | N (%) | N (%) | N (%) | N (%) | |||||||
| n | Median | >95 μV | <–45 μV | Median | >95 μV | <–45 μV | Median | >95 μV | <–45 μV | Median | >95 μV | <–45 μV | Median | >95 μV | <–45 μV | |
| Males (all) | 25544 | 9 | 581 (2.3%) | 990 (3.9%) | 29 | 3133 (12.3%) | 1348 (5.3%) | 19 | 2448 (9.6%) | 2019 (7.9%) | 4 | 1461 (5.7%) | 2716 (10.6%) | 4 | 632 (2.5%) | 2190 (8.6%) |
| Males (AA) | 3554 | 14 | 170 (4.8%) | 142 (4%) | 58 | 952 (26.8%) | 87 (2.4%) | 53 | 933 (26.3%) | 114 (3.2%) | 34 | 629 (17.7%) | 183 (5.1%) | 24 | 271 (7.6%) | 173 (4.9%) |
| Females (all) | 3737 | –5 | 23 (0.62%) | 229 (6.1%) | 4 | 122 (3.3%) | 378 (10.1%) | –5 | 65 (1.7%) | 564 (15.1%) | –5 | 42 (1.1%) | 478 (12.8%) | 0 | 17 (0.5%) | 271 (7.3%) |
| Females (AA) | 331 | –10 | 1 (0.3%) | 35 (10.6%) | 9 | 12 (3.6%) | 25 (7.6%) | 9 | 13 (39.3%) | 27 (8.1%) | 14 | 10 (3 %) | 18 (5.4%) | 19 | 1 (0.3%) | 12 (3.6%) |
| STV6 | LL1 | LL2 | avF | |||||||||||||
| N (%) | N (%) | N (%) | N (%) | N (%) | N (%) | N (%) | N (%) | |||||||||
| n | Median | >95 μV | <–45 μV | Median | >95 μV | <–45 μV | Median | >95 μV | <–45 μV | Median | >95 μV | <–45 μV | ||||
| Males (all) | 25544 | 9 | 249 (1.0%) | 1181 (4.6%) | 9 | 67 (0.3%) | 425 (1.7%) | 14 | 461 (1.8%) | 1244 (4.9%) | 9 | 287 (1.1%) | 1398 (5.5%) | |||
| Males (AA) | 3554 | 19 | 86 (2.4%) | 123 (3.5%) | 19 | 24 (0.7%) | 28 (0.79%) | 19 | 131 (3.7%) | 201(7.9%) | 9 | 63 (1.8%) | 300 (8.4%) | |||
| Females (all) | 3737 | 9 | 8 (0.2%) | 118 (3.2%) | 9 | 7 (0.2%) | 57 (1.5%) | 14 | 33 (0.9%) | 125 (3.3%) | 9 | 23 (0.6%) | 155 (4.1%) | |||
| Females (AA) | 331 | 19 | 1 (0.3%) | 8 (2.4%) | 19 | 2 (0.6%) | 3 (0.9%) | 24 | 4 (1.2%) | 11 (3.3%) | 9 | 3 (0.9%) | 16 (4.8%) | |||
STV1–6 = ST amplitude in precordial leads, >95 = greater than 95 microvolts equivalent to visual interpretation of 1 mm or more of ST elevation, <45 = less than 45 microvolts equivalent to visual interpretation of 0.5 mm or more depression, LL1–2 = limb leads I or II. This table shows the prevalence of ST displacement in each lead in the total population, stratified by gender and ethnicity.
Table 3 presents the results of the Cox–Hazard multivariate survival analysis of the major ST displacement criteria adjusted for age, gender, and ethnicity. Because of the interaction of ST depression in the three areas, ST depression was coded when isolated to the area with ST depression (i.e., “lateral lead only” means no ST depression in the anterior or inferior leads and so forth). The only patterns independently and significantly associated with the time to CV death were lateral elevation (RR = 0.7, P = 0.003, i.e., lowered risk) while only lateral depression (RR = 1.6, P < 0.001) was associated with increased risk. While the hazard ratio was modest for lateral depression (with or without depression in the lateral or anterior leads), the most prevalent pattern, it increased appropriately when the threshold was adjusted toward greater displacement: <–0.1 mV depression in the lateral leads exhibited a RR of 3.0, <–0.15 mV a RR of 4.5 (P < 0.001). Neither ST elevation nor depression in the inferior leads was associated with risk. When the individual leads involved with risk were explored using Kaplan–Meier curves and Cox–Hazard techniques, the risk with lateral depression was consistent across all four leads (limb lead I, V4, V5, and V6).
Table 3.
Cox–Hazard Analysis Results for Total Population (Age, Gender, and Ethnicity Adjusted)
| Adjusted | 95% Confidence | |||
|---|---|---|---|---|
| Pattern | N (%) | Relative Risk | Intervals | P Value |
| Lateral elevation | 1647 (5.6%) | 0.7 | 0.5–0.9 | 0.003 |
| Lateral depression only | 3169 (10.8%) | 1.6 | 1.4–1.7 | <0.001 |
| Anterior elevation | 4228 (14.4%) | 1.0 | 0.8–1.6 | 0.521 |
| Anterior depression only | 1806 (6.2%) | 1.0 | 0.8–1.3 | 0.787 |
| Inferior elevation | 537 (1.8%) | 1.3 | 0.9–2 | 0.194 |
| Inferior depression only | 1011 (3.5%) | 1.1 | 0.9–1.4 | 0.394 |
This table shows the Cox–Hazard multivariate analysis for regional ST displacement, adjusted for age, gender, and ethnicity. Lateral elevation was associated with decreased risk of cardiovascular death. Only lateral depression was independently associated with increased risk of cardiovascular death.
Table 4 presents the prevalence of ST displacement detected in each lead in a “normal ECG” subset population, again giving a comparison of results between gender and race. Similar to the larger population, the greatest percentage of males showing ST elevation occurs in the precordial leads of V2 (13.6%), V3 (12.9%), and V4 (8.6%) Again, in each of these three precordial leads, there is a significantly higher percentage of African American males showing ST elevation ≥0.1 mV when compared to the overall male population. There is also a higher percentage of African American males showing ST segment elevation in II (4.7%) and aVF (2.3%) when compared to the overall male population. Female ST segment elevation shows the greatest percentage in precordial leads V2, V3, and V4, consistent with results in the total population. Female African Americans in this “normal ECG” subset population show a higher percentage of ST segment elevation in leads V3 (3.9%) and V4 (3.5%) when compared to the overall female population. ST segment depression <–0.5 mV is most commonly appears in leads V1–V5, II, and aVF in males. In leads V1 and aVF, a larger proportion of African American males show ST depression when compared to the overall population of males. Females show greatest percentage of ST segment depression in leads V2 (9%), V3 (11.3%), and V4 (7.8%). However, African American females show higher levels of ST segment depression in leads V1 (10.1%), II (2.7%), and aVF (3.9%) when compared to the overall female population.
Table 4.
Prevalence of Patterns of ST Displacement in the “Normal ECG” Subpopulation
| STV1 | STV2 | STV3 | STV4 | STV5 | ||||||||||||
|---|---|---|---|---|---|---|---|---|---|---|---|---|---|---|---|---|
| N (%) | N (%) | N (%) | N (%) | N (%) | N (%) | N (%) | N (%) | N (%) | N (%) | |||||||
| n | Median | >95 μV | <–45 μV | Median | >95 μV | <–45 μV | Median | >95μV | <–45 μV | Median | >95 μV | <–45 μV | Median | >95 μV | <–45 μV | |
| Males (all) | 14225 | 9 | 213 (1.5%) | 524 (3.7%) | 34 | 1932 (13.6%) | 455 (3.2%) | 29 | 1830 (12.9%) | 469 (3.3%) | 19 | 1225 (8.6%) | 514 (3.6%) | 14 | 549 (3.9%) | 315 (2.2%) |
| Males (African American) | 2592 | 14 | 96 (3.7%) | 104 (4.0%) | 58 | 700 (27.0%) | 52 (2.0%) | 63 | 766 (29.6%) | 39 (1.5%) | 48 | 563 (21.7%) | 52 (2.0%) | 34 | 247 (9.5%) | 33 (1.3%) |
| Females (all) | 2158 | –5 | 7 (0.3%) | 129 (6.0%) | 4 | 60 (2.8%) | 194 (9.0%) | 0 | 40 (1.9%) | 243 (11.3%) | 0 | 32 (1.5%) | 169 (7.8%) | 4 | 11 (0.5%) | 83 (3.8%) |
| Females (African American) | 258 | –10 | 0 (0.0%) | 26 (10.1%) | 9 | 5 (1.9%) | 17 (6.6%) | 14 | 10 (3.9%) | 18 (7.0%) | 19 | 9 (3.5%) | 12 (4.7%) | 19 | 1 (0.4%) | 5 (1.9%) |
| STV6 | LL1 | LL2 | avF | ||||||||||
| N (%) | N (%) | N (%) | N (%) | N (%) | N (%) | N (%) | N (%) | ||||||
| n | Median | >95 μV | <–45 μV | Median | >95 μV | <–45 μV | Median | >95 μV | <–45 μV | Median | >95 μV | <–45 μV | |
| Males (all) | 14225 | 14 | 206 (1.4%) | 120 (0.8%) | 14 | 43 (0.3%) | 55 (0.4%) | 24 | 380 (2.7%) | 335 (2.4%) | 14 | 206 (1.4%) | 506 (3.5%) |
| Males (African American) | 2592 | 29 | 79 (3.0%) | 17 (0.7%) | 24 | 16 (0.6%) | 7 (0.3%) | 29 | 123 (4.7%) | 71 (2.7%) | 14 | 59 (2.3%) | 135 (5.2%) |
| Females (all) | 2158 | 9 | 5 (0.2%) | 23 (1.1%) | 9 | 3 (0.1%) | 15 (0.7%) | 19 | 23 (1.1%) | 41 (1.9%) | 9 | 15 (0.7%) | 58 (2.7%) |
| Females (African American) | 258 | 24 | 1 (0.4%) | 2 (0.8%) | 24 | 2 (0.8%) | 2 (0.8%) | 24 | 3 (1.2%) | 7 (2.7%) | 14 | 3 (1.2%) | 10 (3.9%) |
STV1–6 = ST amplitude in precordial leads, >95 = greater than 95 microvolts equivalent to visual interpretation of 1 mm or more of ST elevation, <45 = less than 45 microvolts equivalent to visual interpretation of 0.5 mm or more depression, LL1–2 = limb leads one or two. This table shows the prevalence of ST displacement in the normal ECG group, by individual lead. Comparisons are made between gender and ethnicity.
Figure 1 shows the median ST amplitudes for the normal ECG group. ST segment amplitude medians are positive in African American males in every lead and in general, higher than males overall. Females have less positive ST amplitudes in leads V1–V5, but leads V6, I, II, and aVF are more positive. African American females show positive ST medians in every lead except V1.
Figure 1.

Median ST amplitude in millivolts by gender and race.
Figure 2 shows the percentage of ST elevation with a threshold of 0.1 mV for each precordial lead and limb leads I, II, and aVF, according to gender and ethnicity in the normal ECG subgroup. African American males had more ST elevation in every lead except I, as compared to non–African American males. African American females had higher percentages of ST elevation in leads V3 and V4. In every lead except I, males had higher percentages of ST elevation than females.
Figure 2.

Prevalence of ST segment elevation ≥0.1 mV, separated by gender and race.
Figure 3 shows the percentage of ST elevation with a higher threshold of 0.15 mV according to gender and ethnicity. African American males showed higher percentages of ST elevation in V2, V3, and V4 as compared to other males or females. However, there was little ST elevation in any other lead for any ethnic or gender group. African American females did not have higher rates of ST elevation as compared to other females, in any lead.
Figure 3.

Prevalence of ST segment elevation ≥0.15 mV in each lead, separated by gender and race.
Figure 4 shows the percentage of ST elevation with a higher threshold of >0.2 mV according to gender and ethnicity. Results are similar to Figure 3. African American males showed higher percentages of ST elevation in V2, V3, and V4 as compared to other males or females. African American females did not have higher rates of ST elevation as compared to other females, in any lead.
Figure 4.
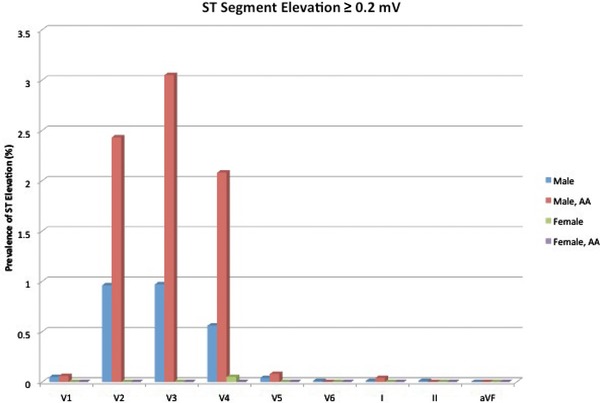
Prevalence of ST segment elevation ≥0.2 mV in each lead, separated by gender and race.
In Figure 5 , we see that females have more ST depression at a threshold of –0.05 mV than males in every precordial lead. African American females have more ST depression in V1 only. African American males have higher percentages of ST depression in aVF, but in all other leads have similar or decreased ST depression.
Figure 5.

Prevalence of ST segment depression ≤–0.05 mV in each lead, separated by gender and race.
Figure 6 shows the percentage of ST depression for each precordial lead and limb leads I, II, and aVF, according to gender and ethnicity in the normal ECG subgroup. At the threshold of –0.1 mV, African American males have a higher percentage of ST depression in leads V1, and V4–V6 as compared to all other males. African American females showed more ST depression in leads V2 and I, but otherwise had equal or lower percentages of depression in all other leads. Females had more ST depression than males in every precordial lead except V6.
Figure 6.

Prevalence of ST segment depression ≤–0.1 mV in each lead, separated by gender and race.
DISCUSSION
Measurement of ST segment amplitude is a critical part of resting ECG interpretation, especially when evaluating chest pain or a possible acute infarction and for the recognition of early repolarization and channelopathies. Furthermore, ST amplitude has been associated with CV events in population studies. While the serious implications of dynamic changes in ST amplitude are well accepted, the clinical application of initial or stable ST analysis could be facilitated by a better description of normal.
The Framingham study is one of many population studies demonstrating that stable, resting ST depression is associated with increased CV morbidity and mortality.3, 4, 5, 6, 7 ST elevation, on the other hand, has typically been associated with increased vagal tone and youth. Resting, stable ST elevation disappears with the administration of atropine.8 Another study of 1500 apparently healthy Dutch men also showed that ST elevation was associated with lower risk compared to isoelectric ST segments over 15 years of follow‐up.9
Surprisingly, none of the available studies has identified in which ECG leads ST shifts are most predictive of CV disease nor have they clarified issues regarding gender10 and ethnicity. Since it appears that women are more likely than men to have ECG abnormalities concerning for ischemia,11 a new definition of “normal resting ECG” by gender is needed. Similarly, African Americans are more likely to have ECG abnormalities compared to other ethnic groups and need “normal” to be defined.12
Previous work has established the importance of new ST segment changes in the acute setting and proposed thresholds for abnormal ST segment displacement. The joint ESC/ACC guidelines define ECG changes indicative of ischemia as ST segment elevation of ≥0.2 mV for men ≥40 years old (>0.25 mV for men <40 years old), or ≥0.15 mV for women in leads V2–V3, or ≥0.1 mV in any other leads. New ST depression >0.05 mV is also considered a sign of acute myocardial ischemia by these updated guidelines. Further study has suggested that ST elevation in V1 is associated with high‐risk patients with inferior myocardial infarction.13 ECG evaluation of the non‐ST elevation patient with ACS has also been investigated. Kaul et al showed that ST segment depression was the strongest predictor of mortality in non‐ST segment elevation ACS patients, and that a greater degree of ST depression (0.1 mV vs 0.2 mV) was predictive of worse outcomes.14 In the asymptomatic outpatient, however, there is less agreement on what constitutes normal variation in ST amplitudes and what is abnormal (and is associated with risk).
In our normal subgroup, men were shown to have more ST elevation as compared to women. This has also been noted previously, such as in MacFarlane's study in which he found that women had less ST elevation as compared to men, especially in the precordial leads. Among both genders, however, African American patients had more ST elevation. Women had higher percentages of ST depression than men, and that African American women had more ST segment depression as compared to other women. The normal ST segment amplitude, then, would be different for men and women, as well as for African American and non–African American patients. Table 1 demonstrates that ST elevation is much more prevalent in the precordial leads of ECGs of African American males.
From our analysis of the normal subgroup, we found that 21% of African American males have baseline ST elevation of ≥0.1 mV and that 8% of other men have ≥0.1 mV ST elevation, in lead V4. This means that in an ACS evaluation, their ECG would meet criteria for myocardial infarction. Four percent of African American women and 1% of all women would also exceed this threshold in V4. To address this high rate of ST elevation in V4, we suggest that lead V4 be subject to the higher threshold of ≥0.2 mV similar to leads V2 and V3.
Among women, 10% of African American and 11% of other women would meet ACS criteria for ST depression (>0.05 mV). A more comprehensive definition of normal ST amplitudes is needed to avoid an otherwise high false‐positive rate of ECG criteria for infarction. On the other hand, the gender‐specific threshold of 0.15 mV in the anterior leads (V2, V3) was very rarely seen in women (<1% in African American and other women). This suggests that the 0.15 mV threshold may be too high for screening purposes, and the guidelines may fail to identify women with active ischemia. We propose that the criteria could be lowered to >0.1 mV where still less than 2% of the women would be considered as possibly being ischemic.
When evaluating the MI/ACS ECG guideline of greater than 0.2 mV elevation in leads V2 and V3 for men, up to 3% of African American men and 1% of all other men fulfilled the criteria for ischemia. This threshold appropriately identifies only a small number of healthy subjects and seems to be an appropriate level of ST elevation for evaluation of new ischemia.
In addition to exploring the normal range of variation in ST amplitude, we also examined ECG patterns in ambulatory outpatients to determine which findings had prognostic implications. In stable, ambulatory patients, only ST depression in the lateral leads was independently associated with CV death: conversely, ST elevation or ST depression isolated to the other leads does not carry risk. Moreover, this association was much stronger according to the level of ST depression in the lateral leads. No association with risk was found in the inferior leads with either ST elevation or depression.
Study Limitations
These measurements of ST segment elevation and depression do not take into account the shape of the ST segment, which may alter risk. Furthermore, we do not correct for heart rate or QRS height. These factors are not accounted for the current ACS guidelines for ECG interpretation either. Our study population is mostly composed of middle‐aged, non–African American men. Nonetheless, this is a large group of patients that are frequently evaluated for CV disease. Special populations such as athletes, have a unique physiology and ECG findings that are not addressed in this study. In identifying ST amplitudes and association with risk, we did not specifically test for findings seen across contiguous leads. However, the ST depression or elevation criteria are not strictly required to be met in contiguous leads in the new ACS guidelines. Instead, “acute myocardial ischemia may create sufficient ST segment shift to meet the criteria in one lead but have slightly less than the required ST shift in an adjacent contiguous lead.”
Clinical Conclusions
There has been considerable attention paid to the screening ECG of asymptomatic adults in the outpatient setting and new methods of prognostication. Early repolarization, among other patterns, has particularly been of interest. However, we show here that age, gender, and ethnicity are important characteristics that cannot be ignored in the evaluation of the screening ECG. ST depression in the lateral leads are shown here to be associated with risk while ST depression isolated to the inferior leads had no prognostic value. A better understanding of what is considered normal according to key patient characteristics is needed to better interpret their ECG and determine who needs further investigation when an abnormal ECG is identified.
Although there are many components to the evaluation of chest pain, ECG interpretation remains a cornerstone of diagnostic interventions. In sub‐acute or out‐of‐hospital settings, the 12‐lead ECG is often available when cardiac enzymes are not. Furthermore, there are distinct patient populations who may have low levels of serum troponin in the absence of new ischemia (patients with chronic renal insufficiency, infiltrative cardiac disease, etc), making the evaluation of cardiac enzyme elevation more difficult. For these patients, ECG interpretation may be particularly important. Finally, the ECG may be particularly helpful for patients with atypical presentations of cardiac ischemia (women, the elderly, and patients with diabetes) who may not routinely have cardiac enzymes drawn as part of the initial work‐up. For the patient who does not have a prior ECG readily available, a clinician has to rely on the ACS guidelines to formulate management.
Here we suggest that in the evaluation of possible ACS, that lead V4 be treated as leads V2 and V3. Namely, we propose that the ST elevation threshold be raised to 0.2 mV instead of the current 0.1 mV. In the evaluation of women for ACS, we conclude that the threshold of 0.15 mV is too stringent and that elevation of 0.1 mV in V2 and V3 should be considered abnormal. In the evaluation of a screening ECG in the outpatient setting, ST depression in the lateral leads should be recognized as findings associated with increased risk of CV death. On the other hand, there were no patterns of ST elevation or depression isolated to the inferior leads that conferred risk in the screening, outpatient setting.
Financial disclosures: Dr. Froelicher is Co‐owner of Cardea Associates, Inc developers of hardware and software for screening for CV risk.
Support: None.
Disclaimer: The opinions expressed in this article do not necessarily represent the views or policies of the Department of Veterans Affairs.
REFERENCES
- 1. Macfarlane PW. Age, sex, and the ST amplitude in health and disease. J Electrocardiol 2001;34:235–241. [DOI] [PubMed] [Google Scholar]
- 2. Thygesen K, Alpert JS, Jaffe AS, et al. Joint ESC/ACCF/AHA/WHF task force for the universal definition of myocardial infarction. Eur Heart J 2012; 50(184):2173–2195. [Google Scholar]
- 3. Kannel WB, Anderson K, McGee DL, et al. Nonspecific electrocardiographic abnormality as a predictor of coronary heart disease: The Framingham Study. Am Heart J 1987;11:370–376. [DOI] [PubMed] [Google Scholar]
- 4. Daviglus ML, Liao Y, Greenland, P , et al. Association of nonspecific minor ST‐T abnormalities with cardiovascular mortality: The Chicago Western Electric Study. J Am Med Assoc 1999:1999;281:530–536. [DOI] [PubMed] [Google Scholar]
- 5. Rabkin SW, Mathewson FL, Tate RB. The electrocardiogram in apparently healthy men and the risk of sudden death. Br Heart J 1982;47:546–542. [DOI] [PMC free article] [PubMed] [Google Scholar]
- 6. Joy M, Trump DW. Significance of minor ST segment and T wave changes in the resting electrocardiogram of asymptomatic subjects. Br Heart J 1981;45:48–55. [DOI] [PMC free article] [PubMed] [Google Scholar]
- 7. Yano K, MacLean CJ. The incidence and prognosis of unrecognized myocardial infarction in the Honolulu, Hawaii Heart Program. Arch Intern Med 1989;149:1528–1532. [PubMed] [Google Scholar]
- 8. Lazzoli JK, Soares PP, da Nobraga AC, et al. Electrocardiographic criteria for vagotonia‐validation with pharmacological parasympathetic blockade in healthy subjects. Int J Cardiol 2003;87(2–3):231–236. [DOI] [PubMed] [Google Scholar]
- 9. Schouten EG, Dekker JM, Pool J, et al. Well shaped ST segment and risk of cardiovascular mortality. BMJ 1992;304:356–359. [DOI] [PMC free article] [PubMed] [Google Scholar]
- 10. Liao Y, Liu K, Dyer A, et al. Major and minor electrocardiographic abnormalities and risk of death from coronary heart disease, cardiovascular diseases and all causes in men and women. J Am Coll Cardiol 1988;12:1494–1500. [DOI] [PubMed] [Google Scholar]
- 11. De Bacquer D, De Backer G, Kornitzer M, et al. Prognostic value of ECG findings for total, cardiovascular disease, and coronary heart disease death in men and women. Heart 1998:80:570–577. [DOI] [PMC free article] [PubMed] [Google Scholar]
- 12. Prineas RJ, Le A, Soliman EZ, et al. United States national prevalence of electrocardiographic abnormalities in black and white middle‐age (45‐ to 64‐year) and older (≥65‐year) adults (from the Reasons for Geographic and Racial Differences in Stroke Study). Am J Cardiol 2012;109(8):1223–1228. [DOI] [PMC free article] [PubMed] [Google Scholar]
- 13. Wong CK, Gao W, Stewart RA, et al. Prognostic value in lead V1 ST elevation during acute inferior myocardial infarction. Circulation 2010;122:463–469. [DOI] [PubMed] [Google Scholar]
- 14. Kaul P, Fu Y, Chang WC, et al. Prognostic value of ST segment depression in acute coronary syndromes: Insights from PARAGON‐A applied to GUSTO II‐b. J Am Coll Cardiol 2001;38:64–71. [DOI] [PubMed] [Google Scholar]