

Abstract
Background: Arrhythmogenic right ventricular dysplasia (ARVD) is characterized by progressive replacement of RV myocardium with fibro‐adipose tissue thought to be responsible for the presence of late potentials (LP) detected by SAECG. The general consensus on the role of SAECG in the diagnosis and prognosis of patients with ARVD is lacking. The purpose of this systematic review was to better define the role of SAECG in ARVD.
Methods: An extensive review of literature was done to specifically describe the prevalence of LP in ARVD and its determinants, explore the various options available to improve the diagnostic ability of SAECG, and provide recommendations for proper utilization of this technique.
Results: LPs are frequent in ARVD (47–100%), and more prevalent in severe disease and in patients with documented spontaneous VT. SAECG is a useful test in following the characteristic evolutivity of the disease. 4–16% of normal family members of patients with ARVD also have abnormal SAECG results. Detection of LP in ARVD can be improved by employing a high‐pass filter of 25 Hz and specifically looking for changes in the Z leads.
Conclusions: SAECG testing should be considered a standard part of the evaluation of patients with known or suspected ARVD. Further research is needed to confirm the value of SAECG testing in predicting arrhythmia risk and assessing the rate of disease progression, as well as to determine if greater prevalence of SAECG abnormalities in family members of patients with ARVD represents early detection of ARVD. The ongoing multidisciplinary study of right ventricular dysplasia will hopefully answer some of these questions.
Keywords: ARVD, SAECG, time domain, frequency domain, prevalence
Arrhythmogenic right ventricular dysplasia (ARVD) is characterized by ventricular arrhythmias and structural abnormalities of the right ventricle (RV) due to progressive replacement of RV myocardium with adipose or fibro‐adipose tissue. 1 , 2 The precise cause of ARVD is unknown, although an autosomal dominant transmission with variable clinical expression and incomplete transmission has been reported. 3 ARVD is a difficult disease to diagnose. According to the 1994 Task Force Report on ARVD by McKenna et al., the diagnosis of ARVD is based on the presence of structural, histologic, electrocardiographic, arrhythmic, and genetic factors (Table 1). Although the presence of late potentials (LP) on signal‐averaged electrocardiography (SAECG) is one of the diagnostic criteria for ARVD, the precise definition of an abnormal SAECG has not been set. 4 Shown in Figure 1 are an EKG and SAECG of a 26‐year‐old man who was presented with sustained ventricular tachycardia (VT) and was diagnosed with ARVD. The EKG revealed inverted T waves in V1–V5 and an epsilon wave in lead V1. The SAECG was abnormal, with a filtered QRS duration (fQRSd) of 120 ms (normal < 114 ms), duration of impulse less than 40 μV (LAS40) of 53 ms (normal < 38 ms), and high frequency root‐mean square (RMS40) of 8 mV (normal > 20 mV).
Table 1.
Diagnostic Criteria for ARVDa
| Major Criteria | Minor Criteria | |
|---|---|---|
| Structural or functional abnormalities | 1. Severe dilation and reduction of RVEF with mild or no LV involvement | 1. Mild global RV dilation and/or EF reduction with normal LV |
| 2. Localized RV aneurysm (akinetic or dyskinetic areas with diastolic bulging) | 2. Mild segmental dilation of the RV | |
| 3. Regional RV hypokinesis | ||
| 3. Severe segmental dilatation of the RV | ||
| Tissue characterization | Infiltration of RV by fat with presence of surviving strands of cardiomyocytes | |
| ECG depolarization/conduction abnormalities | 1. Localized QRS complex duration >110 ms in V1, V2, or V3 | Late potentials in SAECG |
| 2. Epsilon wave in V1, V2, or V3 | ||
| ECG repolarization abnormalities | Inverted T waves in right precordial leads (V2–3 above age 12 years in absence of RBBB) | |
| Arrhythmias | 1. LBBB VT (sustained or nonsustained) on ECG, Holter or ETT | |
| 2. Frequent PVCs (>1000/24 hours on Holter) | ||
| Family history | Family history of ARVD confirmed by biopsy or autopsy | 1. Family history of premature sudden death (<35 years) due to suspected ARVD |
| 2. Family history of clinical diagnosis based on present criteria |
aThe criteria state that an individual must have two major, or one major plus two minor, or four minor criteria from different categories to meet the diagnosis of ARVD.4
Figure 1.
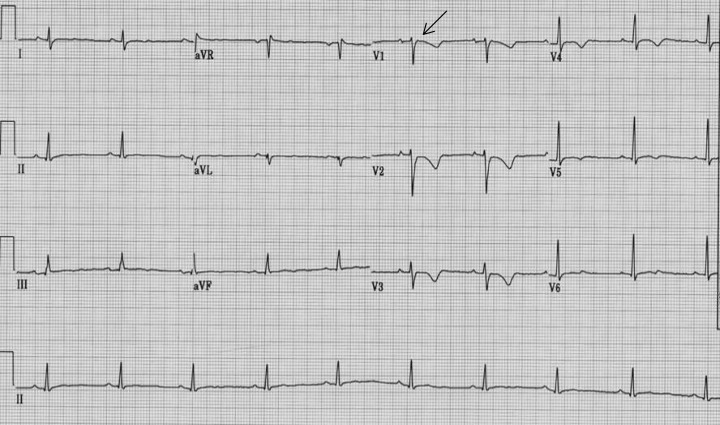
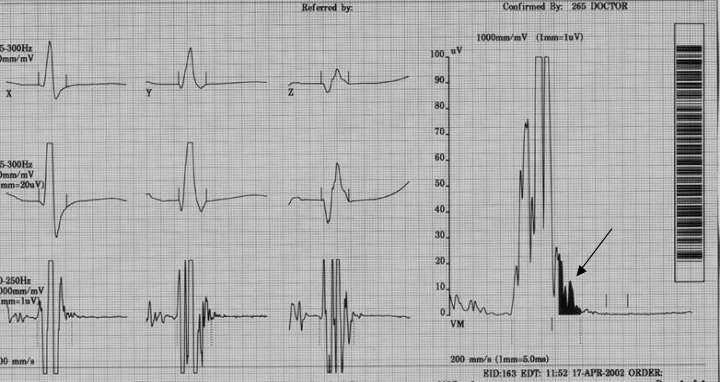
(a) 12‐lead ECG showing inverted T waves V1‐V5, QRS duration >110 ms in V1‐V3, and epsilon wave (arrow) in V1. (b) Late potentials on SAECG (arrow).
SAECG is used to detect delayed depolarization potentials on the body surface, referred as late potentials (LP). 5 , 6 , 7 They reflect the presence of slowed propagation in the myocardium, which results in delayed ventricular activation. The presence of slowed ventricular provides a substrate for reentrant arrhythmias. 8 , 9 , 10 , 11 , 12 In ischemic heart disease, especially after myocardial infarction, it has been demonstrated that ventricular tachycardia is related to this mechanism, and consequently it is not surprising that the prevalence of LPs is high. However, the cause of SAECG abnormalities in patients with various forms of nonischemic cardiomyopathy is less clear. ARVD is characterized by the fibro fatty replacement of the RV. This histological milieu is thought to interrupt the electrical continuity of the myocardial fibers creating fragmentation of ventricular and provides substrate for reentrant arrhythmias. 13
Systematic studies of SAECG‐LPs in ARVD are relatively recent and few. As a result, the general consensus on role of SAECG in the diagnosis and prognosis of patients with ARVD is lacking. The purpose of this study was to better define the role of SAECG in ARVD. In particular, we undertook a detailed systematic analysis of literature to (1) describe the prevalence of late potentials in ARVD and its determinants, (2) make an attempt to establish criteria for defining ‘late potentials’ in ARVD, (3) explore various options available to improve our ability to detect late potentials in patients with ARVD, (4) highlight the challenges faced in utilization of this technique, and (5) give future directions for ARVD‐SAECG studies.
SAECG IN ARVD
Prevalence SAECG Abnormalities in ARVD Patients
Table 2 summarizes the results of 13 reports identified in literature involving 458 patients with ARVD who have undergone SAECG studies. 14 , 15 , 16 , 17 , 18 , 19 , 20 , 21 , 22 , 23 , 24 , 25 , 26 Abnormalities of SAECG (i.e., LP) were present in 269 patients (59%, range: 47–100%). The prevalence of abnormalities in the SAECG appears to correlate with two main factors: (1) the extent of disease and (2) the presence of sustained ventricular tachycardia (VT).
Table 2.
Prevalence of Late Potentials in Patients with ARVD
| Author, Year | Cases n, Age | Controls n, Age | Severity of Disease | Filter Setting Hz | LP Citeriaa | LPs Cases n (%) | LPs Controls n(%) | Comments/Notes | ||
|---|---|---|---|---|---|---|---|---|---|---|
| fQRS | LAS | RMS | ||||||||
| Blomstrom | 16 | 16 | Severe: 16 (100%) | 25–250 | — | — | <20 | 12 (75%) | 1 (6%) | Longer fQRS and LPd in right versus left |
| C, 1988 | 35 ± 10 | 32 ± 7 | precordial leads seen in AVRD cases | |||||||
| Lemery R, | 12 | Mild: 7 (58%) | 40–250 | — | — | <25 | 5 (62%) | — | ||
| 1989 | 33 ± 9 | Severe: 5(42%) | ||||||||
| Haissaguere, | 39 | — | Mild: 25 (64%) | 25–250 | >120 | >40 | <25 | 25 (64%) | — | High dose isoproterenol testing is more |
| 1990 | 49 ± 16 | Severe: 14(36%) | sensitive than SAECG in diagnosis | |||||||
| of ARVD | ||||||||||
| Leclercq JF, | 52 | 45 | Mild: 36 (69%) | 40–300 | ≥113 | ≥38 | ≤16 | 25 (78%) | 2 (4%) | SAECG has a high specificity (96%) of |
| 1993 | 39 ± 10 | Severe: 16 (36%) | detecting underlying heart disease in | |||||||
| patients with RV tachycardia | ||||||||||
| Kinoshita O, | 30 | — | — | 20–250 | — | — | — | 25 (83%) | — | Optimal high‐pass filter setting for |
| 1994 | 38 ± 13 | 25–250 | — | — | — | 24 (80%) | time‐domain analysis of SAECG is | |||
| 40–250 | — | — | — | 18 (60%) | — | 20 Hz in patients with ARVD | ||||
| 70–250 | — | — | — | 14 (47%) | — | |||||
| Kinoshita O, | 28 | 35 | — | 25–250 | ≥121 | ≥41 | ≤25 | 20 (75%) | 0 (0%) | Frequency‐domain analyses of the SAECG |
| 1995 | 38 ± 13 | 35 ± 11 | 40–250 | >114 | >38 | <20 | 18 (64%) | 0 (0%) | were relatively equivalent to time‐domain | |
| analysis in the identification of patients | ||||||||||
| with ARVD and combining the two domain | ||||||||||
| analyses improves sensitivity without | ||||||||||
| reducing the specificity of the test | ||||||||||
| Daliento L, | 15 young | — | Mild: 28 (100%) | 25–250 | >124 | >23 | <53 | 16 (57%) | — | Adults had a higher prevalence of late |
| 1995 | 15 ± 5 | potentials as compared to young patients | ||||||||
| 13 adult | 40–250 | >114 | >32 | <28 | 17 (61%) | (70% vs 60%) | ||||
| 38 ± 13 | ||||||||||
| Mehta D, | 10 | — | Mild: 10 (100%) | 40–250 | >114 | ≥32 | ≤25 | 9 (90%) | — | All SAECG variables correlated with RV |
| 1995 | 41 ± 13 | diameters; the correlation was most | ||||||||
| significant with the fQRSd | ||||||||||
| Oselladore L, | 47 | Mild: 31(66%) | 40–250 | ≥114 | ≥38 | ≤20 | 39 (83%) | — | Incidence of abnormal SAECG progressively | |
| 1995 | 28 ± 12 | Severe: 16 (34%) | Mild: 23 (74%) | increased with increasing age | ||||||
| Severe 16 | ||||||||||
| (100%) | ||||||||||
| Hermida JS, | 13 | 37 | Mild: 4 (31%) | 40–250 | ≥120 | ≥38 | ≤20 | 8(62%) | 1(3%) | The sensitivity of combined SAECG and/or |
| 1997 | 44 ± 16 | 38 ± 13 | Severe: 9 (69%) | ECG abnormalities was 77%; better than | ||||||
| either test alone for the diagnosis of ARVD | ||||||||||
| Turrini P, | 38 | — | — | 40–250 | ≥122 men | ≥41 | ≤20 | 18(47%) | Significant association present between late | |
| 1999 | 32 ± 14 | ≥115 | potentials and RVEDV measured by | |||||||
| women | angiographically | |||||||||
| Nava A, | 138 | 146 | Mild: 66(48%) | 40–250 | ≥120 | ≥38 | ≤20 | 80 (57%) | 6(4%) | Strong correlation between SAECG with |
| 2000 | 33.7 ± 14 | 37 ± 14 | Mod: 54 (39%) | Mild: 21 (32%) | extent of disease | |||||
| Severe: 18 (37%) | Mod: 42 (78%) | SAECG not helpful in diagnosing minor forms | ||||||||
| Severe: 17 | of diseases | |||||||||
| (94%) | ||||||||||
| Kaneko Y, | 7 | 241 | 40–250 | ≥122 men | ≥41 | ≤20 | 6 (86%) | 19 (8%) | Compared with conventional 12‐lead ECG, | |
| 2001 | 28 ± 10 | 26 ± 10 | ≥115 | SAECG detects abnormalities at a higher | ||||||
| women | rate in ARVD patients (57% vs 86%) | |||||||||
| Overall | 455 | 520 | Mild: 197 (57%) | 269 (59%) | 29 (5%) | |||||
| Mod: 54 (16%) | ||||||||||
| Severe: 94 (27%) | ||||||||||
aAll studies apart from Blomstrom and Lemry have used presence of ≥2 abnormal SAECG for the presence of a late potential fQRSd: filtered QRS duration, LAS: late amplitude signal <40 μV, RMS: root mean square in last 40 ms, LP: late potentials.
A number of studies reviewed revealed a close relationship between the extent of disease and the prevalence of the late potential in patients with ARVD. 14 , 21 , 24 , 25 Late potentials were present in 57% (range: 21–90%) of mild cases and in 87% of severe cases (range: 81–100%). Studies have also found a direct relationship between RV dimensions and SAECG variables. The most significant correlation reported is with the duration of filtered QRS complex (fQRS). 13 , 21 With the enlargement of the RV, it seems probable that there are areas of RV myocardium that are activated late, leading to delayed depolarization. 20 The results of these studies suggest that SAECG variables indirectly quantify anatomical damage in patients with ARVD, and that SAECG may be a useful noninvasive test to evaluate the extent and progression of disease.
The prevalence of late potentials in ARVD also varies based on the presence or absence of a history of spontaneous sustained VT. In a study of familial form of ARVD, 76% patients with a history of sustained VT had LP, whereas only 48% of those without a history of sustained VT had LP (P = 0.05). 22 Our review of the literature supports the relatively high prevalence of LP in ARVD patients with sustained VT (61–100% according to the series). Patients with multiple morphology of VT have particularly abnormal SAECGs, with LP that are significantly longer and have lower voltage. 13 In contrast to sustained VT the relationship between NSVT and abnormalities of the SAECG is not well defined with a reported incidence of 0–63%. The sensitivity (66–88%) and specificity (80–100%) of an abnormal SAECG for detection of ARVD with VT are high in all series; and SAECG seems a highly sensitive method in the detection of such patients (Table 3).
Table 3.
Prevalence of Late Potentials According to Type of Tachyarrhythmias in Patients with ARVD
| Prevalence | Prevalence of Late Potentials Based on VT Type | |||
|---|---|---|---|---|
| Author, Year | of VT/VF n (%) | sustained VT n (%) | Nonsustained VT n (%) | VF n (%) |
| Blomstrom C, 1988 | 16 (100%) | 15 (92%) | 0 (0%) | 1 (100%) |
| Lemery R, 1989 | 8 (100%) | 5 (62%) | — | — |
| Haissaguere 1990 | 37 (95%) | 13 (82%) | 12 (56%) | — |
| Leclercq JF 1993 | 52 (100%) | 25 (78%) | 14 (70%) | — |
| Kinoshita O, 1994 | 30 (100%) | 14–25 (47–83%)a | — | — |
| Kinoshita O, 1995 | 28 (100%) | 18–20 (68–75%)a | — | — |
| Daliento L 1995 | 19 (68%) | 6 (67%) | 4 (44%) | 1 (50%) |
| Mehta D 1995 | 10 (100%) | 9 (90%) | — | — |
| Hermida JS 1997 | 13 (100%) | 8 (62%) | — | — |
| Turrini P 1999 | 24 (64%) | 9 (75%) | 3 (33%) | 2 (67%) |
| Nava 2000 | 89 (64%) | 36 (72%) | 13 (41%) | 5 (71%) |
Of all patients with ventricular tachycardia 68% had SVT, 27% NSVT and 15% V Fib.
aDepending upon the high‐pass filter used.
Prevalence SAECG Abnormalities in Family Members
Since ARVD has been known to be a genetic disease, family members of affected individuals represent an ideal study model to evaluate the diagnostic and prognostic value of SAECG. Hermida et al. studied the presence of late potentials in 101 normal family members of patients with ARVD. 23 The incidence of late ventricular potentials was higher in family members than in the control subjects (16% vs 3%, P < 0.05). Oselladore reported almost similar results with a presence of 14% LPs in the normal family members of patients with ARVD. 22 The presence of 14–16% late potentials in apparently normal individuals with a family history of ARVD is considerably higher than that reported in the general normal population of 0–6%. 25 , 27 , 28 These findings suggest that SAECG maybe useful in detecting individuals earlier in the course of disease. Further studies with a long‐term follow‐up are required to better define the significance of an abnormal SAECG in a normal family member. Genetic studies with identification of additional genes for ARVD will also be helpful. Until the results of these studies are available, it would be reasonable to suggest that individuals with abnormal SAECG should receive close clinical follow‐up.
Evolution of SAECG Variables During Long‐term Follow‐up
Several studies have examined the evolution of SAECG variables with time. Folino et al. in a recent study, using three different band‐filters (20–250 Hz, 40–250 Hz, and 80–250 Hz) performed sequential SAECGs after a mean time interval of 44 months in 52 patients with ARVD, to determine the practicality of this test in assessing the progression of disease. 29 The results demonstrated a significant difference between the two recordings in all SAECG parameters. The overall prevalence of late potentials increased with time. The prevalence of LP in 25–250 Hz filter changed from 13.3% to 28.8%; in 40–250 Hz filter from 44.2% to 55.7%; and in 80–250 Hz filter from 55.7% to 69.2%, respectively. The change was more pronounced in the younger group (age range 10–19 years). 29 Oselladore demonstrated a progressive increase in the prevalence of late potentials recorded by SAECG in ARVD patients with age, reporting a prevalence of 12.5% in patients aged 1–10 years compared to 77% in patients aged 30 years and above; an indication of the evolution of disease with age. 22
The results of the above reports suggest that the SAECG may be a useful test in studying the characteristic evolutivity of the disease. The different proportions of changes depending upon filter settings seem to indicate that in the first phase of the disease the myocardial modifications generate late potentials with high frequency characteristics probably due to small areas of degenerative processes, while the progression of cardiomyopathy, leading to larger zones of myocardial degenerations, produces an evident increase of late potentials in the lower frequency. 30
SAECG and Arrhythmia Risk Stratification
Although the importance of SAECG in establishing the diagnosis and its relationship with the extent of the disease has been proven, the usefulness of the SAECG technique in stratifying the arrhythmic risk has not be determined. As a result we evaluated the value of SAECG in predicting the inducibility of sustained monomorphic ventricular tachycardia in patients with ARVD undergoing programmed ventricular stimulation (PES). 31 The study group included 40 patients (42% male, 37 ± 12 years). Nine patients with bundle branch block were excluded from the study. Twenty‐one (67%) patients had induced monomorphic VT on PES. A fQRS ≥ 110 ms had the highest utility in identifying ARVD patients prone to inducible monomorphic VT on PES with a sensitivity, specificity, and total predictive value of 91%, 90%, and 90%, respectively. 31 To the best of our knowledge, this is the first study describing that SAECG is highly capable of identifying patients with ARVD who are prone to VT on PES. However, more suitable studies are needed to investigate the ability of SAECG to predict future arrhythmic events among these patients.
FUTURE DIRECTIONS
Time Domain or Frequency Domain?
SAECG studies have most extensively used the time‐domain analysis technique based on bi‐directional filtering. The Task Force Committee of the European Society of Cardiology, the American Heart Association, and the American College of Cardiology recently published guidelines for data acquisition and analysis SAECG. 32 They recommended that the SAECG should be considered abnormal (using 40 Hz high‐pass bi‐directional filtering) when two or more of the following is present: (1) fQRS ≥ 114 ms, (2) LAS40 ≥ 38 ms, and (3) RMS40 < 20 μV. These recommendations were extensively based on results obtained from patients with ventricular arrhythmias who had coronary artery disease, in whom SAECG parameters analyzed at a high‐pass filter setting of 40 Hz were most frequently represented in the top predictive combinations. 33 , 34 There are no widely accepted guidelines for the optimal cutoff for an abnormal SAECG as well as high‐pass filter setting in patients with ARVD, who have ventricular tachycardia originating from the right ventricle, and in most cases, normal left ventricle function. 19 Kinoshita et al. recommended that fQRS > 110 ms using a high‐pass filter of 25 Hz to be a more appropriate criteria and high‐pass filter for patients with ARVD, respectively. However, these results need to be verified from larger study groups.
Frequency‐based analysis technique has also been used for SAECG, based on estimating the Fourier spectra of a windowed time interval covering the terminal QRS part and the ST‐segment. 30 Although the end points of frequency‐domain analysis have not yet been standardized, it has its own advantages. First, complex high‐pass filtering is not required. This is important because the frequency content of LPs is low, and cut‐off frequencies may abolish late potentials. Second, the definition of the end of QRS complex is not a crucial factor in frequency‐domain analysis and patients with bundle branch block (BBB) need not be excluded. 35 , 36 , 37 Kinoshita et al. reported that frequency‐domain analyses of the SAECG were relatively equivalent to time‐domain analysis in the identification of patients with ARVD. 20 Apart from this there is no other study validating the accuracy of frequency domain compared to their time domain counterpart in patients with ARVD.
The time‐ and frequency‐domain analyses also have their own shortcomings. 38 Many studies have shown that combining the time and frequency analyses significantly improved the prognostic ability for predicting a major arrhythmic event in post‐MI patients compared to the time domain or frequency domain analyzed separately. 39 , 40 , 41 , 42 Similarly, Kinoshita reported that combining the two domain analyses improved the sensitivity without reducing the specificity in detecting patients with ARVD as compared to using them alone. 20 Although promising, this methodology is yet to be validated by further studies.
Recording Leads
The SAECG parameters are traditionally analyzed from vector magnitude using X, Y, and Z leads. 43 Several recent studies have suggested that this may not be optimal for ARVD, which predominantly affects the right ventricle, and this technique might theoretically reduce the chances of detecting a late potential originating from the RV in mild cases with almost no involvement of the predominant left ventricle. Late potentials in ARVD may be detected exclusively in lead Z or V1, which reflects the vector for the anterior chest. Using this rationale, Blomstrom demonstrated right‐side preponderance in ARVD by the significantly longer fQRSd and LPd right (V1) versus left (V5) precordial leads. 13 Similarly, the highest amplitude of late potentials in patients with ARVD has been reported in lead V1 when compared to patients with left ventricular aneurysm, in whom higher amplitudes were recorded in lead V5. 44 Ohe et al. also showed that LPs of right ventricular origin were detected predominantly in lead V1, and those of left ventricular origin in lead V5 using a time‐domain analysis. 45 All the above studies indicate that SAECG parameters recorded on Z leads alone may potentially improve the predictive ability of this test for identifying patients with ARVD.
Conduction Defects
Studies using the standards described by the Task Force Committee have demonstrated that high resolution ECG time‐domain variables have a low accuracy to predict arrhythmic events in patients with conduction defects and have high incidence of false positive LPs on SAECG. 46 , 47 The Task Force Committee recommended that SAECG is not to be obtained in patients with major conduction defects (QRS ≥ 120 ms). 32 As a result a vast majority of the studies examining the usefulness of the SAECG have excluded patients with BBB or a major conduction defect from their analysis in the belief that BBB can generate low amplitude signals in the terminal QRS mimicking LP. In patients with structural changes to the right ventricle like ARVD, the occurrence of conduction defects occurs in 18–30% of patients. 48 The inability to perform a SAECG in the presence of a significant conduction represents a major limitation in the use of SAECG in ARVD. However, studies have shown that by making a slight modification of the criteria described by the Task Force Committee, the accuracy of SAECG to predict arrhythmic events can be increased in BBB. For example, according to Fontaine et al., the combination of RMS 40 ≤ 17 μV and LAS 40 ≥ 55 ms best discriminated patients likely to develop arrhythmias with LBBB in patients with CAD (QRS ≥ 120 ms). 49 Similarly, Gatzoulis et al. recommended using a modified late potential criterion, such as the presence of two of any of the following three signal averaged parameters: filtered QRS duration ≥ 145 ms, LAS duration ≥ 50 ms, RMS of the last 40 ms ≤ 17 μV to improve the predictive value of SAECG in patients with complete RBBB (QRS ≥ 120 ms) and incomplete RBBB (QRS ≥ 100 and < 120 ms) in post MI patients. 50
Frequency‐domain analysis of SAECG may be another technique for improving the diagnostic ability of SAECG in patients with a conduction delay. Lindsay et al. performed the first study of frequency‐domain analysis of SAECG in patients with conduction defects and demonstrated that the differentiation of patients with and without VT by this method was not affected by BBB. 35 However, its use has not been widespread due to the lack of standardized end points.
At this moment it is not possible to identify a single technique, which seems to be superior to others, or to state that frequency‐domain analysis is the definitive answer of SAECG for ARVD patients with BBB. It seems clear that when using the time‐domain approach in patients with BBB, more stringent criteria than used in patients with normal conduction are required for the identification of a patient at risk for VT. At this moment it seems reasonable that future studies include patients with conduction defects for the establishment of appropriate SAECG criteria that will permit risk stratification for arrhythmias in patients with ARVD.
CONCLUSION
Our review of the literature and clinical experience led us to conclude that SAECG testing should be considered as a standard part of the evaluation of patients with known or suspected ARVD. Not only are the results of SAECG one of the criteria used to establish the diagnosis of ARVD, but the results of SAECG testing appear to correlate with the severity of disease and arrhythmia risk.
Further research is needed to confirm the value of SAECG testing in predicting arrhythmia risk and assessing the rate of disease progression. Studies are also needed to determine if the greater prevalence of SAECG abnormalities in family members of patients with ARVD represents early detection of ARVD prior to subsequent development of symptoms of ARVD, or whether these cases are “false positives.” Until this question is answered, it seems reasonable to recommend more careful follow‐up of those family members in whom SAECG abnormalities are detected. And finally, further research is needed to determine that time‐domain SAECG analysis protocol that has the optimal sensitivity and specificity for detection of ARVD and to determine whether a frequency‐domain SAECG analysis may be useful in the evaluation of patients with underlying conduction delay. Some of these questions will hopefully be answered by the ongoing Multidisciplinary Study of Right Ventricular Dysplasia, which is a multicenter, collaborative study to investigate the cardiac, clinical, and genetic aspects of ARVD funded by a grant from the National Institutes of Health and the National Heart, Lung, and Blood Institute. This study will follow patients with ARVD and their family members for the next five years, accumulating information in a centralized manner. One of its specific aims is to develop quantitative methods to assess the role of various clinical investigations in order to enhance the specificity and sensitivity of ARVD diagnosis.
The Johns Hopkins ARVD program is funded by a private grant from the Bogle Foundation. This study is also supported by National Institutes of Health Research Grant 1 UO1 HL65594‐01A1.
REFERENCES
- 1. Marcus FI, Fontaine G. Arrhythmogenic right ventricular dysplasia/cardiomyopathy: A review. PACE 1995;18: 1298–1314. [DOI] [PubMed] [Google Scholar]
- 2. Nava A, Scognamiglio R, Thiene G, et al A polymorphic form of familial arrhythmogenic right ventricular dysplasia. Am J Cardiol 1987;59: 1405–1409. [DOI] [PubMed] [Google Scholar]
- 3. Nava A, Thiene G, Canciani B, et al Familial occurrence of right ventricular dysplasia. A study involving nine families. J Am Coll Cardiol 1988;12: 122–1228. [DOI] [PubMed] [Google Scholar]
- 4. McKenna WJ, Thiene G, Nava A, et al Diagnosis of arrhythmogenic right ventricular dysplasia/cardiomyopathy. Task Force of the Working Group Myocardial and Pericardial Disease of the European Society of Cardiology and of the Scientific Council on Cardiomyopathies of the International Society and Federation of Cardiology. Br Heart J 1994;71: 215–218. [DOI] [PMC free article] [PubMed] [Google Scholar]
- 5. Berbari EJ, Scherlag BJ, Hope RR, et al Recording from the body surface of arrhythmogenic ventricular activity during the S‐T segment. Am J Cardiol 1978;41: 697–702. [DOI] [PubMed] [Google Scholar]
- 6. Simson MB. Use of signals in the terminal QRS complex to identify patients with ventricular tachycardia after myocardial infarction. Circulation 1981;64: 235–242. [DOI] [PubMed] [Google Scholar]
- 7. El‐Sheriff N, Gomes JAC, Restivo M, et al Late potential and arrhytmogenesis. PACE 1985;8: 440–461. [DOI] [PubMed] [Google Scholar]
- 8. Briethardt G, Borggrefe M. Pathophysiological mechanisms and clinical significance of ventricular late potentials. Eur Heart J 1986;7: 364–385. [DOI] [PubMed] [Google Scholar]
- 9. Vatterott PJ, Hammill SC, Bailey RK, et al Signal averaged electrocardiography: A non‐invasive test to identify patients at risk for ventricular arrhythmias. Mayo Clin Proc 1988;63: 931–942. [DOI] [PubMed] [Google Scholar]
- 10. Briethardt G, Borggrefe M, Kabenn U, et al Prevalence of late potentials in patients with and without ventricular tachycardia: Correlations with angiographic findings. Am J Cardiol 1982;48: 1932–1937. [DOI] [PubMed] [Google Scholar]
- 11. Steinberg JS, Regan A, Sciacca RR, et al Predicting arrhythmic events after acute myocardial infarction using the signal‐averaged electrocardiogram. Am J Cardiol 1992;69(1): 13–21. [DOI] [PubMed] [Google Scholar]
- 12. Bruna C, Vado A, Rossetti G, et al Time domain signal‐averaged electrocardiogram in predicting arrhythmic events after myocardial infarction: Role of the duration of the filtered QRS complex. Cardiologia 1996;41(12): 1183–1192. [PubMed] [Google Scholar]
- 13. Fontaine G, Fontaliran F, Hebert JL, et al Arrhythmogenic right ventricular dysplasia. Annu Rev Med 1999;50: 17–35. [DOI] [PubMed] [Google Scholar]
- 14. Blomstrom‐Lundqvist C, Hirsh I, Oslon B, et al Quantitative analysis of the signal‐averaged QRS with arrhythmogenic right ventricular dysplasia. Eur Heart J 1988;9: 301–312. [DOI] [PubMed] [Google Scholar]
- 15. Lemery R, Brugada P, Janssen J, et al Non‐ischemic sustained ventricular tachycardia: Clinical outcome in 12 patients with arrhythmogenic right ventricular dysplasia. J Am Coll Cardiol 1989;14: 96–105. [DOI] [PubMed] [Google Scholar]
- 16. Haissaguerre M, Metayer PL, O'Ivernois C, et al Distinctive responses of arrhythmogenic right ventricular dysplasia to high dose isoproterenol. PACE 1990;13: 2119–2125. [DOI] [PubMed] [Google Scholar]
- 17. Leclercq JF, Coumel P. Late potentials in arrhythmogenic right ventricular dysplasia. Prevalence, diagnostic and prognostic values. Eur Heart J 1993;14 (Suppl. E):80–83. [DOI] [PubMed] [Google Scholar]
- 18. Kinoshita O, Fontaine G, Rosas F, et al Optimal high‐pass filter settings of the signal‐averaged electrocardiogram in patients with arrhythmogenic right ventricle dysplasia. Am J Cardiol 1994;74: 1074–1075. [DOI] [PubMed] [Google Scholar]
- 19. Kinoshita O, Fontaine G, Rosas F, et al Time‐ and frequency‐domain analyses of signal‐averaged ECG in patients with arrhythmogenic right ventricular dysplasia. Circulation 1995;9: 715–721. [DOI] [PubMed] [Google Scholar]
- 20. Daliento L, Turrini P, Nava A, et al Arrhythmogenic right ventricular cardiomyopathy in young versus adult patients: Similarities and differences. J Am Coll Cardiol 1995;25(3): 655–664. [DOI] [PubMed] [Google Scholar]
- 21. Mehta D, Mckenna WJ, Ward DE, et al Significance of signal‐averaged electrocardiography in relation to right ventricular endomyocardial biopsy in patients with ventricular tachycardia without clinically apparent heart disease. Am J Cardiol 1989;14: 372–379. [DOI] [PubMed] [Google Scholar]
- 22. Oselladore L, Nava A, Buja G, et al Signal‐averaged electrocardiography in familial form of right ventricular cardiomyopathy. Am J Cardiol 1995;75: 1038–1041. [DOI] [PubMed] [Google Scholar]
- 23. Hermida JS, Minnassain A, Jarry G, et al Familial incidence of late ventricular potentials and electrocardiographic abnormalities in arrhythmogenic right ventricular dysplasia. Am J Cardiol 1997;79: 1375–1380. [DOI] [PubMed] [Google Scholar]
- 24. Turrini P, Angelini A, Thiene G, et al Late potentials and arrhythmias in arrhythmogenic right ventricular cardiomyopathy. Am J Cardiol 1999;83: 1214–1219. [DOI] [PubMed] [Google Scholar]
- 25. Nava A, Folino F, Bauce B, et al Signal‐averaged electrocardiogram in patients with arrhythmogenic right ventricular cardiomyopathy and ventricular arrhythmias. Eur Heart J 2000;21: 58–65. [DOI] [PubMed] [Google Scholar]
- 26. Sekiguchi K, Miya Y, Kaneko Y, et al Evaluation of signal‐averaged electrocardiography for clinical diagnosis in arrhythmogenic right ventricular dysplasia. Jpn Heart J 2001;42: 287–294. [DOI] [PubMed] [Google Scholar]
- 27. Poll DS, Marchlinski FE, Falcone RA, Dresdon CA, et al Abnormal signal‐averaged electrocardiograms in patients with non‐ischemic congestive cardiomyopathy: Relationship to sustained ventricular tachyarhythmias. Circulation 1985;72: 1308–1313. [DOI] [PubMed] [Google Scholar]
- 28. Manolis AS, Childakalis JA, Malakos JS, et al Abnormal signal‐averaged electrocardiograms in patients with incomplete right bundle branch block. Clin Cardiol 1997;20: 17–22. [DOI] [PMC free article] [PubMed] [Google Scholar]
- 29. Folino A, Corso LD, Oselladore L, et al Signal‐averaged electrocardiogram In Nava A, Rossi L, Thiene G. (eds.): Arrhythmogenic Right Ventricular Cardiomyopathy/Dysplasia. New York , Elsevier, 1997,pp. 210–223. [Google Scholar]
- 30. Lander P, Albert D, Berbari J. Principles of frequency‐domain analysis In El‐Sherif, Turitto G. (eds.) High‐Resolution Electrocardiography. New York , Futura, 1992, pp. 105–128. [Google Scholar]
- 31. Nasir K, Rutberg J, Tandri H, et al Filtered QRS duration predicts inducibility of ventricular tachycardia in arrhythmogenic right ventricular dysplasia. PACE 2002;25: 215A. [DOI] [PubMed] [Google Scholar]
- 32. ACC Expert Consensus document on signal averaged electrocardiography. J Am Coll Cardiol 1996;27: 238–249. [PubMed] [Google Scholar]
- 33. Gomes JA, Winter SL, Stewart D, et al Optimal bandpass filters for time‐domain analysis of the signal‐averaged electrocardiogram. Am J Cardiol 1987;60: 1290–1298. [DOI] [PubMed] [Google Scholar]
- 34. Caref EB, Turrito G, Ibrahim BB, et al Role of bandpass filters in optimizing the value of signal‐averaged electrocardiogram as a predictor of the results of programmed stimulation. Am J Cardiol 1989;64: 16–26. [DOI] [PubMed] [Google Scholar]
- 35. Lindsay BD, Ambos HD, Schechtman KB, et al Improved selection of patients for programmed ventricular stimulation by frequency domain analysis of signal‐averaged electrocardiograms. Circulation 1986;73: 675–683. [DOI] [PubMed] [Google Scholar]
- 36. Lindsay BD, Ambos HD, Schechtman KB, et al Identification of patients with sustained VT by frequency analysis of signal‐averaged electrocardiograms despite the presence of bundle branch block. Circulation 1988;77: 122–130. [DOI] [PubMed] [Google Scholar]
- 37. Lindsay BD, Markham J, Schechtman KB, et al Improved differentiation of patients with and without ventricular tachycardia by frequency analysis of multiple electrocardiographic leads. Am J Cardiol 1988;62: 556–561. [DOI] [PubMed] [Google Scholar]
- 38. Gramatikov B. Detection of late potentials in the signal averaged ECG‐ combining time and frequency domain analysis. Med Biol Eng Comput 1993;31: 333–339. [DOI] [PubMed] [Google Scholar]
- 39. Nogami A, Iesaka Y, Akiyama J, et al Combined use of time and frequency domain variables in signal‐averaged ECG as a predictor of inducible sustained monomorphic ventricular tachycardia in myocardial infarction. Circulation 1992;86: 780–789. [DOI] [PubMed] [Google Scholar]
- 40. Ahuja RK, Turitto G, Ibrahim B, et al Combined time‐domain and spectral turbulence analysis of the signal‐averaged ECG improves its predictive accuracy in postinfarction patients. J ElectroCardiol 1994;27: 202–206. [DOI] [PubMed] [Google Scholar]
- 41. Kulakowski P, Hnatkova K, Bashir Y, et al Influence of the infarct site on the identification of patients with ventricular tachycardia after myocardial infarction based on the time‐domain and spectral turbulence analysis of the signal‐averaged electrocardiogram. Clin Cardiol 1995;18: 39–44. [DOI] [PubMed] [Google Scholar]
- 42. Vazquez R, Caref EB, Torres F, et al Improved diagnostic value of combined time and frequency domain analysis of the signal‐averaged electrocardiogram after myocardial infarction. J Am Coll Cardiol 1999;33: 385–394. [DOI] [PubMed] [Google Scholar]
- 43. El‐Sherif N, Gomes JAC, Restivo M, et al Late potentials and arrhythmogenesis. PACE 1975;8: 440. [DOI] [PubMed] [Google Scholar]
- 44. Abboud S, sen Belhas B, Laniado S, et al Non‐invasive recording of late ventricular activity using an advanced method in patients with a damaged mass of ventricular tissue. J Electrocardiol 1983;16: 245–252. [DOI] [PubMed] [Google Scholar]
- 45. Ohe T, Konoe A, Shimizu A, et al Differentiation between late potentials of right ventricular and of left ventricular origin. Am J Cardiol 1989;64: 37–41. [DOI] [PubMed] [Google Scholar]
- 46. Ommen SR, Hammill SC, Bailey KR. Failure of signal‐averaged electrocardiography with use of time‐domain variables to predict inducible ventricular tachycardia in patients with conduction defects. Mayo Clin Proc 1995;70: 132–136. [DOI] [PubMed] [Google Scholar]
- 47. Brembilla‐Perrot B, Terrier de la Chaise A, Jacquemin L, et al The signal‐averaged electrocardiogram is of limited value in patients with bundle branch block and dilated cardiomyopathy in predicting inducible ventricular tachycardia or death. Am J Cardiol 1997;79: 154–159. [DOI] [PubMed] [Google Scholar]
- 48. Fontaine G, Frank R, Tonet JL, et al Arrhythmogenic right ventricular dysplasia: A clinical model for the study of chronic ventricular tachycardia. Jpn Clinc J 1983;48: 515–538. [DOI] [PubMed] [Google Scholar]
- 49. Fontaine JM, Rao R, Henkin R, et al Study of the influence of left bundle branch block on the signal‐averaged electrocardiogram: A qualitative and quantitative analysis. Am Heart J 1991;121: 494–508. [DOI] [PubMed] [Google Scholar]
- 50. Gatzoulis KA, Carlson MD, Biblo LA, et al Time domain analysis of the signal‐averaged electrocardiogram in patients with a conduction defect or a bundle branch block. Eur Heart J 1995;16: 1912–1919. [DOI] [PubMed] [Google Scholar]