


Abstract
Background: Wavelet‐based methods of analyzing ECG signals have been used to identify specific features in cardiac arrhythmias. Since some of these features are rate dependent, it is a requirement that they are examined across a range of physiological heart rates. The wavelet transform is a signal analysis tool that can elucidate spectral and temporal information simultaneously from complex signals, including the ECG. The aim of this study was to identify the local frequency characteristics of the ECG using a real‐time wavelet scalogram and to study the rate dependence of these features.
Methods: We examined the spectral temporal behavior of the local characteristics of the electrocardiogram (ECG) of 10 patients, in whom precise control of heart rate was achieved using right atrial pacing. Temporary reprogramming was used to adjust the paced atrial rate to predetermined values so that a rate‐controlled rhythm was produced that closely resembled sinus rhythm.
Results: Rate‐dependent features are seen on time–frequency scalograms. As the rate increases, the temporal spacing of features decrease and the frequency bands shift upward on the plot. Two patients with abnormal atrioventricular conduction demonstrate features of Wenckebach conduction and fusion.
Conclusions: Characterization of the rate‐dependent features of the ECG in a paced atrial rhythm by wavelet transform techniques has revealed some additional information not readily seen on single lead ECG analysis. This model provides a surrogate for changes that might be expected during rate changes in physiological sinus rhythm. It is envisaged that this method will offer advantages in detecting features of clinical significance that may not be readily seen by existing methods.
Keywords: arrhythmia, electrocardiogram, heart rate, pacemaker, sinus rhythm, wavelet transform
Time–frequency analysis can be used to examine the temporal behavior of frequency characteristics of the electrocardiogram (ECG) that are not obvious to the eye. Information derived from time–frequency analysis may provide additional information about electrical conduction within the heart during arrhythmia and in certain disease states. Wavelet‐based methods have been used to study complex cardiac arrhythmias, such as ventricular fibrillation and atrial fibrillation, in which the time–frequency characteristics of the arrhythmia may reflect its amenability to treatment. 1 , 2 , 3 , 4 It is envisaged that wavelet analysis of ECG signals during disease will provide additional useful information about the electrical state of the heart that may help in the targeting of appropriate treatment. To understand spectral features within the ECG during arrhythmia, it is important to identify the range of features that may be seen in normal rhythms. Since some of these features, such as the P–R interval and T‐wave duration, are rate dependent, it is a requirement that spectral features would be examined across a range of physiological heart rates.
The wavelet transform is a signal analysis tool that can elucidate spectral and temporal information simultaneously from complex signals, including the ECG. It overcomes some of the limitations of the more widely used Fourier transform, which only contains globally averaged spectral information, and has the potential to obscure localized features within the signal. Wavelet analysis has been applied to biomedical data including electroencephalogram, electromyogram, acoustic signals, and the ECG. 5 , 6 , 7 , 8 , 9 Previous wavelet‐based studies of ECG signals have been used to examine very low frequency variations, such as heart rate variability, to classify ECG waveforms, or to compress ECG data. Previous studies from our group have utilized wavelet analysis to study complex ECG waveforms during ventricular fibrillation and atrial fibrillation. 1 , 2 , 3 , 4
In this observational study, we examined the spectral temporal behavior of the local characteristics of the ECG of 10 patients, in whom precise control of heart rate was achieved using right atrial pacing. The aim of this study was to identify the local frequency characteristics of the ECG using a real‐time wavelet scalogram and to study the rate dependence of these features.
METHODS
Ten patients were recruited from the pacemaker clinic at the Royal Infirmary of Edinburgh. We selected patients who had an atrial single‐chamber or dual‐chamber permanent pacemaker, but who had intact intrinsic atrioventricular (AV) node conduction at rest. Pacemakers were programmed with a paced AV delay greater than the patients' resting intrinsic AV interval to avoid right ventricular pacing. Temporary reprogramming was used to adjust the paced atrial rate to predetermined values. In this way a rate‐controlled rhythm was produced that closely resembled sinus rhythm, since right atrial pacing was performed in the appendage close to the sinoatrial node. A standard lead II configuration was used for ECG acquisition. Right atrial pacing rates were adjusted in sequence as follows: 70 beats per minute (bpm) (2 minutes), 90 bpm (2 minutes), 110 bpm (2 minutes), and 70 bpm (1 minute). In one case, the patient's resting heart rate was greater than 70 bpm, so rates of 100, 110, and 120 bpm were used. ECG signals were acquired via a portable data logger directly into a laptop computer running Visual Designer software (Burr‐Brown/Texas Instruments, Dallas TX, USA).
The complete analysis of a signal requires the deduction of both the frequency make up and temporal location of the signal components. As a result of the infinite extent of the Fourier integral, analysis is time averaged. This renders feature location complex, even for stationary signals. This limitation can be partly overcome by introducing a sliding time window, which localizes the analysis in time. This local or short‐time Fourier Transform provides a degree of temporal resolution by highlighting changes in spectral response with respect to time. However, this method is always a compromise between temporal and frequency resolution (higher frequency resolution means lower temporal resolution, and vice versa). The nature of the wavelet transform is such that it is well suited to analysis of signals in which a more precise time resolution is required for higher frequencies than for lower ones; that is, the wavelet transform is suitable for locating discontinuities or singularities, in which high‐frequency components dominate. 10 It effectively zooms in on the temporal signal when analyzing higher frequencies, providing higher resolution where necessary.
The wavelet transform is defined as
 |
(1) |
where ψ*(t) is the complex conjugate of the wavelet function ψ(t), “a” is the dilation parameter of the wavelet, “b” is the location parameter of the wavelet and x(t) is the signal under investigation, which, in this application, is the ECG. The time‐scale representation of Equation (1) may be converted to a time–frequency representation. To achieve this, we must convert from the wavelet “a” scale (which can be interpreted as a representative temporal period) to a characteristic frequency of the wavelet function.
The method used here relies on high resolution in wavelet space; hence the continuous wavelet transform (CWT) is the preferred method. (The time–frequency discretization used by the discrete wavelet transform and the stationary wavelet transform is, in general, too coarse for useful application. 10 ) The CWT is implemented in the method through a fine discretization in both time and frequency, which the authors have found particularly good at revealing hidden signal information from a variety of biosignals. 2 , 4 For practical implementation requiring fast numerical computation the wavelet transform may be expressed in Fourier space and the Fast Fourier Transform algorithm is used. However, for a real‐time application, that is, for operation within a medical device, the temporal domain convolution expressed by Equation (1) may be more appropriate.
There is a wide choice of wavelet function with which to probe the ECG signal, here we employ the complex Morlet wavelet, defined in full as
 |
(2) |
where f0 is the central frequency of the mother wavelet. (This is used as the characteristic frequency of the wavelet.) This complex wavelet allows both amplitude and phase information to be interrogated in wavelet space. The second term in the brackets is known as the correction term. In the literature the correction term is often ignored, as in practice it becomes negligible for values of f0≫ 0. However, we have found in previous work 11 that low values of f0 can be particularly useful for detecting short‐duration signal transients, which can be obscured for more oscillatory wavelets (i.e., at higher f0 values). Hence our methods employ the full Morlet wavelet, which allows for tunable central frequencies down to relatively low values.
The wavelet energy density plot—the scalogram —is useful for viewing the distribution of signal‐feature‐dependent energies in the time–frequency plane. 12 It can be integrated across “a” and “b” to recover the total energy in the signal using the wavelet‐dependent admissibility constant, Cg, as follows:
 |
(3) |
where ‘| |’ is the modulus operator.
Rescaling of the scalogram as follows
 |
(4) |
is useful when Morlet‐based ridge‐following methods are used as it allows ridges in the rescaled scalogram to be associated directly with instantaneous frequencies. In addition, due to the continuously changing aspect ratios of the Heisenberg boxes with frequency associated with wavelet function, this rescaling is necessary to preserve amplitudes of similar temporal features at different dilations. 11 We employ the rescaled scalogram herein in all plots.
RESULTS
All ten patients were asymptomatic during these pacing maneuvers. Intrinsic AV conduction from the paced atrium was observed throughout in eight patients. One patient demonstrated Wenckebach AV block at the highest pacing rate (AAI mode). One patient paced the atria and ventricles in sequence (DDD mode) when AV block occurred during more rapid atrial pacing, because the intrinsic PR interval exceeded the programmed AV delay of the pacemaker.
Figure 1 shows the wavelet transform time–frequency analysis of the different pacing rates in a single patient over 7 minutes. Changes in bands can be seen with each rate showing an increase in energy with higher rates and resolution back to baseline when the rate is reset to 70 bpm.
Figure 1.

Entire recording of pacing maneuvers.
Figure 2 shows the wavelet scalogram at the point where the rate increases from 70 to 90 bpm. Note the sharp, high‐frequency spikes corresponding to individual QRS complexes (A and A′). The banded features (B and B′) denote lower frequency ECG components such as P and T waves. We did not observe any gradual transition of features at the rate boundary that might correspond with QT lag in this tracing. The lower frequency band (C and C′) corresponds to the heart rate. A reversal of these features is seen with rate reduction (example not shown). It can be seen that, as the rate increases, the temporal spacing of the isolated features decreases and the frequency bands shift upward on the plot. It is noteworthy that as the QRS complexes retain their morphology through the transition, the features A and A′ retain their frequency makeup in the time–frequency plane, that is, they do not move up the plane. This is in contrast to the movement of the bands B and B′ up the plane as the P and T waves subtly change morphology with rate.
Figure 2.
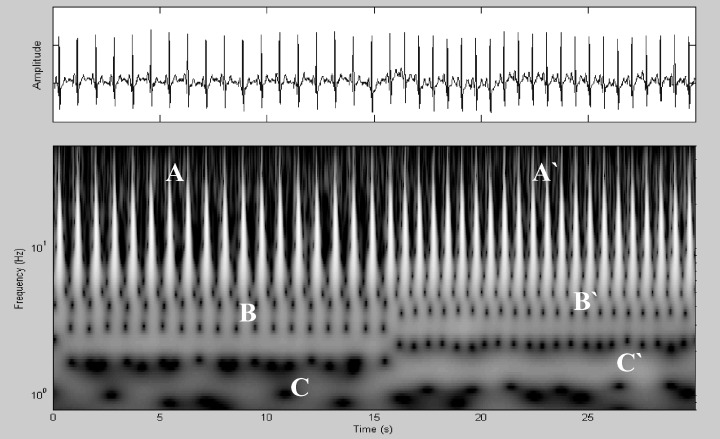
Close‐up of a rate transition point.
Figure 3 is a scalogram from the patient whose pacemaker was set to DDD pacing mode and the PR interval began to exceed the programmed paced AV interval as the atrial pacing rate was increased. The ECG in the upper part of the figure shows intrinsically conducted beats, followed by “fusion” beats where intrinsic ventricular depolarization is competing with ventricular paced beats and finally ventricular paced beats alone without competing intrinsically conducted beats. The wavelet scalogram shows a clear difference between the first and last parts of the trace with a transition point in between. Note that the wavelet band associated with the beat frequency shows a gradual increase in frequency from the beginning of the fusion region as indicated by the arrow in the plot. This band reverts to the prefusion intrinsic conduction frequency when conduction is no longer competing. In the fusion region, the frequency increases linearly between the two arrows superimposed on the plot from fb= 2 Hz, the frequency of the main band, to a maximum frequency of fm= 2.6 Hz (120–156 bpm) over a 1.8‐second period, that is, a rate of increase of 0.33 Hz per second (20 bpm per second). The onset of such a rapid increase in the frequency of the wavelet band associated with the beat frequency could serve as a useful marker for the fusion region and hence the transition between the intrinsic conduction and ventricular pacing.
Figure 3.

Onset of V pacing. The ridge of the wavelet band associated with the beat frequency is shown as dashed line in the plot. The ridge increases in frequency from fb= 2 Hz to fm= 2.6 Hz over the fusion region between the two arrows. This band reverts to the prefusion intrinsic conduction frequency when conduction is no longer competing.
Figure 4 is a scalogram from the patient whose pacemaker was set to AAI pacing mode and developed Second Degree Heart Block, type I (Wenckebach phenomenon) as the atrial pacing rate was increased. The ECG in the upper part of the figure initially shows a one‐to‐one relationship between P waves and QRS complexes, but at the half‐way point it can be seen that the QRS rate abruptly slows down in an irregular fashion consistent with every 3rd P wave not conducting through to the ventricles. Although it is difficult to see specific features in the ECG, there is a clear change in the scalogram with the onset of heart block. The constant banding seen in the scalogram prior to the block becomes oscillatory in nature, repeating its structure synchronous with the 3:2 conduction state. As with Figure 2, the wavelet space representation of the QRS features retain a constant form across the transition.
Figure 4.
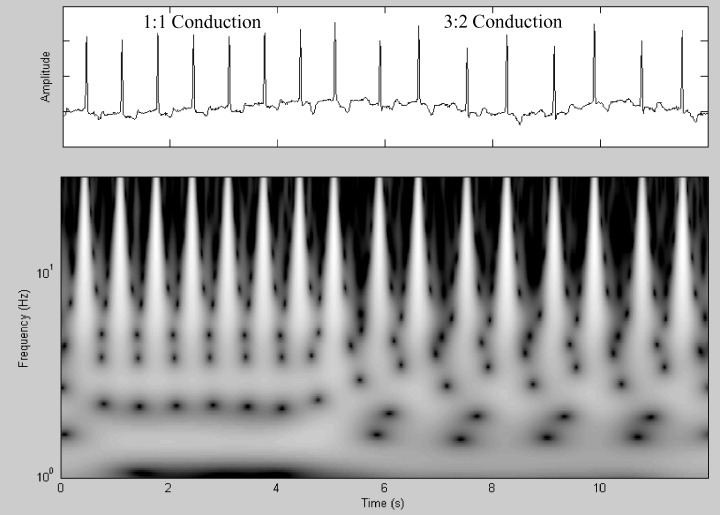
Wenckebach phenomenon.
DISCUSSION
Characterization of the rate‐dependent features of the ECG in a paced atrial rhythm by wavelet transform techniques has revealed some additional information not readily seen on single‐lead ECG analysis. This model provides a surrogate for changes that might be expected during rate changes in physiological sinus rhythm. Features such as the upward shifting of the frequency bands occurring with increasing heart rate and the reverse occurring with heart rate decrease suggest consistency in wavelet transform characteristics, whereas, the wavelet features associated with the QRS complexes retain their structure throughout the transition. Hence, the method allows for the decoupling of the heart‐rate‐dependent characteristics from the local morphology of the signal. This is particularly a compelling rationale for the use of time–frequency methods over traditional spectral‐ or temporal‐only methods. In particular, we have shown how the sudden onset of a rapid frequency increase associated with the fusion region of a pacing signal transitioning between intrinsic and ventricular conduction can be tracked using wavelet‐ridge‐following methods. This could particularly prove useful for signals containing excessive noise where signal‐peak‐picking algorithms may break down as the ridge‐following methods are generally more resistant to noisy perturbations. 13 An algorithm using a suitable trigger threshold for the rate of increase could be incorporated within the current devices; in this way these regions of concern may be detected in real time using a suitably programmed medical device. It is envisaged that wavelet band detection, selection, and interrogation methods that we have developed elsewhere for other biosignals 13 , 14 could be used to achieve this. Early, accurate, and noise‐resistant identification of the onset of ventricular conduction would have a wide range of uses within medical devices. Furthermore, high‐resolution continuous wavelet analysis methods have the advantage over other time–frequency methods (e.g., short‐time Fourier transform, Wigner‐Ville transform, etc.) of clear temporal localization for high‐frequency features. More detailed analysis would be required to determine whether the wavelet transform can unmask additional hidden information about T‐wave length and shape that would be of importance in real‐time ECG interpretation in patients with heart disease (e.g., T‐wave alternans, QT lag, etc.). Wavelet transform features alter strikingly with ventricular pacing and during Wenckebach phenomenon. This is an expected finding because of the gross morphological changes seen on the ECG when these phenomena occur. This suggests a role for these techniques in identification of abnormal conduction patterns, whether this be AV or intraventricular.
CONCLUSIONS
In this article we have applied the wavelet transform spectral analysis technique to an approximation of normal sinus rhythm in order to characterize rate‐dependent features. The key advantage of this technique is to preserve pertinent time–frequency information lost in other methods of analysis. This is particularly useful when analyzing points of rate change and conduction abnormalities as illustrated by 1, 2, 3, 4. It is envisaged that this method will offer advantages in detecting features of clinical significance that may not be readily seen by existing methods.
Applications of simple wavelet techniques based on the discrete wavelet transform are currently used in implantable cardiac devices to distinguish usual depolarization from the depolarization pattern associated with malignant arrhythmias. Refined wavelet techniques based on the high‐resolution CWT such as that described in this article may have useful roles in future devices and in other ECG‐based diagnostic tools such as continuous ECG monitoring, pace mapping in the electrophysiology laboratory, and the identification of important features not easily recognizable from standard ECG leads. Further research into the diagnostic possibilities and applications of this technique is required.
Acknowledgments
Acknowledgments: The authors would like to acknowledge the assistance of I Romero Leggaretta and the cardiac technicians at the Royal Infirmary of Edinburgh for data collection, and the patients who kindly allowed us to record their ECG while temporarily adjusting their pacemaker settings.
REFERENCES
- 1. Addison PS, Watson JN, Clegg GR, et al A novel wavelet based analysis reveals hidden structure in ventricular fibrillation. IEEE Eng Med Biol 2000;19: 383–392. [DOI] [PubMed] [Google Scholar]
- 2. Addison PS, Watson JN, Clegg GR, et al Evaluation of arrhythmic ECG signals using a novel wavelet transform method. Resuscitation 2000;43: 121–127.DOI: 10.1016/S0300-9572(99)00127-6 [DOI] [PubMed] [Google Scholar]
- 3. Addison PS, Watson JN, Clegg GR, et al Continuous wavelet transforms reveal rich structure in ventricular fibrillation. Technol Health Care 2001;9: 42–44. [Google Scholar]
- 4. Watson JN, Addison PS, Grubb N, et al Wavelet based filtering for the clinical evaluation of atrial fibrillation. 29th Annual International Conference of the IEEE Engineering in Medicine and Biology Society, Istanbul , Turkey , 2528 October, 2001.
- 5. Sahambi JS, Tandon SN, Bhatt RKP. Using wavelet transforms for ECG characterization. IEEE Eng Med Technol 1997;16: 77–83. [DOI] [PubMed] [Google Scholar]
- 6. Li C, Zheng C Tai C. Detection of ECG characteristic points using wavelet transforms. IEEE Trans Biomed Eng 1995;42: 21–28.DOI: 10.1109/10.362922 [DOI] [PubMed] [Google Scholar]
- 7. Ivanov PC, Rosenblum MG, Peng C‐K, et al Scaling behaviour of heartbeat intervals obtained by wavelet‐based time‐series analysis. Nature 1996;383: 323–327.DOI: 10.1038/383323a0 [DOI] [PubMed] [Google Scholar]
- 8. Wiklund U, Akay M, Niklasson U. Short‐term analysis of heart‐rate variability by adapted wavelet transforms. IEEE Eng Med Biol 1997;16: 113–118.DOI: 10.1109/51.620502 [DOI] [PubMed] [Google Scholar]
- 9. Thurner S, Feurstein MC, Teich MC. Multiresolution wavelet analysis of heartbeat intervals discriminates healthy patients from those with cardiac pathology. Phys Rev Lett 1998;80: 1544–1547.DOI: 10.1103/PhysRevLett.80.1544 [DOI] [Google Scholar]
- 10. Addison PS. The illustrated wavelet transform handbook: applications in science engineering, medicine and finance. Bristol , Institute of Physics Publishing, 2002. [Google Scholar]
- 11. Addison PS, Watson JN, Feng T. Low‐oscillation complex wavelets. J Sound Vibration 2002;254: 733–762.DOI: 10.1006/jsvi.2001.4119 [DOI] [Google Scholar]
- 12. Mallat S. Wavelet tour of signal processing. San Diego , Academic Press, 1998. [Google Scholar]
- 13. Addison PS, Watson JN. Secondary transform decoupling of shifted nonstationary signal modulation components. Int J Wavelets Multires Inf Proc 2004;2: 43–57.DOI: 10.1142/S0219691304000329 [DOI] [Google Scholar]
- 14. Leonard P, Beattie TF, Addison PS, et al Standard pulse oximeters can be used to monitor respiratory rate. Emerg Med J 2003;20: 524–525.DOI: 10.1136/emj.20.6.524 [DOI] [PMC free article] [PubMed] [Google Scholar]