

Abstract
Background: Commonly used techniques for QT measurement that identify T wave end using amplitude thresholds or the tangent method are sensitive to baseline drift and to variations of terminal T wave shape. Such QT measurement techniques commonly underestimate or overestimate the “true” QT interval.
Methods: To find the end of the T wave, the new Philips QT interval measurement algorithms use the distance from an ancillary line drawn from the peak of the T wave to a point beyond the expected inflection point at the end of the T wave. We have adapted and optimized modifications of this basic approach for use in three different ECG application areas: resting diagnostic, ambulatory Holter, and in‐hospital patient monitoring. The Philips DXL resting diagnostic algorithm uses an alpha‐trimming technique and a measure of central tendency to determine the median QT value of eight most reliable leads. In ambulatory Holter ECG analysis, generally only two or three channels are available. QT is measured on a root‐mean‐square vector magnitude signal. Finally, QT measurement in the real time in‐hospital application is among the most challenging areas of QT measurement. The Philips real time QT interval measurement algorithm employs features from both Philips DXL 12‐lead and ambulatory Holter QT algorithms with further enhancements.
Results: The diagnostic 12‐lead algorithm has been tested against the gold standard measurement database established by the CSE group with results surpassing the industrial ECG measurement accuracy standards. Holter and monitoring algorithm performance data on the PhysioNet QT database were shown to be similar to the manual measurements by two cardiologists.
Conclusion: The three variations of the QT measurement algorithm we developed are suitable for diagnostic 12‐lead, Holter, and patient monitoring applications.
Keywords: QT interval, QT measurement algorithm, resting ECG, ambulatory ECG, in‐hospital QT monitoring
The advanced algorithm research group of Philips Healthcare has recently developed a novel algorithm for QT measurement that has produced encouraging test results. 1 This technique and modifications of this basic approach have been adapted and optimized for use in three different application areas, namely resting electrocardiographic (ECG) diagnosis, ambulatory Holter ECG, and in‐hospital patient monitoring. 2 , 3
Philips QT Interval Measurement Technique
A number of procedures have been proposed over the years by various investigators for the measurement of the ECG QT interval. Is is well known that the main difficulty encountered is accurate identification of the end of the T wave. The traditionally used techniques commonly establish a broad search window at the expected T‐wave end and attempt to identify T‐wave end using an amplitude threshold from the ECG baseline, or a threshold value of the first or second derivative of the amplitude of the T‐wave downslope and their various combinations. Finally, the so‐called tangent method uses extrapolation of the least‐squares fit to the downslope of the T wave and searches for the intersection of this line with the ECG baseline. Procedures using ECG baseline produce variability on the QT measurement due to the arbitrariness of the choice of the ECG baseline (T‐P or QRS wave onset) and are sensitive to ECG baseline drift. 4 Various slope methods depend on arbitrary thresholds and are fooled by variations in the shape of the terminal T wave. Thus, traditional QT measurement procedures commonly underestimate or overestimate the “true” QT interval.
The new Philips QT interval measurement technique uses an ancillary line from the peak of the T wave to a point beyond the expected inflection point at the end of the T wave as shown in Figure 1. The end of the T wave is simply identified at the time point of the maximum difference between the ancillary line and the ECG signal. Exact location of the endpoint of this line is not particularly critical as long as it is beyond the true T‐wave end, and neither is its dependent on the ECG baseline. Baseline wander is removed prior to measurement via either filtering or cubic‐spline estimation. Some other refinements are used to prevent errors. The slope of the ancillary line is limited to prevent creating a line which is either too steep or too flat. The algorithm is applied to signal‐averaged waveforms, and if the noise exceeds a predefined level, an additional smoothing algorithm is applied prior to measurement. The above logic with some modifications is also used to identify the earliest QRS onset used for QT measurement. Depending on the application, the algorithm is either used on each lead independently, or is applied to a waveform generated from a combination of leads, such as the root‐mean‐square (RMS) waveform or its derivative.
Figure 1.
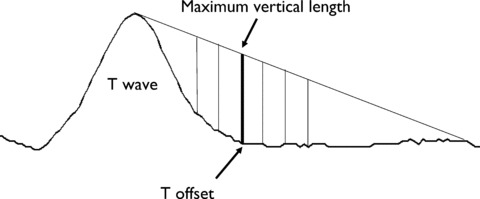
The Philips QT measurement technique for finding T‐wave offset. A line is drawn from the top of the T wave to a heart‐rate adjusted point forward in time. The vertical distance from each sample point on the waveform to the line is computed, and the time point of the maximum vertical distance is considered the T‐wave offset. The same technique is used for Q onset, except the direction is reversed.
Diagnostic QT Interval Measurements from Resting ECG
The resting ECG available for diagnostic interpretation is generally a 10‐second record and contains 12 or more leads. The short time interval available poses a few challenges for accurate QT interval measurement due to the limited number of beats available for signal averaging. Only short‐term quality control measures in signal processing are possible with such short records. Our approach is to measure the QT interval independently on each available lead to minimize the probability of corrupting a combined waveform with noisy data from one or just a few leads. For each lead, beats with similar morphology from the 10‐second ECG record are selected to generate an arithmetic averaged representative beat. The Philips QT measurement technique described above is then applied to the representative beat of each lead for QT interval measurement.
For standard diagnostic use of the 12‐lead electrocardiogram, a single valued “global QT” measurement is desired. In principle, the global QT is often considered as the earliest onset of QRS to the latest offset of T among all leads sampled and evaluated simultaneously, commonly evaluated from a composite “spatial magnitude” curve. Based on thorough studies and testing, the Philips QT measurement technique differs from such global QT evaluation techniques. We use an alpha‐trimming technique and a measure of central tendency to determine the median QT value of the eight most reliable leads. A lead is considered reliable if the beat‐by‐beat onset and offset determinations have a variance below a threshold. This approach helps to eliminate leads with small amplitudes and high respiratory variation as well as leads with high noise content.
The Philips DXL algorithm has been tested against the gold standard measurement database established by the CSE group. The test results indicate that the QT measurements by the Philips DXL algorithm pass the industrial ECG measurement accuracy standards with high margins as shown in Table 1. In a recent independent study, no significant systematic differences in QT interval measurements were found in comparison with another commercial QT algorithm. 5 The Philips 12‐lead algorithm provides commonly used Bazett and Fridericia heart‐rate corrections. Users can choose to use either one or both of them. When used in QT study, drug‐induced QT prolongation was observed clearly. 6 The Philips DXL 12‐lead ECG interpretation algorithm is age and gender dependent. Age‐ and gender‐specific QT limits are applied in long QT diagnosis. 7
Table 1.
List Below are Mean Differences (Philips 12‐lead Algorithm Minus References) and Standard Deviations of Major Interval Measurements (PR, QRS, and QT) by Philips 12‐Lead Algorithm
| Measurement | IEC Proposed Standards (ms) | Philips 12‐Lead Diagnostic Algorithm (ms) | ||
|---|---|---|---|---|
| Mean | Standard Deviation | Mean | Standard Deviation | |
| PQ interval | ±10 | <10 | −0.5 | 2.8 |
| QRS duration | ±10 | <10 | 3.8 | 3.3 |
| QT interval | ±30 | <25 | −1.8 | 5.6 |
International Electrotechnical Commission (IEC) proposed standard refers to the industrial standard for testing medical electrical equipment IEC 60601–2‐51: Partial requirements for the safety, including essential performance, of recording and analyzing single channel and multichannel electrocardiographs.
Measurement of QT Intervals from Ambulatory Holter ECG
Ambulatory Holter ECG recording provides QT measurements from up to 72 hour‐long ECGs for more thorough QT analysis. It is particularly useful in evaluation of the dynamic behavior of QT interval especially in studies of cardiac effects of pharmaceutical agents. 8 Fewer ECG leads are usually available for analysis of these long ECG records, and a lower sampling rate is often used than in analysis of diagnostic ECG records. The artifact and noise content is also higher with body movements in these ambulatory patients. The advantage is that Holter ECG is retrospectively analyzed on a PC, and processing time is not an issue
In the Philips Holter system, automatic analysis is performed on all available channels of ECG data. The first step is to remove baseline wander using cubic‐spline subtraction on each ECG channel, and subsequently, moving average templates are created. Complexes that are not morphologically close to the current composite template created are rejected. For each lead, the arithmetic average of the last eight “normal” beats is kept as a template. The oldest beat is subtracted out as a new beat is added in. Template matching is done to find the point of best match. The templates are then combined into an RMS vector magnitude signal. The Philips QT measurement technique is used for evaluation of the time points of the end of the T wave and as well as for the onset of the QRS complex. For QRS onset, the ancillary line is drawn back from the peak of the first QRS wave, whether positive or negative, to the PR segment beyond the inflection point at the onset of QRS. This algorithm is insensitive to signal amplitudes and residual isoelectric displacements.
Philips Zymed Holter QT measurement algorithm performance data were compared with cardiologists' manual measurements on the PhysioNet QT database and also published results. 2 These investigators reported evaluation data from QRS onset and T end measurements from 105 ECGs. The performance of the Philips automatic algorithm is comparable to the cardiologists' manual measurements and has smaller standard deviations than the intervariability in cardiologists' manual measurements and also the results from the research algorithm. 9
The QT corrections for heart rate include the commonly used Bazett's square root, Fridericia's cube root, linear and exponential formulas. Special handling of low heart rates (<60 bpm) is also provided as an option to eliminate overcorrection by most of the correction formulas. Holter QT application provides QT and QTc measurements in both graphic and tabular formats. Tabular QT interval measurement reports show QT and QTc values averaged over the chosen time interval (Table 2). If a 30‐second or 1‐hour interval is chosen, the QT/QTc measurements are divided into 30‐second or 1‐hour windows and an averaged QT/QTc value is calculated for each window by averaging all the QT interval measurements in the 30‐second or 1‐hour window.
Table 2.
A Sample Philips Holter QT and QTc (Bazatt) Report in Tabular Form
| Time Ending | QT Summary | ||||||||
|---|---|---|---|---|---|---|---|---|---|
| HR Min | HR Avg | HR Max | QT Min | QT Avg | QT Max | QTc Min | QTc Avg | QTc Max | |
| Setting | |||||||||
| 5:00 PM | 67 | 82 | 101 | 306 | 414 | 552 | 365 | 450 | 583 |
| 6:00 PM | 65 | 75 | 95 | 289 | 429 | 596 | 339 | 459 | 624 |
| 7:00 PM | 68 | 79 | 105 | 299 | 416 | 604 | 361 | 451 | 626 |
| 8:00 PM | 72 | 81 | 94 | 312 | 531 | 597 | 362 | 570 | 633 |
| 9:00 PM | 67 | 78 | 103 | 296 | 499 | 616 | 356 | 534 | 644 |
| 10:00 PM | 68 | 76 | 88 | 332 | 506 | 623 | 366 | 540 | 651 |
| 11:00 PM | 67 | 76 | 101 | 306 | 458 | 642 | 363 | 490 | 667 |
| 12:00 AM | 66 | 78 | 90 | 292 | 399 | 638 | 329 | 436 | 663 |
| 1:00 AM | 65 | 77 | 97 | 318 | 455 | 646 | 366 | 489 | 673 |
| 2:00 AM | 65 | 74 | 86 | 334 | 396 | 556 | 377 | 425 | 576 |
| 3:00 AM | 64 | 72 | 94 | 309 | 467 | 749 | 346 | 493 | 761 |
| 4:00 AM | 64 | 69 | 91 | 343 | 550 | 760 | 391 | 568 | 772 |
| 5:00 AM | 64 | 68 | 82 | 329 | 458 | 738 | 365 | 476 | 749 |
| 6:00 AM | 64 | 71 | 101 | 321 | 445 | 740 | 379 | 467 | 752 |
| 7:00 AM | 64 | 73 | 100 | 318 | 413 | 665 | 374 | 439 | 677 |
| 8:00 AM | 64 | 68 | 85 | 342 | 517 | 770 | 375 | 534 | 782 |
| 9:00 AM | 64 | 73 | 97 | 318 | 472 | 758 | 370 | 495 | 770 |
| 10:00 AM | 64 | 70 | 93 | 335 | 491 | 755 | 385 | 511 | 767 |
| 11:00 AM | 65 | 76 | 86 | 329 | 484 | 653 | 375 | 515 | 674 |
| 12:00 PM | 63 | 71 | 86 | 346 | 500 | 758 | 388 | 524 | 770 |
| 1:00 PM | 64 | 72 | 101 | 318 | 404 | 539 | 375 | 429 | 565 |
| 2:00 PM | 63 | 71 | 95 | 332 | 517 | 688 | 383 | 539 | 707 |
| 3:00 PM | 65 | 83 | 107 | 290 | 509 | 644 | 354 | 547 | 662 |
| 4:00 PM | 76 | 86 | 96 | 264 | 514 | 574 | 316 | 557 | 611 |
| Total | 63 | 75 | 107 | 264 | 466 | 770 | 316 | 494 | 782 |
Note the averaged, minimal (in bold), and maximal (in bold) values of HR, QT, and QTc (Bazett) are listed by 1‐hour interval.
Real Time QT Interval Monitoring Algorithm
In the hospital setting, real time QT interval monitoring is important since many patients are administered potentially proarrhythmic drugs which may lead to QT prolongation and possibly torsade de pointes. 10 , 11 Institutions that have QT monitoring protocols as recommended by the recent AHA practice standard typically use manual QT interval measurements made every 4–8 hours. This measurement is usually done on one beat and one lead on a printed ECG strip or by using electronic calipers on the monitoring system. Calculation of heart‐rate corrected QTc is then based on a single RR interval. Such infrequent manual QT measurement on a randomly selected single beat will not be representative since significant beat‐to‐beat variation exists due to both manual measurement error and actual QT interval changes. A real time QT monitoring algorithm was needed to better respond to the requirements in this QT monitoring situation.
The real time QT interval measurement algorithm has used features from both Philips DXL 12‐lead and Zymed Holter QT algorithms, and has also added real time QT alarms and QT trending capabilities to suit the hospital monitoring systems. In addition to fewer leads, frequent muscle noise, electromagnetic interference, and motion artifacts, the biggest challenge is that the real time QT monitoring application has processing time constraints and unavailability of complete waveform morphology and rhythm analysis outputs. The advantages are that the availability of longer‐term data allows a more refined computation of signal quality, T‐wave amplitude measures, and signal‐averaging based on longer time intervals.
Signal‐averaged complexes from the available leads are used to generate the RMS waveform which is used to determine T offset and the QRS onset. QT interval is corrected by heart rate using an alpha‐trimmed 60‐second average. Median filtering of the QTc values over 5 minutes is used to produce stable QTc measurements for displaying and trending. The stability of QTc measurements is particularly important for eliminating false QTc alarms. Both alarm limits for long QTc and QTc changes are user adjustable. In addition, age‐specific limits and algorithm thresholds are used to adjust for adult, pediatric, and neonatal age groups. Search regions are heart‐rate dependent, so that the algorithm will perform well in pediatric and neonatal ECGs with higher heart rate than typical for adults. The RMS ECG approach was not found to be a problem in neonatal ECG monitoring where often only one lead is used. This generalized approach of measuring the RMS signal allows the algorithm methodology to be consistent whether only one or up to 12 leads are available for monitoring. As illustrated in Figure 5, performance results on a large data set (n = 247) containing the PhysioNet QT database and additional cardiologist annotated ECGs (adult n = 161, pediatric n = 20, neonate n = 66) have shown excellent sensitivity and accuracy. 11
DISCUSSION
The Philips algorithm for identification of the end of the T wave, the most challenging problem in QT measurement, produces stable and reliable QT measurements in all three ECG application areas discussed above, the diagnostic resting ECG analysis, ambulatory Holter ECG, and real‐time in‐hospital QT monitoring. The demands of these three application areas differ, and the signal processing logic requires justifications to each.
The QT measurement algorithm for standard resting ECG in the Philips 12‐lead diagnostic program differs from traditional approaches that use the so‐called global QT. Based on thorough studies and testing, we found that an alpha‐trimming technique and a measure of central tendency to determine the median QT value of the independently measured eight most reliable leads produce more accurate QT measurements in comparison with results obtained from other methods we have used or experimented. The test results indicate that our QT measurements greatly surpass the recommended standards (Table 1).
The Philips Zymed Holter QT algorithm used techniques for noise control, including creation of moving average templates from eight most recent morphologically similar complexes and template matching. The templates are then combined into a RMS vector magnitude signal. The Zymed Holter QT algorithm has proven robust in a commercially available two‐ or three‐channel ambulatory QT application. The Holter QT application provides flexible reports showing heart rate and QTc changes for user selected time windows in graphic and tabular formats. Performance testing using the PhysioNet data set indicated that the QRS onset and T end measurement differences were less than 5 ms which is equivalent to one sample point compared with the cardiologists' visual measurements and that results were equally accurate as those reported by Jane et al. 9
The special handling of muscle noise and motion artifact problem in the real time monitoring QT algorithm uses both high‐ and low‐frequency noise detections to discard noisy beats, and signal averaging in adjacent 60‐second intervals to reduce remaining muscle noise and electromagnetic interference. A series of empirical tests suggested that combination and modification of the QT detection and measurement techniques from the diagnostic and ambulatory ECG applications were necessary in the real time in‐hospital QT monitoring application, the most difficult area of QT analysis.
Another problem encountered is that when a limited number of ECG leads are available, biphasic T wave or inverted T wave poses an issue for the RMS vector magnitude due to zero‐crossings. A compensation technique was used to eliminate this problem. Our observation agrees with previous publications. The algorithm may be confused by large U and P waves at high heart rate. Bundle branch blocks in ambulatory and real time monitoring complicate detection of QT prolongation and may trigger false QTc alarms.
In summary, the two approaches we use in three different applications, namely diagnostic 12‐lead, ambulatory Holter, and real time monitoring, provide comparable stable and accurate QT interval measurements. 12 The two methods have different technical requirements and suitable for different environments. We found that the QT measurement approach based on alpha‐trimming and measurement of central tendency is most suitable for applications with 12 or more available leads. This method is more sensitive, amplitude independent and works well on short ECG records. It demands more computation and is not suitable for long ECG recordings and real time applications. On the other hand, measuring QT interval based on the RMS waveform is fast, simple, computationally efficient, and provides stable measurements even on as few as one lead. This approach is most suitable for ECG applications with limited and varied number of leads, long‐term and real time recordings with computational constrains.
CONCLUSIONS
Test data suggest that the Philips QT interval measurement algorithms are efficient, robust, and adequately accurate in diagnostic resting ECG analysis, ambulatory Holter ECG, and in‐hospital patient monitoring. Particularly important is the availability of real time QT monitoring which in high risk patients can capture early signs of QT prolongation and help prevent potentially malignant arrhythmias.
Conflicts of Interest: The authors are employees of Philips Healthcare.
REFERENCES
- 1. Lindauer J, Gregg R, Helfenbein E, et al Global QT measurements in the Philips 12‐lead Algorithm. J Electrocard 2005;38(Suppl.):90. [Google Scholar]
- 2. Feild DQ. QT measurement performance in a Holter application. J Electrocardiol 2005;38(Suppl.):34. [Google Scholar]
- 3. Helfenbein E, Zhou S, Lindauer J, et al An algorithm for continuous real‐time QT interval monitoring. J Electrocardiol 2006;39(4S):123–127. [DOI] [PubMed] [Google Scholar]
- 4. Murray A, McLaughlin NB, Bourke JP, et al Errors in manual measurement of QT intervals. Br Heart J 1994;71:386–390. [DOI] [PMC free article] [PubMed] [Google Scholar]
- 5. Kligfield P, Hancock EW, Helfenbein ED, et al Relationship of QT interval measurements to evolving automated algorithm from different manufacturers of elctrocardiographs. Am J Cardiol 2006;98:88–92. [DOI] [PubMed] [Google Scholar]
- 6. Lindauer JM, Agin M, Stock T. Automated QT measurements for moxifloxicin and physiologic challenge in health volunteers. J Electrocardiol 2007;40(Suppl):S32. [Google Scholar]
- 7. Rautaharju P, Zhou S, Wong S, et al Sex differences in the evolution of the electrocardiographic QT interval with age. Can J Cardiol 1992;8:690–695. [PubMed] [Google Scholar]
- 8. Sarapa N, Morganroth J, Couderc JP, et al Electrocardiographic identification of drug‐induced QT prolongation: Assessment by different recording and measurement methods. Ann Noninvasive Electrocardiol 2004;9:48–57. [DOI] [PMC free article] [PubMed] [Google Scholar]
- 9. Jane R, Blasi A, Garcia J, et al Evaluation of an automatic threshold based detector of waveform limits in Holter ECG with the QT database. IEEE Comput Cardiol 1997;24:295–298. [Google Scholar]
- 10. Moss A. QTc prolongation and sudden cardiac death. J Am Coll Cardiol 2006;47:368–369. [DOI] [PubMed] [Google Scholar]
- 11. Helfenbein ED, Ackerman M, Rautaharju PM, et al An algorithm for QT interval monitoring in neonatal intensive‐care units. J Electrocardiol 2007;40(Supp):S103–S110. [DOI] [PubMed] [Google Scholar]
- 12. Gregg RE, Feild DQ, Helfenbein ED, et al Comparison of two automated methods for QT interval measurements. IEEE ComputCardiol 2007;34:427–430. [Google Scholar]